South Korea Sensors Market Size and Share
Market Overview
| Study Period | 2020 - 2031 |
|---|---|
| Forecast Data Period | 2026 - 2031 |
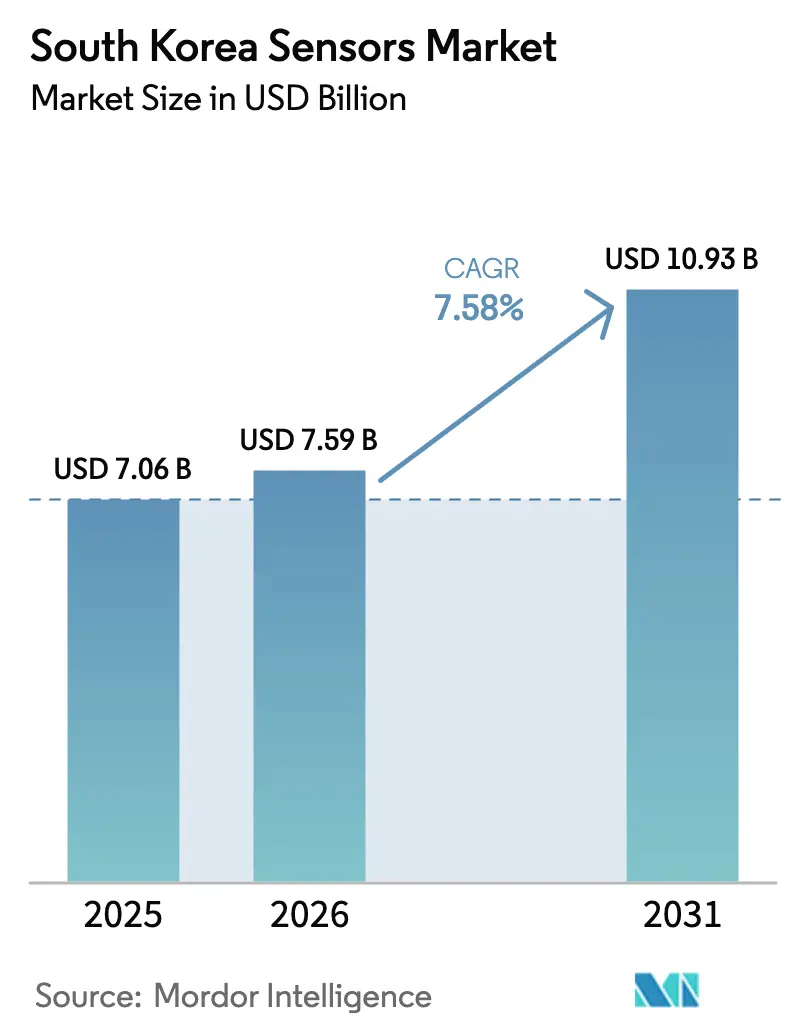
| Base Year Market Size (2025) | USD 7.06 Billion |
| Market Size (2026) | USD 7.59 Billion |
| Market Size (2031) | USD 10.93 Billion |
| Growth Rate (2026 - 2031) | 7.58% CAGR |
| Market Concentration | Medium |
Major Players *Disclaimer: Major Players sorted in no particular order Image © Mordor Intelligence. Reuse requires attribution under CC BY 4.0. | |
South Korea Sensors Market Analysis by Mordor Intelligence
The South Korea sensors market size was valued at USD 7.06 billion in 2025 and estimated to grow from USD 7.59 billion in 2026 to reach USD 10.93 billion by 2031, at a CAGR of 7.58% during the forecast period (2026-2031). Demand accelerated as government-backed digital-transformation programs intersected with private-sector innovation, especially in Internet-of-Things deployments for smart-city projects.[1]Ministry of Science and ICT, “2021 Action Plan for Digital New Deal,” msit.go.kr Parallel investments in domestic semiconductor fabs strengthened the production base for micro-electro-mechanical-systems (MEMS) devices, which captured 61.4% of the technology segment in 2024. Automotive electrification, stringent air-quality rules, and expanding wearable-healthcare adoption rounded out the principal demand drivers shaping the South Korea sensors market.
Key Report Takeaways
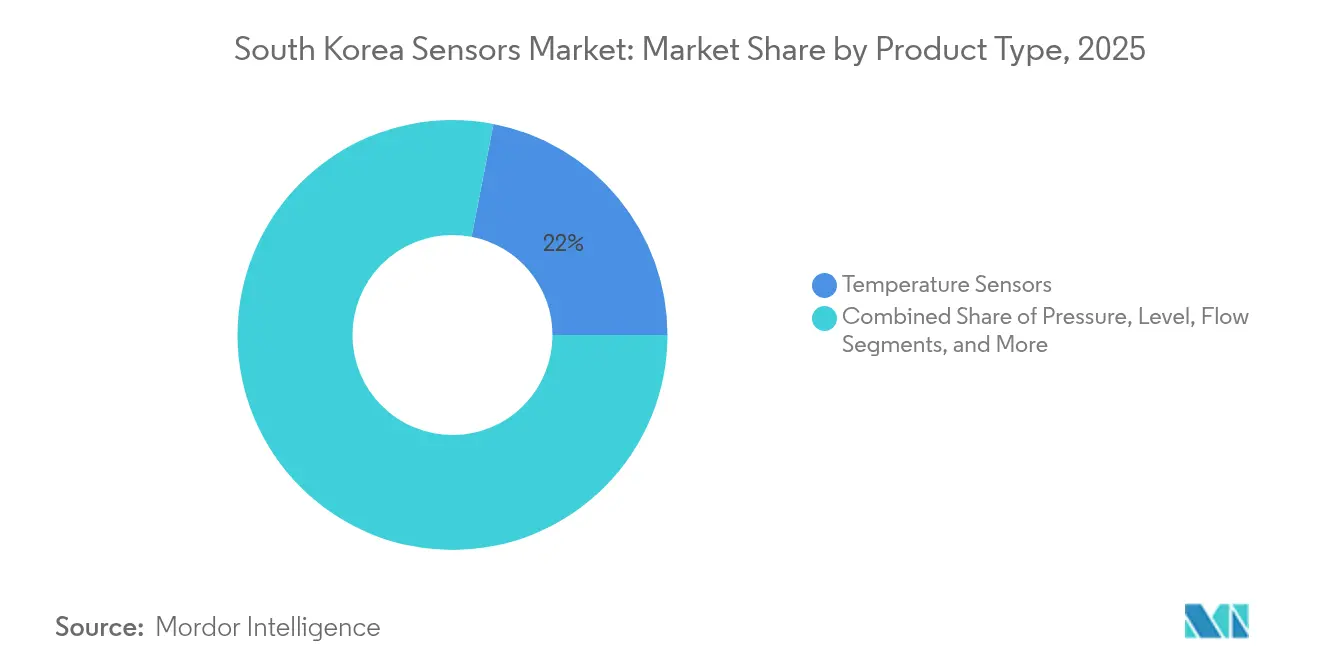
- By product type, temperature sensors led with 21.95% of South Korea sensors market share in 2025, while LiDAR sensors were forecast to post the fastest 2026-2031 CAGR at 14.72%.
- By mode of operation, optical sensors commanded 17.92% revenue in 2025; radar sensors were poised for a 18.6% CAGR through 2031.
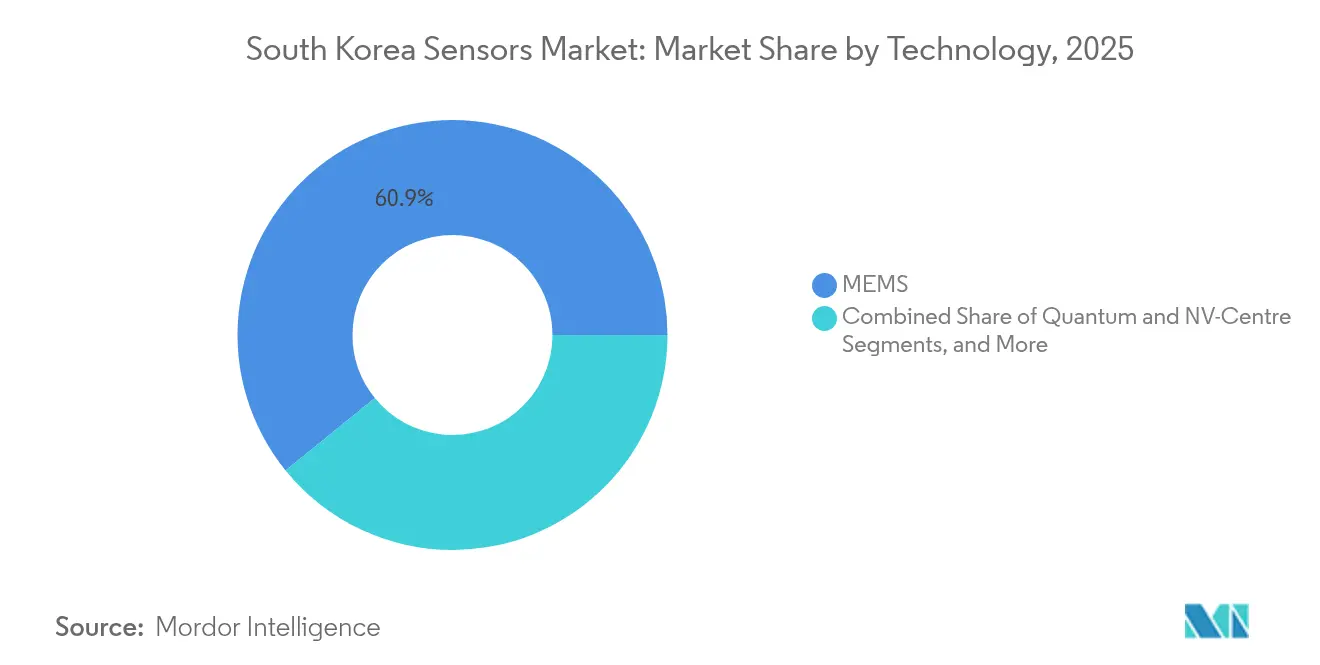
- By technology, MEMS accounted for 60.85% of 2025 revenue, whereas quantum and NV-centre sensors were projected to surge at a 24.3% CAGR between 2026 and 2031.
- By end-user industry, consumer electronics generated 33.75% of 2025 revenue; automotive applications were set to register a 12.72% CAGR to 2031.
Note: Market size and forecast figures in this report are generated using Mordor Intelligence’s proprietary estimation framework, updated with the latest available data and insights as of 2026.
Competitive positioning in South korea includes both locally based firms and those operating across multiple regions. The market landscape in the global sensors industry research shows how these players are arranged internationally.
South Korea Sensors Market Trends and Insights
Drivers Impact Analysis*
| Driver | (~) % Impact on CAGR Forecast | Geographic Relevance | Impact Timeline |
|---|---|---|---|
| Government "Digital New Deal" Accelerating Smart-City and 5G IoT Deployments | 2.8% | National, with early implementation in Seoul, Busan, and Daegu | Medium term (2-4 years) |
| Expansion of Domestic Semiconductor Fabs into Advanced MEMS Packaging | 1.9% | Concentrated in Gyeonggi Province and Greater Seoul Area | Long term (≥ 4 years) |
| Automotive Electrification and ADAS Demand from Hyundai–Kia Supply Chain | 1.3% | National, with manufacturing hubs in Ulsan and Gwangju | Medium term (2-4 years) |
| Stringent Air-Quality Regulations Driving Environmental Sensor Adoption | 1.0% | Seoul Metropolitan Area, industrial zones nationwide | Short term (≤ 2 years) |
| Rapid Growth of Wearable Healthcare Devices for the Aging Population | 0.7% | National, with a concentration in urban areas | Medium term (2-4 years) |
| Early 6G Testbeds Requiring High-Bandwidth Photonic Sensors | 0.5% | Research centres in Seoul, Daejeon, and Busan | Long term (≥ 4 years) |
| Source: Mordor Intelligence | |||
Government “Digital New Deal” Accelerating Smart-City and 5G IoT Deployments
The Digital New Deal allocated KRW 58.2 trillion in funding through 2025, spurring a 14.3% expansion of the domestic data market and drawing more than 170,000 small and mid-sized enterprises into smart-infrastructure projects. Flagship undertakings such as the National Strategic Smart City Program created unified data hubs for transportation, energy management, and air-quality monitoring. Pilot deployments in Daegu used slope-collapse and flood-prediction sensors to cut disaster-related losses by 20%. These initiatives cemented institutional demand for integrated sensing solutions and reinforced the growth trajectory of the South Korea sensors market.
Expansion of Domestic Semiconductor Fabs into Advanced MEMS Packaging
Samsung’s multi-year, USD 230 billion investment plan to build a next-generation fabrication cluster underpinned a structural capacity upgrade for MEMS sensor production. The K-Semiconductor tax strategy, offering 15% credits for large firms and 25% for smaller ones, further incentivised capital spending across the supply chain. As a result, national semiconductor investment climbed from USD 19.7 billion in 2023 to an expected USD 29.2 billion in 2025, enhancing cost efficiencies and reinforcing the competitiveness of the South Korea sensors market.
Automotive Electrification and ADAS Demand from Hyundai–Kia Supply Chain
Hyundai Motor and Kia, working with KAIST, set up an on-chip LiDAR research laboratory aimed at mass-producing compact systems from 2025. Parallel collaborations with Samsung, LG, and SK advanced chipset and camera-module integration, while LG Innotek targeted KRW 2 trillion in automotive-sensor revenue by 2030.[2]The Korea Times, “LG Innotek Gears Up to Turn Vehicle Sensor Unit into USD 1.4 Billion Business by 2030,” koreatimes.co.kr These alliances bolstered domestic demand for smart sensing, solidifying the automotive segment as the fastest-growing pillar of the South Korea sensors market.
Stringent Air-Quality Regulations Driving Environmental-Sensor Adoption
The Environment Ministry sought to reduce fine-dust concentrations by 35% by 2030, a policy that pushed investment into continuous-emission and ambient-air monitoring equipment. PM2.5 levels reached record lows in 2024, aided by stricter industrial caps and CleanSYS, a nationwide real-time pollution-tracking network that linked plant-level sensors to central control rooms. The regulatory tailwind translated into rising orders for environmental sensors and enriched the revenue outlook for the South Korea sensors market.
Restraints Impact Analysis*
| Restraint | (~) % Impact on CAGR Forecast | Geographic Relevance | Impact Timeline |
|---|---|---|---|
| Dependence on Imported Rare-Earth and Wafer-Level Packaging Materials | 1.4% | Global, with particular vulnerability to China's supply chain disruptions | Medium term (2-4 years) |
| High Up-Front R&D Costs Limiting SME Participation | 1.1% | National, with a greater impact on technology startups | Medium term (2-4 years) |
| Price Pressure from Chinese Tier-2 Sensor Vendors | 0.9% | National, with a greater impact in the consumer electronics segment | Short term (≤ 2 years) |
| Fragmented Industry-Specific Interface Standards | 0.6% | Global, affecting interoperability across sectors | Long term (≥ 4 years) |
| Source: Mordor Intelligence | |||
Dependence on Imported Rare-Earth and Wafer-Level Packaging Materials
South Korean chipmakers imported the bulk of key minerals and advanced packaging substrates from China, exposing the sensor supply chain to geopolitical and logistics risks. A widening trade deficit in semiconductor equipment illustrated the vulnerability, while US export-control policies shaved 32% off memory-chip exports in 2024. The fragility of upstream inputs weighed on manufacturing continuity and kept raw-material costs volatile within the South Korea sensors market.
High Up-Front R&D Costs Limiting SME Participation
The Ministry of Science and ICT lifted its 2025 R&D budget to a record KRW 19 trillion, including a near-doubling of quantum-sensor funding to KRW 13.8 billion. Yet the long payback period of sensor innovation still deters smaller firms. Start-ups such as SolidVue continued to seek Series B capital to commercialise single-chip LiDAR solutions, underlining the financing barrier that restricted broader participation and slowed diversification within the South Korea sensors market.
*Our forecasts treat driver/restraint impacts as directional, not additive. The impact forecasts reflect baseline growth, mix effects, and variable interactions.
Segment Analysis
By Product Type: Temperature Sensors Dominate While LiDAR Accelerates Innovation
Temperature sensors generated 21.95% of 2025 revenue, underpinning a broad installed base in industrial processes, consumer devices, and vehicle power-trains, thereby anchoring the South Korea sensors market. Their ubiquity stemmed from South Korea’s manufacturing profile, where accurate thermal control protected yield and safety. Complementary adoption in home appliances and battery packs reinforced steady volume demand during 2024-2025.
LiDAR devices formed the quickest-expanding category with a 14.72% forecast CAGR to 2031, propelled by autonomous-vehicle pilot programs and mobility-as-a-service trials led by domestic automakers. SolidVue’s 128 m long-range prototype showcased cost-efficient system-on-chip designs that cut size and bill-of-materials. Parallel patent activity at LG Innotek positioned the country as an emerging design centre for high-performance optical ranging, strengthening the South Korea sensors market footprint in global LiDAR supply.
Pressure, flow, and proximity sensors maintained predictable uptake, aligning with smart-factory rollouts that sought real-time process control. Environmental and chemical variants benefited from tightening emission norms, while inertial and magnetic sensing rode gradual demand increases in e-mobility and industrial automation. Position and current sensors filled control-loop niches in power electronics and factory equipment, preserving balanced growth across the South Korea sensors market product landscape.


By Mode of Operation: Optical Leadership with Radar Momentum Building
Optical devices, dominated by CMOS image and VCSEL modules, held 17.92% revenue share in 2025, reflecting national leadership in display and imaging semiconductors. Smartphone, camera, and appliance segments assured baseline volumes, while vehicle front-camera penetration advanced additional demand streams.
Radar sensors were forecast to expand at a 18.6% CAGR to 2031, buoyed by advanced driver-assistance and industrial safety applications. Bitsensing’s multipurpose modules demonstrated scalability beyond automotive, reinforcing radar’s versatility. Electrical-resistance and piezoresistive formats stayed essential for strain and pressure measurement, and capacitive interfaces dominated touch panels across consumer electronics, ensuring diverse operational profiles within the South Korea sensors market.
By Technology: MEMS Dominance with Quantum Sensors Emerging
MEMS technology contributed 60.85% of 2025 revenue and remained the manufacturing mainstay, given its alignment with the national semiconductor ecosystem. Fab capacity additions promised cost road-map improvements, further cementing share leadership.
Quantum and NV-centre devices, though nascent, were poised for a 24.3% CAGR through 2031 in niche applications such as magnetic anomaly detection, gravimetry, and secure communication links. Government grants encouraged research institutions to miniaturise diamond-NV magnetometers, signalling strategic intent to cultivate this high-value segment and diversify the South Korea sensors market technology mix.
By End-User Industry: Consumer Electronics Leadership with Automotive Acceleration
Consumer electronics accounted for 33.75% of 2025 sales, anchored by Samsung and LG appliance and smartphone portfolios that embedded increasingly intelligent sensing functions. Energy-efficient refrigerators, air purifiers, and wearable devices sustained sensor integration density, maintaining the South Korea sensors market’s largest revenue pool.
Automotive applications were projected to grow at 12.72% CAGR between 2026 and 2031, reflecting surging electric-vehicle output and ADAS penetration. Valeo’s Daegu plant launch underscored foreign suppliers’ confidence in localised production, while Hyundai–Kia tie-ups secured domestic pull for LiDAR, radar, and power-train sensing.
Industrial, energy, medical, and construction verticals collectively contributed balanced incremental demand as policy incentives for smart factories and AI-enabled healthcare accelerated adoption. Agriculture and mining opened smaller but rising opportunities through smart-farming pilots and safety-monitoring systems, progressively enlarging the South Korea sensors market use-case spectrum.
Geography Analysis
The Greater Seoul Area generated significant revenue in 2024 owing to dense electronics manufacturing, premier research universities, and flagship smart-city projects funded under the Digital New Deal. The USD 471 billion semiconductor super-cluster announced for Gyeonggi Province added long-term capacity for MEMS and advanced-packaged devices, anchoring the South Korea sensors market supply centre.
The southeastern industrial belt—including Busan, Ulsan, and Daegu—contributed another major revenue chunk thanks to automotive assembly plants and adjacent part suppliers that demanded advanced sensing for electrification, battery management, and ADAS lines. Smart-port and logistics projects in Busan further elevated maritime and environmental sensor orders.
Central and western regions such as Daejeon and Gwangju recorded a nominal share of the market, backed by national research institutes and pilot deployments in quantum sensing, structural-health monitoring, and precision agriculture. Remaining rural zones absorbed 4.80%, with growth steered by public-sector initiatives that trialled sensor-equipped greenhouses and environmental dashboards, expanding the geographic footprint of the South Korea sensors market.
Mordor Intelligence tracks the sensors market across other major regions such as Asia and Europe, with additional country-level coverage spanning China, Japan, United States, and Taiwan, each reflecting localized structural drivers, restraints and more.
Competitive Landscape
Global specialists and diversified Korean conglomerates shaped a moderately fragmented arena in which temperature and pressure categories remained diffuse, whereas LiDAR and quantum niches showed higher concentration. Strategic partnerships delivered edge-computing-ready solutions rather than stand-alone components, mirroring end-user preference for integrated systems. Hyundai–Kia’s LiDAR laboratory with KAIST and Infineon’s long-term SiC supply agreement exemplifies vertically coupled models securing assured sensor flow for automotive lines.
Technology differentiation increasingly hinged on sensor-plus-algorithm bundles. Samsung’s Bespoke appliance range integrated vision sensors with on-device AI for ingredient recognition, highlighting blended hardware-software value capture. Local champions such as SolidVue and Bitsensing leveraged focused R&D to carve out positions in LiDAR and radar, while Hamamatsu Photonics Korea boosted capacity for semiconductor-failure-analysis tools, broadening applications for photonic sensing. Collectively, these moves sustained healthy rivalry and continual innovation across the South Korea sensors market.
South Korea Sensors Industry Leaders
ams OSRAM AG
Bosch Sensortec GmbH
TDK Corporation
Sensirion AG
STMicroelectronics NV
- *Disclaimer: Major Players sorted in no particular order

Recent Industry Developments
- April 2025: GA-ASI and Hanwha Aerospace agreed to co-develop unmanned aircraft systems, pledging KRW 300 billion to new facilities and employment creation.
- March 2025: Hamamatsu Photonics Korea completed its Hwaseong factory for advanced semiconductor-analysis equipment.
- February 2025: SEMICON Korea hosted 500 exhibitors and 70,000 professionals, highlighting a 10% industry CAGR outlook to 2030.
- January 2025: SolidVue unveiled a 128 m automotive LiDAR prototype scheduled for customer shipments in 2025.


Research Methodology Framework and Report Scope
Market Definitions and Key Coverage
Our study defines the South Korea sensors market as all revenue generated from factory-built devices that detect a physical condition, such as pressure, temperature, light, motion, flow, or chemical presence, and convert it to an electronic signal that can be processed, displayed, or transmitted. We follow the value of new sensor hardware sold inside the country, irrespective of whether the unit is imported or domestically produced, and we allocate sales to the year in which ownership transfers.
Scope Exclusions: Software-only analytics platforms and refurbished sensors are outside our scope.
Segmentation Overview
- By Product Type
- Temperature
- Pressure
- Level
- Flow
- Proximity
- Environmental (Humidity, Gas and Combo)
- Chemical
- Inertial
- Magnetic
- Hall-Effect Sensors
- Other Magnetic Sensors
- Position
- Current
- Other Types
- By Mode of Operation
- Optical
- Electrical Resistance
- Biosensor
- Piezoresistive
- Image
- Capacitive
- Piezoelectric
- LiDAR
- Radar
- Other Modes of Operation
- By Technology
- MEMS
- CMOS / IC Sensors
- Fiber-Optic
- Quantum and NV-Centre
- Others (O-NEMS, Thin-Film)
- By End-User Industry
- Automotive
- Consumer Electronics
- Energy
- Industrial and Others
- Medical and Wellness
- Construction, Agriculture and Mining
- Aerospace
- Robotics
Detailed Research Methodology and Data Validation
Primary Research
We held structured interviews with South Korean wafer fabs, module assemblers, Tier-1 automotive suppliers, and IoT device OEMs, while short surveys captured adoption plans from utilities, hospital networks, and semiconductor clean rooms. Their insights clarified true factory gate pricing, local content rules, and the pace at which automotive ADAS packages are embedding radar and LiDAR units, enabling us to refine model coefficients.
Desk Research
Our analysts first mapped supply, demand, and trade using tier-1 public sources such as the Korea Customs Service import database, Bank of Korea electronics output index, UN Comtrade shipment codes, and Korean Intellectual Property Office patent filings for MEMS and LiDAR designs. We supplemented these baselines with technical bulletins from the Korea Electronics Technology Institute, quarterly investor filings, and press releases that disclose unit volumes or average selling prices. Subscription datasets from D&B Hoovers and Dow Jones Factiva then helped us cross-check company-level revenue splits across temperature, optical, and inertial sensor lines. These combined materials framed the starting universe of volumes, pricing corridors, and penetration ratios. The sources cited here are illustrative; many additional publications were reviewed for validation and context.
Market-Sizing & Forecasting
A top-down production plus trade reconstruction established the 2025 baseline, which we then corroborated through selective bottom-up roll-ups of sampled ASP x unit shipments reported by key MEMS and optical sensor makers. Key variables like smartphone output, EV production, industrial robot installations, average sensor ASP drift, and government IoT capital grants drive the model. Multivariate regression links these indicators to historical market value and projects them forward, while scenario analysis stress tests high-tech export controls and currency swings. Data gaps where supplier splits were incomplete were bridged using averaged ratios from confirmed peers before final triangulation.
Data Validation & Update Cycle
Every draft passes anomaly checks and a senior analyst review. If fresh customs releases or corporate earnings shift the picture by more than 5 percent, we reconvene respondents and refresh the model. Reports update annually, with interim flashes after material events.
Why Our South Korea Sensors Baseline Earns Stakeholder Trust
Published values often diverge because firms mix component scopes, convert currencies differently, or refresh on uneven cadences.
Key gap drivers here include (a) rivals counting only 'smart' sensors while we capture all hardware, (b) others applying blanket ASP declines without segment nuance, and (c) infrequent model refreshes that miss aggressive EV and robotics expansion now visible in 2025 customs data.
Benchmark comparison
| Market Size | Anonymized source | Primary gap driver |
|---|---|---|
| USD 7.06 Bn (2025) | Mordor Intelligence | - |
| USD 7.73 Bn (2024) | Regional Consultancy A | Smart sensor scope only; assumes single ASP trend across technologies |
| USD 3.05 Bn (2024) | Trade Journal B | Excludes imported units and uses shipment counts without local price conversion |
In short, our balanced top-down build, verified by ground-level interviews, delivers a transparent, repeatable baseline that decision-makers can track confidently as South Korea's sensor landscape evolves.


Key Questions Answered in the Report
What is the current value of the South Korea sensors market?
The market was valued at USD 7.59 billion in 2026 and was projected to reach USD 10.93 billion by 2031.
Which sensor type held the largest share in 2024?
Temperature sensors led with 21.95% of South Korea sensors market share in 2025.
Why are LiDAR sensors growing rapidly in South Korea?
Accelerated autonomous-vehicle programs and domestic R&D investment have positioned LiDAR for a 14.72% CAGR through 2031.
How important is the automotive sector to future growth?
Automotive applications are expected to expand at a 12.72% CAGR as electrification and ADAS adoption widen.
What regional area contributes most to sensor demand?
The Greater Seoul Area generates roughly 44.30% of national revenue owing to its dense electronics and semiconductor ecosystem.
What is the major supply-chain risk for local manufacturers?
Heavy reliance on imported rare-earths and packaging substrates exposes producers to geopolitical and logistics disruptions.
Page last updated on:


