
Market Overview
| Study Period | 2020 - 2031 |
|---|---|
| Market Size (2026) | USD 6.5 Billion |
| Market Size (2031) | USD 8.92 Billion |
| Growth Rate (2026 - 2031) | 6.55 % |
| Fastest Growing Market | Asia Pacific |
| Largest Market | Asia Pacific |
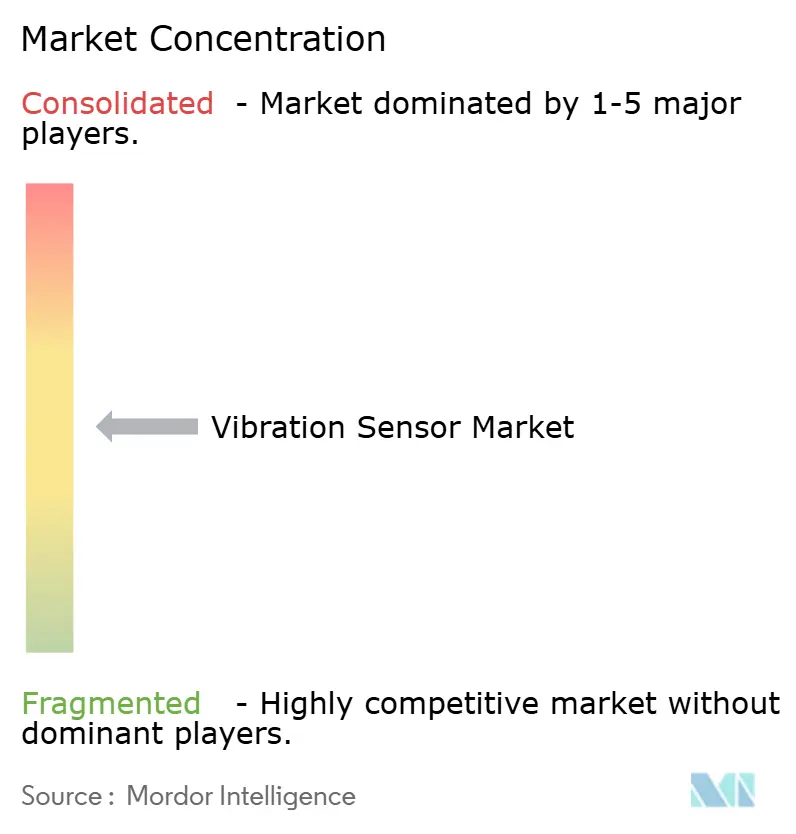
| Market Concentration | Medium |
Major Players *Disclaimer: Major Players sorted in no particular order Image © Mordor Intelligence. Reuse requires attribution under CC BY 4.0. | |
Vibration Sensor Market Analysis by Mordor Intelligence
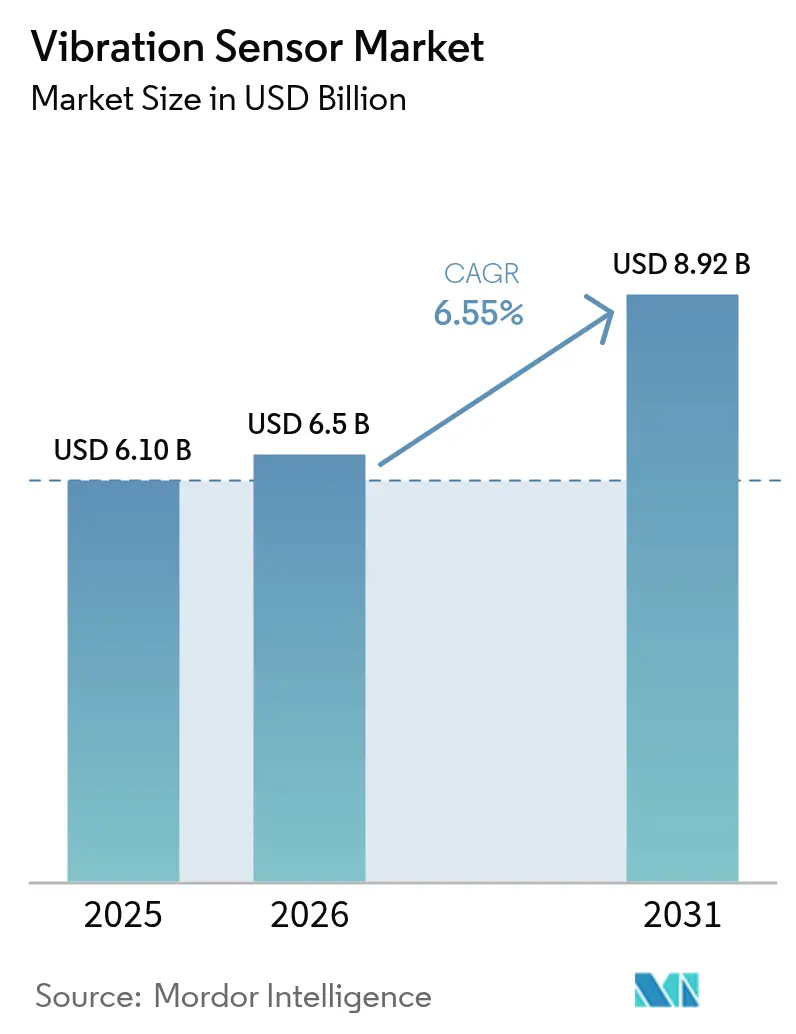
The vibration sensor market size is expected to grow from USD 6.10 billion in 2025 to USD 6.5 billion in 2026 and is forecast to reach USD 8.92 billion by 2031 at 6.55% CAGR over 2026-2031. Continued investment in predictive maintenance programs, miniaturized MEMS designs, and stricter machinery-health regulations accelerated adoption across factories, wind farms, and vehicle plants. Asia-Pacific manufacturers, wind turbine owners, and automotive assemblers directed much of this spending, aided by falling sensor prices and local semiconductor capacity expansions. Wireless connectivity reduced installation costs, and edge-AI firmware cut data traffic, making sensors viable for remote or hazardous sites. Meanwhile, supply-chain diversification gained urgency after China’s 2025 export controls on rare-earth inputs used in ceramic sensing elements.[1]MainRich Magnets, “China's 2025 Rare Earth Export Controls: A Comprehensive Guide for Importing Sintered NdFeB Magnets,” mainrichmagnets.com
Key Report Takeaways
- By product type, accelerometers held 53.85% of the vibration sensor market share in 2025, while wireless velocity sensors were projected to advance at a 8.75% CAGR through 2031.
- By technology, piezoelectric devices led with 46.05% share in 2025, but MEMS devices were the fastest growing at a 9.85% CAGR to 2031.
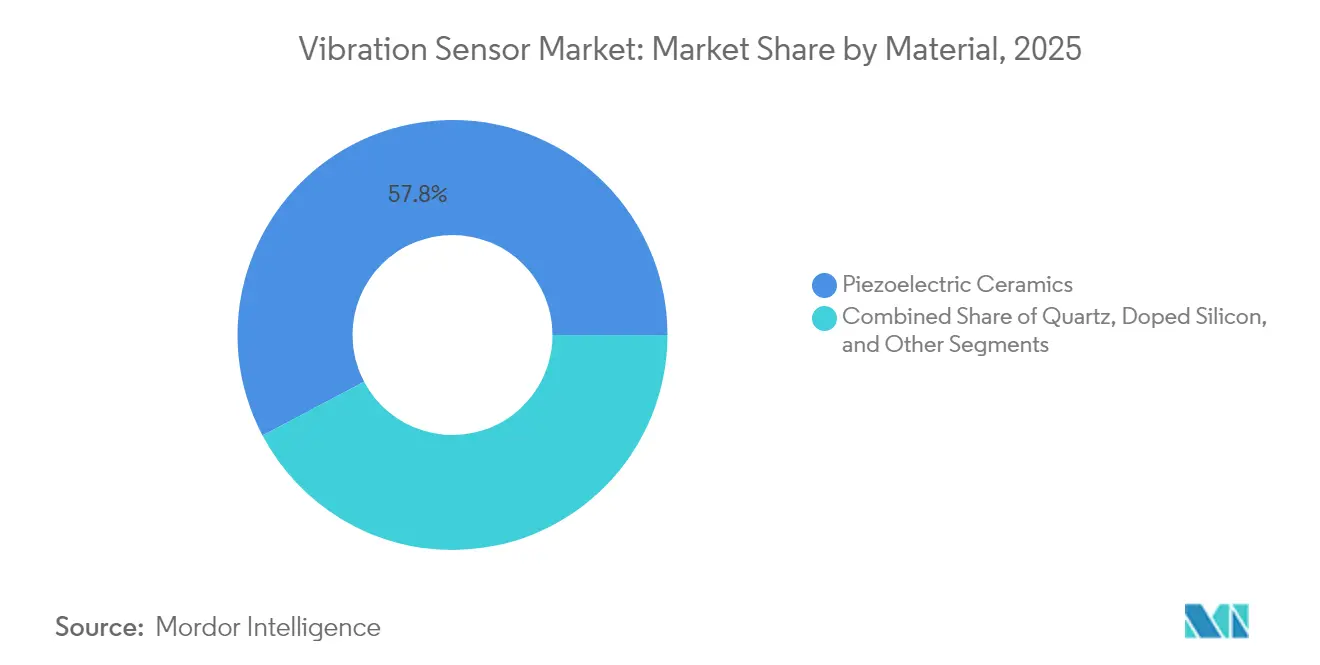
- By material, piezoelectric ceramics accounted for 57.75% share of the vibration sensor market size in 2025, whereas doped silicon substrates were expected to expand at a 7.55% CAGR.
- By end-use industry, industrial manufacturing commanded a 26.85% share in 2025, yet automotive applications were set to grow at an 8.45% CAGR through 2031.
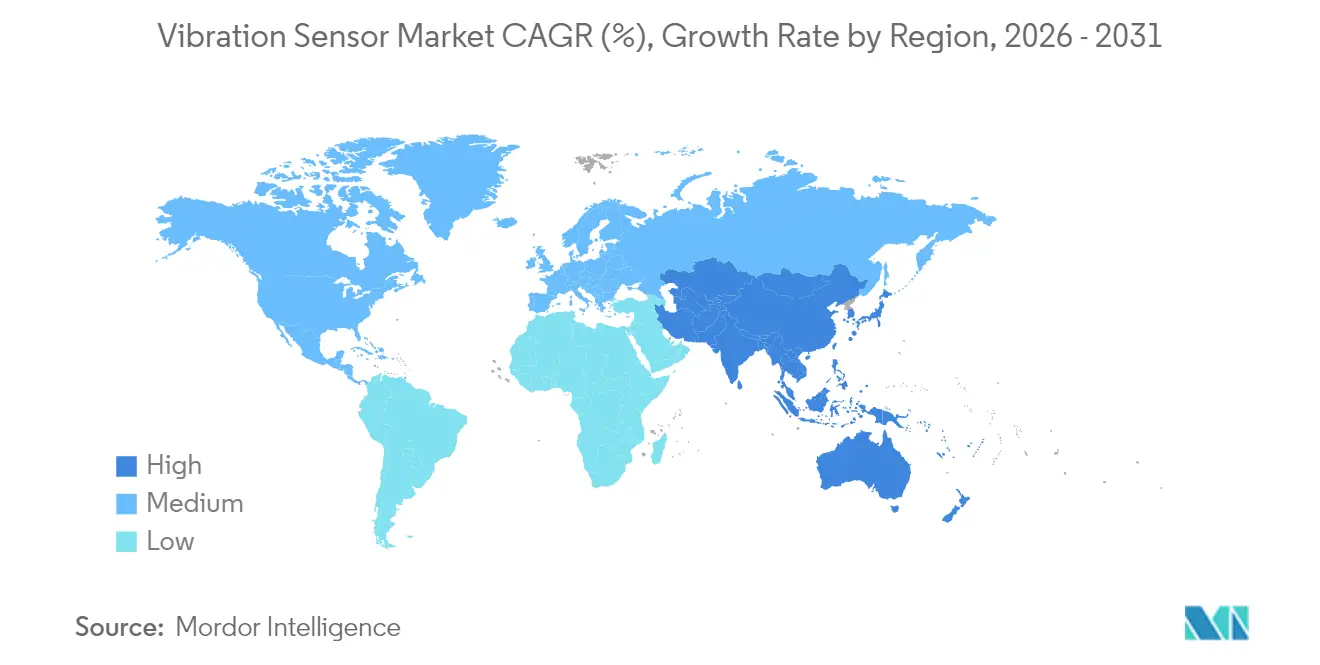
- By geography, Asia-Pacific contributed 33.90% revenue in 2025 and was forecast to post an 8.05% CAGR, retaining regional leadership.
Note: Market size and forecast figures in this report are generated using Mordor Intelligence’s proprietary estimation framework, updated with the latest available data and insights as of 2026.
Market Trends and Insights
Drivers Impact Analysis of Vibration Sensor Market*
| Driver | (~) % Impact on CAGR Forecast | Geographic Relevance | Impact Timeline |
|---|---|---|---|
| Proliferation of Predictive Maintenance Programs in Continuous Process Industries (Asia Pacific) | +1.8% | Asia-Pacific core, spill-over to MEA | Medium term (2-4 years) |
| Rise of Wireless MEMS Sensors for Hazardous Oil and Gas Sites (Middle East) | +1.2% | Middle East and North America | Short term (≤ 2 years) |
| Edge-AI Enabled Diagnostics in Automotive Assembly (Europe) | +1.5% | Europe and North America | Medium term (2-4 years) |
| Mandatory ISO 20816 Compliance in EU and North America | +0.9% | EU and North America | Short term (≤ 2 years) |
| Expansion of Wind Turbine Installations (Nordics and China) | +1.1% | Nordics, China, spill-over to Global | Long term (≥ 4 years) |
| Miniaturization Demand from Wearables and Hearables | +0.8% | Global | Medium term (2-4 years) |
| Source: Mordor Intelligence | |||
Proliferation of Predictive Maintenance Programs in Continuous Process Industries
Asia-Pacific plant operators used predictive maintenance to reduce unplanned downtime costs by up to 50%, relying on dense sensor grids that stream high-frequency data to analytics engines. Early projects such as the Nordic Sugar steam-dryer retrofit demonstrated 13-day fault-prediction windows, validating payback for large chemical and steel sites. Continuous monitoring displaced periodic walk-by inspections, and edge-computing chips embedded in nodes lowered latency to millisecond levels. Chinese stimulus for Industry 4.0 upgrades-maintained momentum, embedding thousands of devices per facility. Consequently, the vibration sensor market gained long-run recurring demand from maintenance budgets rather than capital expenditure cycles.
Rise of Wireless MEMS Sensors for Hazardous Oil and Gas Sites
Offshore platforms and refineries adopted certified wireless nodes that eliminated costly cable runs through ATEX zones. Battery lives exceeded three years, and piezoelectric energy harvesters further prolonged service intervals. Operators valued retrofit capability without shutting down throughput that could otherwise cost USD 50,000 per hour. Embedded FFT processing in each sensor produced actionable bearing-wear metrics, reducing the need for on-site vibration analysts. These benefits widened the addressable base and lifted the vibration sensor market in hydrocarbon economies that historically lagged digital-maintenance adoption.
Edge-AI Enabled Diagnostics in Automotive Assembly
European carmakers fitted edge-AI sensors to robotic arms and conveyor motors to detect micro-defects invisible to cameras or human inspectors. BMW’s Hams Hall plant avoided costly stoplines by flagging anomalies in under a millisecond. Analog Devices’ Voyager4 module filtered raw data on board, shrinking transmissions and extending battery life by 50%. Electric-vehicle lines introduced new high-speed motor harmonics, prompting frequent algorithm retraining but reinforcing the need for flexible firmware. As a result, the vibration sensor market captured a technology-driven upswing in European and North American vehicle factories.
Mandatory ISO 20816 Compliance in EU and North America
The ISO 20816-3:2022 standard codified vibration limits for industrial machines above 15 kW, obliging operators to install continuous monitoring on compressors, pumps, and turbines.[2]ISO, “ISO 20816-3:2022 Mechanical Vibration — Measurement and Evaluation of Machine Vibration — Part 3,” iso.org Evaluation zones tied vibration levels directly to maintenance triggers, steering buyers toward high-resolution sensors. Vendors such as Monnit offered devices tuned to the 10-200 Hz band aligned with compliance thresholds. Avoiding regulatory penalties and insurance surcharges kept purchase urgency high, bolstering short-term uptake in the vibration sensor market.
Restraints Impact Analysis of Vibration Sensor Market*
| Restraint | (~) % Impact on CAGR Forecast | Geographic Relevance | Impact Timeline |
|---|---|---|---|
| Calibration Drift of Piezoelectric Sensors at Extreme Temperatures | -0.7% | Global, particularly harsh environments | Short term (≤ 2 years) |
| Data-Security Concerns in Cloud-based Analytics (Defense) | -0.5% | North America and EU defense sectors | Medium term (2-4 years) |
| Shortage of Specialty Piezo-ceramic Materials (China Export Quotas) | -0.9% | Global supply chain | Short term (≤ 2 years) |
| Source: Mordor Intelligence | |||
Calibration Drift of Piezoelectric Sensors at Extreme Temperatures
Piezoelectric elements experienced output deviations above 110 °C, with errors hitting 1.06% at moderate heating rates. Frequent recalibration raised lifecycle costs in turbines and aerospace engines where thermal cycling was routine. High-temperature single-crystal alternatives operated reliably beyond 600 °C but commanded premium pricing. Developers explored compensation circuits and dual-sensor configurations, yet complex designs limited mass-market appeal. The resulting performance–price trade-off slowed deployments in harsh-duty niches of the vibration sensor market.
Data-Security Concerns in Cloud-based Analytics (Defense)
Defense and critical-infrastructure operators hesitated to stream vibration signatures into public clouds, fearing espionage or sabotage risks. Air-gapped or one-way data paths mitigated threats but curbed advanced pattern-recognition services. Edge processing offered a compromise, yet required on-site compute resources and secure firmware update channels. As a result, cybersecurity compliance slowed adoption in sensitive aerospace, naval, and pipeline assets, trimming growth potential for the vibration sensor market in those segments.
*Our forecasts treat driver/restraint impacts as directional, not additive. The impact forecasts reflect baseline growth, mix effects, and variable interactions.
Vibration Sensor Market Segment Analysis
By Product Type:
Accelerometers Drive Market While Velocity Sensors AccelerateAccelerometers generated 53.85% revenue in 2025, underpinning the vibration sensor market size of USD 6.10 billion through their tri-axial versatility in vehicles, smartphones, and factory motors. Wireless velocity devices, though smaller in value, led growth at 8.75% CAGR to 2031 as refinery and pipeline engineers valued velocity’s direct correlation with bearing health.
The miniaturization push spurred next-generation accelerometers such as Bosch Sensortec’s BMA580, which reduced package volume by 76% while meeting sensitivity targets for hearables. Edge filtering in these chips cuts outbound data by transmitting only anomalies, conserving bandwidth in mesh networks. Parallel advances in energy harvesting prolonged node life, enabling five-year maintenance intervals on remote assets. Together, these enhancements allowed the vibration sensor market to broaden into wearables and condition-based lubrication systems previously constrained by power or size limits.




By Technology:
MEMS Innovation Challenges Piezoelectric DominancePiezoelectric elements retained a 46.05% share in 2025 thanks to low-frequency sensitivity, but MEMS shipments expanded at a 9.85% CAGR as semiconductor fabs delivered wafer-level economies. The vibration sensor market benefited from single-die integration that collapsed discrete analog front-ends into compact system-on-chip packages.
Texas Instruments’ ultrasonic lens-cleaning demo highlighted MEMS versatility, using programmable vibrations to remove contaminants from automotive cameras. Foundry advances enabled multi-axis arrays measuring sub-g vibrations suitable for structural-health monitoring. Meanwhile, piezoresistive and capacitive designs served ultra-low-power wearables where duty cycles were sparse. This diversified portfolio allowed OEMs to choose architectures based on bandwidth, cost, and power, expanding overall penetration of the vibration sensor market.
By Material:
Doped Silicon Gains Ground Against Ceramic LeadershipPiezoelectric ceramics delivered 57.75% of 2025 shipments, yet doped silicon grew at 7.55% CAGR as export quotas lifted prices for ceramic precursors. The vibration sensor market size for silicon solutions was forecast to widen as 200 mm MEMS lines amortized faster and integrated electronics reduced assembly cost.
Quartz filled high-precision niches, while flexible polymer films entered biomedical patches that required skin compliance. Hybrid stacks combining silicon MEMS and thin ceramic layers balanced cost and sensitivity, catering to midsized industrial users. These material shifts diversified sourcing footprints, partially insulating the vibration sensor market from geopolitical supply shocks.
By End-Use Industry:
Automotive Growth Outpaces Manufacturing LeadershipIndustrial manufacturing generated 26.85% revenue in 2025, anchored by continuous-process plants that embedded thousands of nodes per site. Automotive lines, however, were projected to rise at 8.45% CAGR, adding USD 0.93 billion to the vibration sensor market size by 2031 as EV drivetrains introduced new monitoring points.
Edge-AI firmware allowed instant rejection of defective battery cells on conveyors, while in-vehicle sensors predicted motor-bearing wear before warranty lapses. Oil and gas retained steady demand for explosion-proof wireless units, and power-generation operators equipped wind turbines to optimize blade pitch maintenance. Collectively, these verticals sustained a broad buyer base and underpinned recurring growth for the vibration sensor market.
Geography Analysis
APAC Vibration Sensor Market
Asia-Pacific led with a 33.90% share in 2025 as China’s wind-turbine roll-outs and India’s semiconductor design centers lifted local demand. The region’s 8.05% CAGR also out-paced global averages, preserving its leadership through 2031. Japanese precision-machinery firms ordered high-resolution sensors for robotics, further enlarging the vibration sensor market in the bloc.
North America Vibration Sensor Market
North America followed, driven by ISO compliance in chemical plants and aerospace programs requiring radiation-tolerant devices. US defense retrofits favored edge-processed units that remained air-gapped, mitigating cybersecurity exposure. Canadian miners installed ruggedized wireless mesh networks across remote pits where wired runs were impractical, adding niche demand to the vibration sensor market.
Nordics Vibration Sensor Market
Europe exhibited advanced maturity, exemplified by BMW’s sensor-equipped robo-dogs patrolling engine plants. Nordic offshore wind farms fitted high-channel-count systems on 15 MW turbines to monitor yaw and blade harmonics. Strict worker-safety directives assured steady upgrades, keeping the vibration sensor market resilient despite macroeconomic headwinds.
South America and MEA Vibration Sensor Market
South America and the Middle East/Africa remained emerging but dynamic. Brazilian miners and agribusiness processors began installing condition-monitoring kits, aided by falling MEMS costs. Gulf-region NOCs embraced ATEX-rated wireless sensors for flare stacks and compressors, quickly expanding the vibration sensor market footprint in hazardous-area deployments.

Regulatory Landscape
International standards continue to shape market access and procurement for vibration sensors used in machinery condition monitoring. ISO 20816-3:2022 (machine vibration evaluation for industrial machines above 15 kW) serves as a key compliance anchor in the EU and North America for setting vibration severity limits and maintenance triggers. ISO 16063 series, including ISO 16063-31 for vibration calibration using reference accelerometers, is also widely cited to validate sensor accuracy in industrial and manufacturing environments.
Trade and national standards updates can affect sourcing and qualification requirements. In January 2026, the United States implemented a 25% ad valorem duty on certain imported semiconductors and derivative products under Section 232 (as reflected in Federal Register Proclamation 2026-01052 and related CBP implementation guidance). This can shift landed cost structures for MEMS-based vibration sensors and modules. In Japan, the Japanese Industrial Standards Committee (JISC) revised JIS C 5400:2026 (July 2026), adding AEC-Q100 Grade 1 vibration durability testing requirements for industrial MEMS accelerometers used in automotive and IoT applications, raising qualification expectations for suppliers targeting Japanese OEM programs.
Value Chain Analysis
The vibration sensor value chain covers raw materials and wafer inputs (piezoelectric ceramic materials, doped silicon substrates, ASICs, packaging compounds, and magnets/rare-earth-linked inputs for adjacent components), followed by sensor design and fabrication (MEMS and piezoelectric element processing). It then moves through packaging, assembly, calibration, and final test aligned to standards such as ISO 16063. Downstream, sensors reach customers through direct OEM design-in (automotive, industrial machinery, wind-turbine OEMs), industrial distribution channels, and condition-monitoring ecosystem partners that bundle sensors with gateways, software, and service contracts.
Supply risk and integration strategies have become more visible due to material constraints and geopolitical exposure. The report context highlights China export controls (2025) on rare-earth inputs used in ceramic sensing elements, which reinforces dual-sourcing and material diversification (including shifts toward doped silicon and wafer-level MEMS scale). On integration, industrial groups increasingly combine sensing hardware with analytics and services, and consolidation helps them manage specialized sensing IP and calibration capability; for instance, Spectris completed the acquisition of Piezocryst Advanced Sensorics GmbH in December 2024 to strengthen piezoelectric sensing capabilities that feed into higher-end vibration and pressure sensor offerings.
Competitive Landscape
The market was moderately fragmented in 2025. Emerson expanded analytics depth by completing its USD 8.2 billion acquisition of National Instruments, combining sensors with LabVIEW-grade software. SKF augmented service revenues by acquiring John Sample Group’s lubrication management unit, linking vibration thresholds with automated grease systems. Honeywell collaborated with Qualcomm to embed 5G chipsets in low-power sensor gateways, adding bandwidth for higher-sample-rate data.[4]Honeywell, “Honeywell and Qualcomm Work to Revolutionize Energy Sector With 5G, Low Power Wireless and AI-enabled Solutions,” honeywell.com
Start-ups focused on piezoelectric micromachined ultrasonic transducers and conformable array patents, pursuing flexible peel-and-stick sensors that conformed to complex machinery shapes. Component giants such as Texas Instruments released integrated hot-swap eFuses and radar SoCs that complemented sensor nodes with power and perception ICs. Amid talent shortages, many incumbents forged software alliances to embed machine-learning libraries into firmware rather than building from scratch, sharpening differentiation in the vibration sensor market.
White-space opportunities persisted in energy harvesting, cybersecurity-hardened protocols, and API standards that allowed multi-vendor data fusion. Vendors able to bundle hardware, software, and long-term service contracts stood to command premium margins. However, price pressure on commodity accelerometers encouraged scale manufacturers in Taiwan and Mainland China to chase volume, intensifying rivalry across low-end tiers of the vibration sensor market.
Vibration Sensor Industry Leaders
SKF GmbH
Bosch Sensortec GmbH (Robert Bosch GmbH)
Honeywell International Inc.
Emerson Electric Corporation
Texas Instruments Incorporated
- *Disclaimer: Major Players sorted in no particular order
Vibration Sensor Market Companies Covered in this Report
- Emerson Electric Co.
- SKF AB
- Honeywell International Inc.
- Analog Devices Inc.
- TE Connectivity Ltd
- Bosch Sensortec GmbH
- Texas Instruments Inc.
- National Instruments Corp.
- Rockwell Automation Inc.
- NXP Semiconductors N.V.
- Parker Hannifin Corp.
- Baker Hughes (Bently Nevada)
- Wilcoxon Sensing Technologies
- PCB Piezotronics Inc.
- Meggitt PLC (Sensing Systems)
- IMI Sensors
- ifm electronic GmbH
- Siemens AG
- Omron Corporation
- Hansford Sensors Ltd

Market Opportunities and Future Outlook
Edge analytics embedded at the sensor level is creating room for higher-value vibration nodes in factories, energy assets, and mobile machinery, where bandwidth, latency, and battery life limit traditional architectures. In June 2026, STMicroelectronics commercially launched the IIS3DWB10IS digital vibration sensor with 10 kHz bandwidth and an integrated ISPU (Intelligent Sensor Processing Unit) to run on-device inference. This supports condition-monitoring deployments that previously relied on external processing or higher-cost piezo-based systems. April 2026 announcements from Upbeat Technology (UPM01 and UPM02 series with integrated Vibration Processing Units) also point to in-sensor processing as an identifiable product category, reinforcing opportunities for suppliers that can provide validated models, secure firmware update pathways, and straightforward integration into predictive-maintenance stacks.
A separate opportunity is in applications that require micro-g and low-frequency vibration characterization, where standard industrial monitoring configurations can miss signals tied to process quality. Semiconductor fabrication is one such environment, with increased focus on subtle vibration anomalies that correlate with yield loss. This supports demand for specialized seismic and low-frequency accelerometers alongside conventional machine-health sensors. Materials and form factors also create whitespace, as research activity around flexible triboelectric vibration sensors for non-planar surfaces suggests new installation modes for hard-to-instrument assets, complementing the broader shift toward miniaturized MEMS designs used in wearables and distributed industrial sensor grids.
Recent Industry Developments in Vibration Sensor Market
- June 2026: STMicroelectronics launched the IIS3DWB10IS digital vibration sensor with 10 kHz bandwidth and an integrated ISPU for in-sensor AI inference. The device targets industrial condition monitoring as an alternative to piezo-based sensing in applications that benefit from local processing. This expands the competitive baseline for edge analytics by packaging compute and sensing together at the node.
- May 2025: Vestas secured a 495 MW offshore wind order in Taiwan featuring 33 V236-15 MW turbines. Larger-class offshore turbines use dense condition-monitoring architectures, lifting requirements for high-reliability vibration sensing across drivetrain and rotating equipment. The order signals continued demand pull from wind assets that prioritize uptime and remote diagnostics.
- October 2024: Honeywell partnered with Qualcomm to integrate low-power AI processors and connectivity capabilities with industrial sensors for energy-sector monitoring. The collaboration supports higher sample-rate data handling and more capable gateways for field deployments where power and communications are constrained. It also reinforces platform approaches that combine sensors, edge compute, and secure wireless links for predictive maintenance.


Vibration Sensor Market Report Scope and Research Methodology
Market Definition and Coverage
For this study, the vibration sensors market covers revenue from sensors that measure vibration and related motion signals for monitoring, diagnostics, and control across industrial and non-industrial uses. Revenue is counted for sensors sold to global end-user demand during the study period.
Scope exclusions: We exclude downstream services such as installation, calibration contracts, and condition monitoring software subscriptions when they are billed separately from the sensor hardware.
Segments Covered in This Report
- By Product Type
- Accelerometers
- Velocity Sensors
- Displacement Sensors
- Gyroscopes (Vibration-Grade)
- By Technology
- Piezoelectric
- Piezoresistive
- Capacitive
- Strain-Gauge
- MEMS
- By Material
- Quartz
- Piezoelectric Ceramics
- Doped Silicon
- Others
- By End-Use Industry
- Automotive
- Aerospace and Defense
- Oil and Gas
- Industrial Manufacturing
- Power Generation (incl. Wind)
- Healthcare
- Consumer Electronics and Wearables
- Others
- By Geography
- North America
- United States
- Canada
- Europe
- Germany
- United Kingdom
- France
- Italy
- Spain
- Rest of Europe
- Asia-Pacific
- China
- Taiwan
- Japan
- South Korea
- India
- ASEAN
- Rest of Asia-Pacific
- South America
- Mexico
- Brazil
- Argentina
- Rest of South America
- Middle East and Africa
- Middle East
- Saudi Arabia
- United Arab Emirates
- Turkey
- Rest of Middle East
- Africa
- South Africa
- Rest of Africa
- Middle East
- North America
Data Sources, Market Sizing, and Validation
Desk Research
Desk research was used to set the market boundary, build the regional demand picture, and anchor the model to observable activity in industries that buy vibration sensing. We referenced public and official sources such as industrial production and manufacturing output series, energy and power generation statistics, vehicle production indicators, and trade data for electronics and sensing components (where classification allowed directionally useful reads).
To keep assumptions realistic, we also reviewed information from sources such as company annual reports, investor presentations, product specification sheets, association publications, and reputable press coverage of automation and predictive maintenance spending. Where available, we used subscriptions focused on company financials and news screening, plus patent databases to sanity-check technology shifts like MEMS adoption and wireless sensing features. These desk research sources are illustrative only, and additional public references were used for collection, validation, and clarification.
Primary Interviews and Surveys
Primary work focused on confirming adoption rates, price bands, and buying patterns across major end-user industries such as manufacturing, energy, automotive, aerospace, and electronics. Respondent input was collected across APAC, EMEA, and the Americas. We used these interviews to validate desk assumptions, resolve gaps like channel markups versus direct sales, and assess how quickly newer form factors are replacing older sensor types in real deployments.
Distribution of primary research fieldwork respondents
| Company type | Respondent position | Region |
|---|---|---|
| Top tier: 31% | CXOs: 15% | APAC: 47% |
| Mid tier: 54% | Functional/Unit leaders: 40% | EMEA: 30% |
| Smaller Players: 15% | Managers: 45% | Americas: 23% |
Market-Sizing & Forecasting
Market sizing was built using a top-down approach, where end-user activity and equipment base indicators were converted into an addressable demand pool, and then translated into value using typical sensor content and replacement patterns. For vibration sensors, key inputs included industrial motor and rotating equipment exposure, predictive maintenance penetration in plants, installed base additions in power generation (including wind assets), automotive production trends linked to safety and chassis sensing needs, and the split between wired and wireless deployments, which affects average selling prices.
After that, results were corroborated with selective bottom-up checks, such as sampling average selling prices by sensor type, applying channel markups where relevant, and rolling up a limited set of supplier and distributor revenue disclosures to verify the order of magnitude. When bottom-up data was missing for smaller countries or niche end uses, we used proxy drivers like industrial output and capex intensity, then normalized outcomes using interview feedback.
For forecasting, scenario analysis was applied around a central path, since adoption is sensitive to plant automation cycles and maintenance budgets. The forward view was then tightened using expert views on ASP progression (especially for MEMS and wireless units), expected replacement cycles, and regional mix shifts that can change blended price even when unit volumes rise.
Data Validation & Update Cycle
Outputs were checked through triangulation across independent signals, then reviewed for variance by region, end-use, and product type before sign-off. Where a number moved outside expected ranges, we reopened assumptions and placed follow-up calls to confirm whether the shift came from pricing, mix, or changes in the demand pool.
Reports are refreshed annually, and material events like sharp currency moves, supply disruptions, or step-changes in industrial investment are assessed for interim adjustments. Before delivery, a final analyst pass is completed so the model reflects the most recent public data releases and validated field feedback.
Mordor Intelligence's Global Vibration Sensors Market Market Size Compared With Other Published Estimates
Published market values for vibration sensors often differ because update timing is not aligned, and because pricing logic is handled differently across product types and regions. Even when the same end uses are referenced, totals can move depending on whether an estimate follows shipment timing, recognized revenue timing, or a blended approach.
A common gap driver in this market is how average selling prices are refreshed when regional mix shifts, and when newer MEMS and wireless units expand share, since that can pull blended ASP down even as demand grows. Currency conversion timing checks and the re-validation of ASP bands during the latest page refresh are also meaningful drivers. As a result, Mordor Intelligence reports USD 6.5 B (2026) when some other figures anchor to earlier base years or use longer-dated price decks.
Benchmark comparison
| Source | Market Size | Gaps in Research Methodology |
|---|---|---|
| Mordor Intelligence | USD 6.5 B (2026) | |
| Global Consultancy A | USD 6.57 B (2024) | Uses a 2024 base and a longer forecast window, and the sizing appears more sensitive to faster adoption assumptions in automation and predictive maintenance, with fewer visible checks on recent ASP compression from mix shifts. |
| Industry Publisher B | USD 5.48 B (2023) | Anchors the market on a 2023 base year and may apply earlier pricing bands and region shares, which can understate later-period value when industrial spending and wireless sensor deployments accelerate. |
The spread across the three numbers is largely explained by base-year selection and how quickly pricing and currency assumptions are refreshed, rather than a disagreement that the market is growing. By keeping the inputs tied to observable demand indicators and by re-checking price bands with current field feedback, the estimate remains traceable to repeatable steps and practical market signals.


Key Questions Answered in the Report
What is the current size of the vibration sensor market?
The vibration sensor market stood at USD 6.5 billion in 2026 and is forecast to grow to USD 8.92 billion by 2031 at a 6.55% CAGR.
Which product type dominates the vibration sensor market?
Accelerometers led with 53.85% vibration sensor market share in 2025, reflecting their broad applicability across industrial and consumer devices.
Why are MEMS technologies growing faster than piezoelectric sensors?
MEMS devices benefit from semiconductor economies of scale, on-chip integration, and suitability for wireless, edge-AI applications, giving them a 9.85% CAGR through 2031.
Which region represents the largest opportunity for suppliers?
Asia-Pacific contributed 33.90% revenue in 2025 and is projected to grow at 8.05% CAGR, driven by manufacturing automation and wind turbine installations.
What are the main restraints facing adoption?
High-temperature calibration drift in piezoelectric sensors and cybersecurity concerns over cloud analytics limit uptake in aerospace and defense settings.
How are leading companies differentiating their offerings?
Market leaders integrate AI analytics, secure wireless protocols, and energy-harvesting options to shift from hardware sales toward subscription-based condition-monitoring services.
Page last updated on:





