
Market Overview
| Study Period | 2020 - 2031 |
|---|---|
| Forecast Data Period | 2026 - 2031 |
| Historical Data Period | 2020 - 2024 |
| Growth Rate | 8.89 % |
| Market Concentration | Low |
Major Players *Disclaimer: Major Players sorted in no particular order Image © Mordor Intelligence. Reuse requires attribution under CC BY 4.0. | |
South-East Asia (SEA) Syngas Market Analysis by Mordor Intelligence
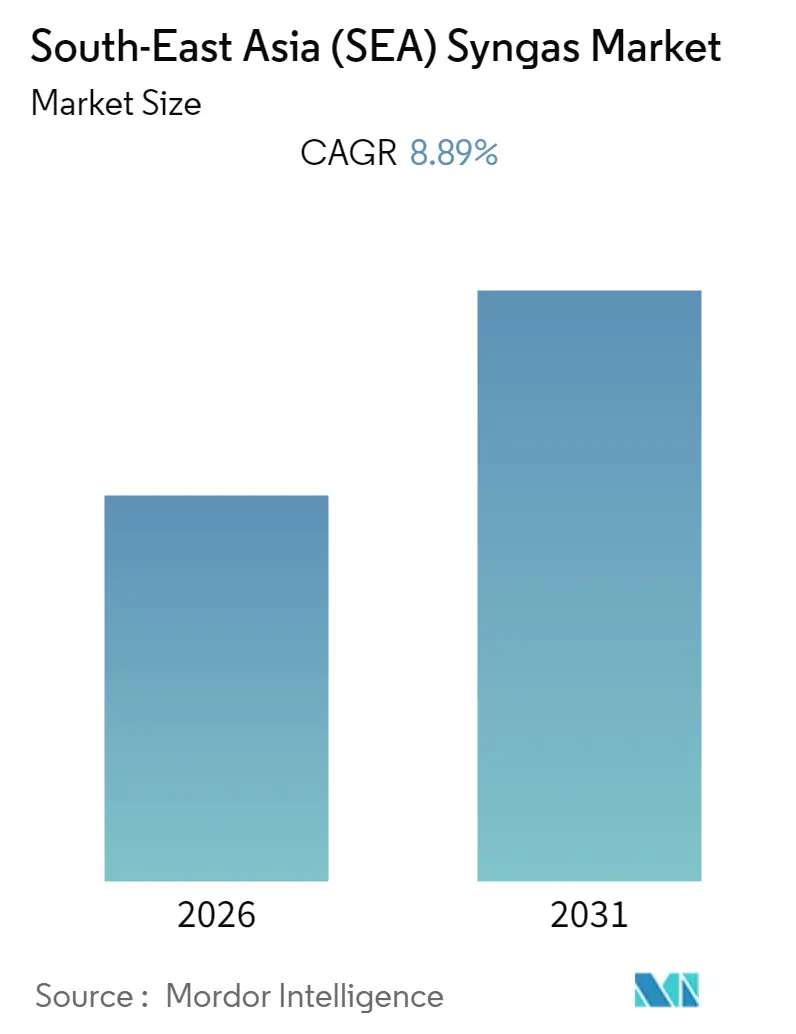
The South-East Asia (SEA) Syngas Market size is expected to register a CAGR of 8.89% during the forecast period (2026-2031).
- High capital investment and funding is likely to hinder the South-East Asia (SEA) Syngas Market's growth.
- Development of underground coal gasification technology is likely to create opportunities to the South-East Asia (SEA) syngas market growth in the future.
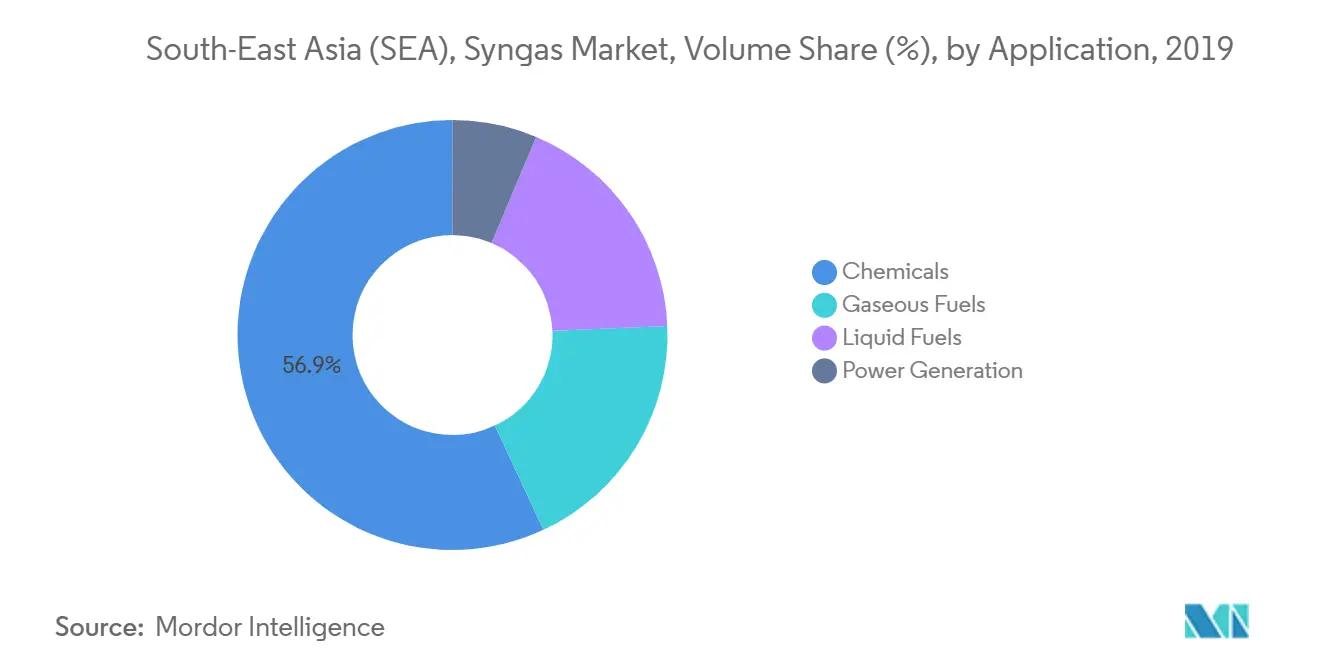
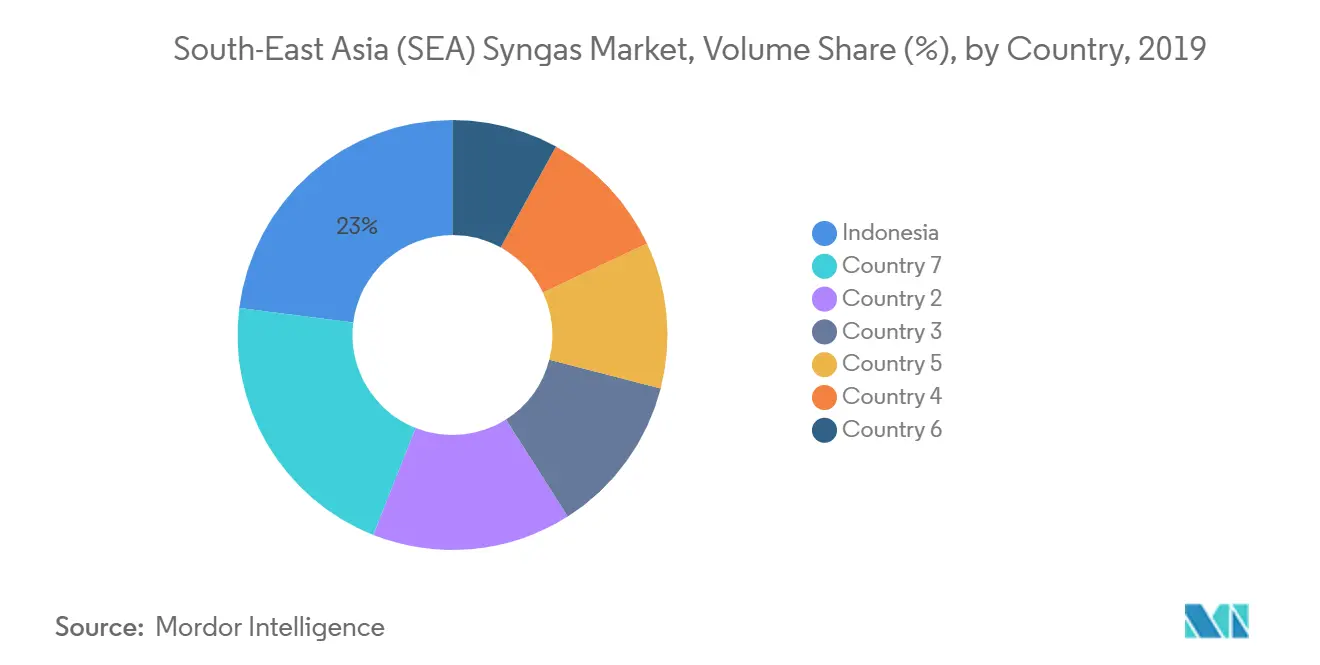
- Indonesia is expected to dominate the market and is also expected to witness the fastest CAGR during the forecast period.
Note: Market size and forecast figures in this report are generated using Mordor Intelligence’s proprietary estimation framework, updated with the latest available data and insights as of 2026.
Market Trends and Insights
Increasing Usage in Power Generation Industry
- The power industry is the backbone of the industrial sector that supplies essential energy to industrial, commercial, manufacturing, and residential customers.
- Synthesis gas plays a huge role in power generation, as it is used as an intermediate in creating synthetic natural gas (SNG), which has various application, such as:
- IGCC plants use gasifiers that convert coal or any other carbon-based materials to syngas, which is used in driving a combined cycle turbine to generate electricity. IGCC plants can achieve efficiencies of 45% and have low emissions, since the fuel is cleaned before it is fired in the gas cycle turbine.
- Biogas, which is a form of renewable energy, can be obtained through thermochemical gasification of synthetic gas.
- Gasification and pyrolysis processes produce a combustible synthetic gas that can either be used to produce electricity, or further refined and upgraded for direct generation in a gas turbine or engine.
- The aforementioned factors have been driving the demand for South-East Asia (SEA) Syngas Market in the recent times.
Indonesia to Dominate the Market
- The Indonesian power generation sector has witnessed a significant growth during the past five years.
- Growing population in the country, rising per capita income, and structurally lower electrification ratio, together, indicate rapid growth for the electricity demand during the forecast period.
- With the current slowdown in the mining sector, some rebalancing of economic growth toward manufacturing is likely to take place over the forecast period.
- The chemical manufacturing sector in the country is growing, due to the increasing demand for chemicals in various applications.
- Overall, the growing end-user industries in the country are projected to drive the South-East Asia (SEA) syngas market during the forecast period.
Value Chain Analysis
The SEA syngas value chain starts with feedstock supply (coal, natural gas, pet-coke, biomass/municipal waste) and supporting utilities (oxygen/nitrogen, steam, power and water). Feedstock is typically sourced domestically for coal and biomass in Indonesia and Malaysia, while gas- and LNG-linked infrastructure supports reforming and integrated industrial gas systems in hubs such as Singapore and Thailand. Upstream inputs include gasifiers/reformers, ASUs, high-temperature reactor vessels, catalysts, and refractory linings, with delays often linked to imported high-chrome steel alloys, specialized ceramic refractories, and proprietary catalyst formulations for critical-path items.
Midstream conversion covers gasification and reforming (steam reforming, partial oxidation, autothermal and two-step reforming, and biomass gasification), followed by syngas cooling, cleaning, and conditioning. Distribution is usually handled through long-term on-site and pipeline/tonnage models serving refineries, petrochemicals, fertilizers, and large industrial parks rather than a broad merchant market, which reinforces direct contracting and procurement patterns. Recent project activity reflects this structure: PT PLN Energi Primer Indonesia signed an MoU with PT Karimun Power Plant in April 2026 to develop a biomass-based syngas pilot supporting diesel-to-gas conversion, while Air Liquide signed a long-term agreement in June 2025 to supply industrial gases via a new facility in Singapore scheduled to commence operations in 2026. Downstream demand ties syngas to chemicals (including methanol and ammonia value chains) and industrial fuel substitution, with several developments anchored in state enterprise-led offtake and industrial-zone buildouts.
Competitive Landscape
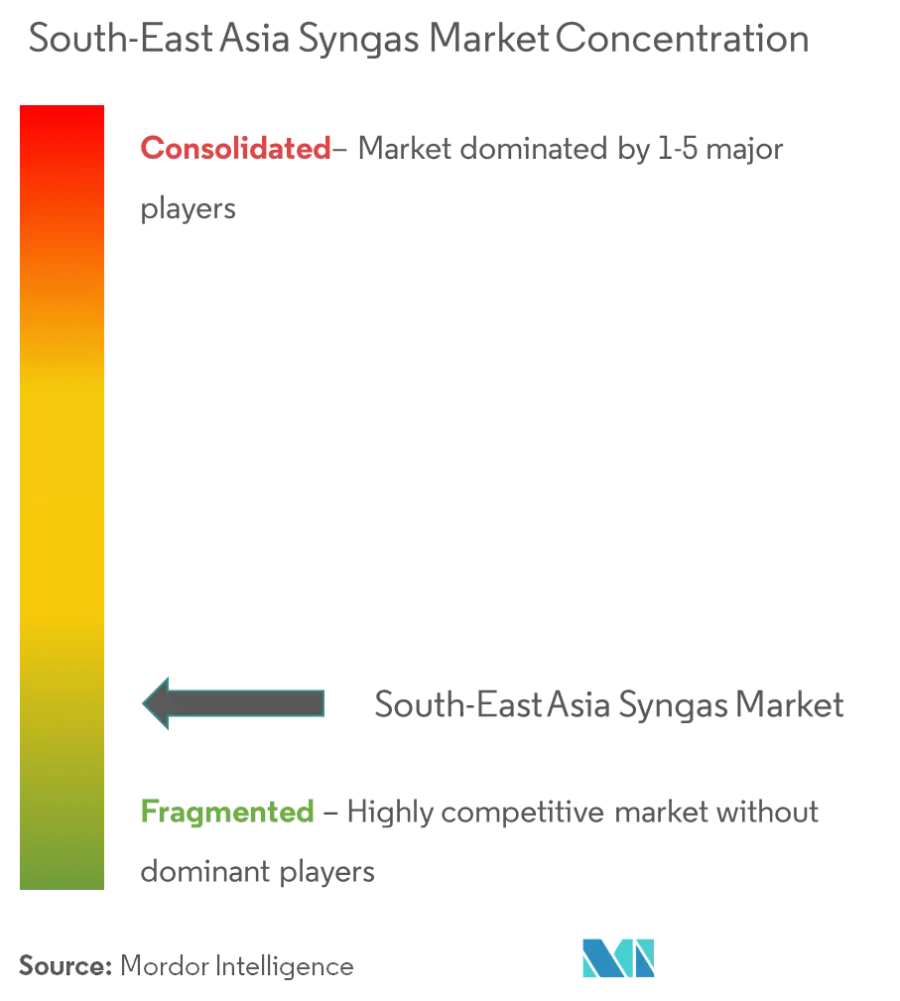
The South-East Asia (SEA) syngas market is fragmented in nature. Key players in the market include Air Products and Chemicals, Inc., Linde plc, Air Liquide, and Haldor Topsoe A/S, among others.
South-East Asia (SEA) Syngas Industry Leaders
-
Air Products and Chemicals, Inc.
-
Linde plc
-
Air Liquide
-
Haldor Topsoe A/S
- *Disclaimer: Major Players sorted in no particular order
South-East Asia (SEA) Syngas Market Companies Covered in this Report
- Air Liquide
- Air Products and Chemicals, Inc.
- BASF SE
- BP p.l.c.
- DuPont
- General Electric
- Haldor Topsoe A/S
- KBR, Inc.
- Linde plc
- METHANEX CORPORATION
- MITSUBISHI HEAVY INDUSTRIES, LTD.
- Royal Dutch Shell plc
- Siemens
- SynGas Technology LLC
- TechnipFMC plc
Market Opportunities and Future Outlook
Opportunities are building around biomass and waste-derived syngas pathways, and around integration of syngas systems with LNG and existing petrochemical infrastructure. In Indonesia, PT PLN Energi Primer Indonesia and PT Karimun Power Plant signed an MoU on April 6, 2026 to develop biomass-based syngas for diesel-to-gas conversion, beginning with a 1-5 MW pilot project in Karimun and supporting a replicable approach for remote or islanded power and industrial loads that face liquid-fuel logistics costs. In Thailand, PTT Public Company Limited and BIG announced the MAP2 air separation unit project at Map Ta Phut Industrial Estate, explicitly leveraging cold energy from LNG regasification, pointing to a way to reduce the energy penalty of oxygen supply that is central to multiple syngas production configurations.
A second area of opportunity is coal and CO2-linked syngas initiatives that target domestic industrial feedstocks while tightening integration with downstream chemicals and ports. Latitude Energy signed an MoU in July 2026 to explore coal gasification using TRIG technology for low-rank coal upgrading, and HYCO1 and Malaysia LNG (MLNG) signed a memorandum in April 2025 to pursue a CO2-to-syngas CCU plant in Bintulu, Sarawak. Meanwhile, coal-to-chemicals concepts continue to face feasibility and partnership constraints, which keeps the premium on bankable offtake structures, proven licensors, and phased execution, such as aligning syngas production to fertilizer, methanol, or refinery hydrogen demand centers rather than standalone commodity exposure.
Recent Industry Developments in South-East Asia (SEA) Syngas Market
- July 2026: Latitude Energy signed an MoU in Indonesia to explore coal gasification using Transport Integrated Gasification (TRIG) technology aimed at converting low-rank coal into industrial feedstocks. The agreement adds momentum to domestic coal-downstreaming concepts that depend on validated technology pathways and integrated offtake to move beyond early feasibility work.
- November 2025: Messer SE & Co. KGaA and Petrovietnam Chemical and Services Corporation (PVChem) signed a joint venture agreement to form Cái Mép Industrial Gases Co. Ltd. to develop an industrial gas production facility in Vietnam. The partnership supports localized supply for industrial clusters and highlights how JV structures help finance and operate on-site and tonnage gas assets in the region.
- July 2024: Linde plc reported mechanical completion of the Linde New Gasification Project (SLUP) on Jurong Island, Singapore. The milestone reinforces Singapore's position as a regional hub for integrated gas and petrochemical operations and expands installed gasification-linked infrastructure that can connect to downstream syngas and industrial gas demand.
South-East Asia (SEA) Syngas Market Report Scope and Research Methodology
Market Definition and Coverage
For this report, the market is defined as the value generated from synthesis gas (a CO and H2 rich gas) produced in South-East Asia and supplied for energy and industrial use, either for on-site consumption or for downstream conversion.
Scope exclusions: Pure hydrogen markets and standalone carbon capture services are excluded when they are not directly tied to syngas generation and use.
Segments Covered in This Report
- Feedstock
- Coal
- Natural Gas
- Petroleum
- Pet-coke
- Biomass
- Technology
- Steam Reforming
- Partial Oxidation
- Auto-thermal Reforming
- Combined or Two-step Reforming
- Biomass Gasification
- Gasifier Type
- Fixed Bed
- Entrained Flow
- Fluidized Bed
- Application
- Power Generation
- Chemicals
- Methanol
- Ammonia
- Oxo Chemicals
- n-Butanol
- Hydrogen
- Dimethyl Ether
- Liquid Fuels
- Gaseous Fuels
- Geography
- Indonesia
- Thailand
- Malaysia
- Singapore
- Philippines
- Vietnam
- Rest of South-East Asia (SEA)
Data Sources, Market Sizing, and Validation
Desk Research
Desk research was used to set the fact base around feedstocks, industrial activity, and country level project movement that shapes syngas demand. We relied on public sources such as energy balance and policy releases, customs and trade statistics, and publications from regional and global energy agencies, followed by chemical and refinery association updates and peer reviewed process studies.
To anchor the model in real operating context, we also reviewed company annual reports, investor decks, and plant level announcements that signal new gasification or reforming capacity additions. In parallel, we used paid subscriptions for company financials and intelligence, patent lookups, and shipment-level trade screens to cross-check timelines and equipment flows where public disclosures were thin. These examples are illustrative only, and many other sources were also consulted for data collection, validation, and research clarification.
Primary Interviews and Surveys
Primary work focused on interviews and structured surveys with operators, engineering and project teams, feedstock and gas handling specialists, and downstream chemical buyers across Indonesia, Thailand, Malaysia, Singapore, Vietnam, the Philippines, and the rest of the region. Inputs were used to validate utilization patterns, typical plant run rates, product routing into chemicals versus power, and the pace at which announced projects convert into real output.
Distribution of primary research fieldwork respondents
| Company type | Respondent position |
|---|---|
| Top tier: 36% | CXOs: 14% |
| Mid tier: 48% | Functional/Unit leaders: 27% |
| Smaller Players: 16% | Managers: 59% |
Market-Sizing & Forecasting
Sizing was built using both top-down and bottom-up logic, where country level industrial output and energy demand indicators were first used to reconstruct the likely syngas consumption pool, and then checked against supply-side reality. In practice, the model tracks syngas-linked capacity additions, utilization ranges by technology, and the share routed into chemicals, liquid fuels, gaseous fuels, and power generation.
A small set of market fingerprints was kept consistent across countries so the numbers stay comparable, such as gasification versus reforming technology mix, feedstock availability signals (coal, natural gas, pet-coke, and biomass), typical conversion yields into methanol and ammonia chains, and the timing of large project start-ups. Where plant disclosure was incomplete, gaps were handled by using peer plant benchmarks and then stress testing the assumed run rates through expert feedback.
Forecasting was run using scenario analysis supported by a simple multivariate regression, where key drivers like downstream chemical capacity movement, new syngas project commissioning schedules, and policy push for coal gasification were varied within realistic bands. The resulting totals were corroborated with selective bottom-up approximations, including sampled capacity times utilization and indicative pricing ranges, which were then used to adjust any country totals that looked out of line.
Data Validation & Update Cycle
Validation is done through triangulation across multiple independent signals, and then reviewed through analyst checks before numbers are finalized. Outliers are flagged when a country total implies unrealistic utilization, feedstock use, or downstream offtake, and follow-up calls are triggered to re-check assumptions where the variance is meaningful.
Before sign-off, the model outputs are compared with trade movements, major project start-up tracking, and demand-side markers from chemicals and power. Reports are refreshed annually, and interim updates are made when material events occur such as large project delays, policy shifts, or sharp feedstock price swings. Right before delivery, a fresh pass is completed so clients receive the most current view that can be traced back to clear inputs.
Mordor Intelligence's South East Asia Synthesis Gas Syn Gas Market Size Measured Against Other Published Estimates
Published market sizes for South-East Asia syngas can look far apart, even when the topic name is similar, because the counted output and conversion chains are not always aligned. Differences usually come from what is treated as syngas value, the year of pricing used, and how announced plants are converted into actual volume and then into revenue.
Syngas derivatives such as methanol and ammonia are kept outside Mordor Intelligence's scope for this market, which reduces the headline value versus estimates that fold downstream chemical revenue into the same number. Other gaps typically come from using aggressive utilization assumptions for new gasification units, mixing volume-based and value-based totals without clear conversion, and applying currency conversion at different timing points during volatile feedstock cycles.
Benchmark comparison
| Source | Market Size | Gaps in Research Methodology |
|---|---|---|
| Mordor Intelligence | USD 0.00 B (2024) | |
| Regional Consultancy A | USD 17.00 B (2024) | Often bundles downstream derivatives and end products into the same value line, and can also assume faster ramp-ups for announced projects than what operating teams report. |
| Industry Publisher B | USD 17.45 B (2024) | Uses a broader APAC demand pool and then allocates shares to South-East Asia, which can overstate local value when country-level utilization and routing to applications are not validated. |
The spread is largely explained by what gets counted as syngas versus what is treated as downstream chemical value, followed by differences in ramp-up and regional allocation logic. By tying the model to plant commissioning, realistic run rates, and application routing checks, the estimate stays easier to reproduce and to debate with clear levers.
Key Questions Answered in the Report
What is the current South-East Asia (SEA) Syngas Market size?
The South-East Asia (SEA) Syngas Market is projected to register a CAGR of 8.89% during the forecast period (2026-2031)
Who are the key players in South-East Asia (SEA) Syngas Market?
Air Products and Chemicals, Inc., Linde plc, Air Liquide and Haldor Topsoe A/S are the major companies operating in the South-East Asia (SEA) Syngas Market.
What years does this South-East Asia (SEA) Syngas Market cover?
The report covers the South-East Asia (SEA) Syngas Market historical market size for years: 2019, 2020, 2021, 2022, 2023, 2024 and 2025. The report also forecasts the South-East Asia (SEA) Syngas Market size for years: 2026, 2027, 2028, 2029, 2030 and 2031.