South East Asia Battery Swapping Market Size and Share
Market Overview
| Study Period | 2020 - 2031 |
|---|---|
| Forecast Data Period | 2026 - 2031 |
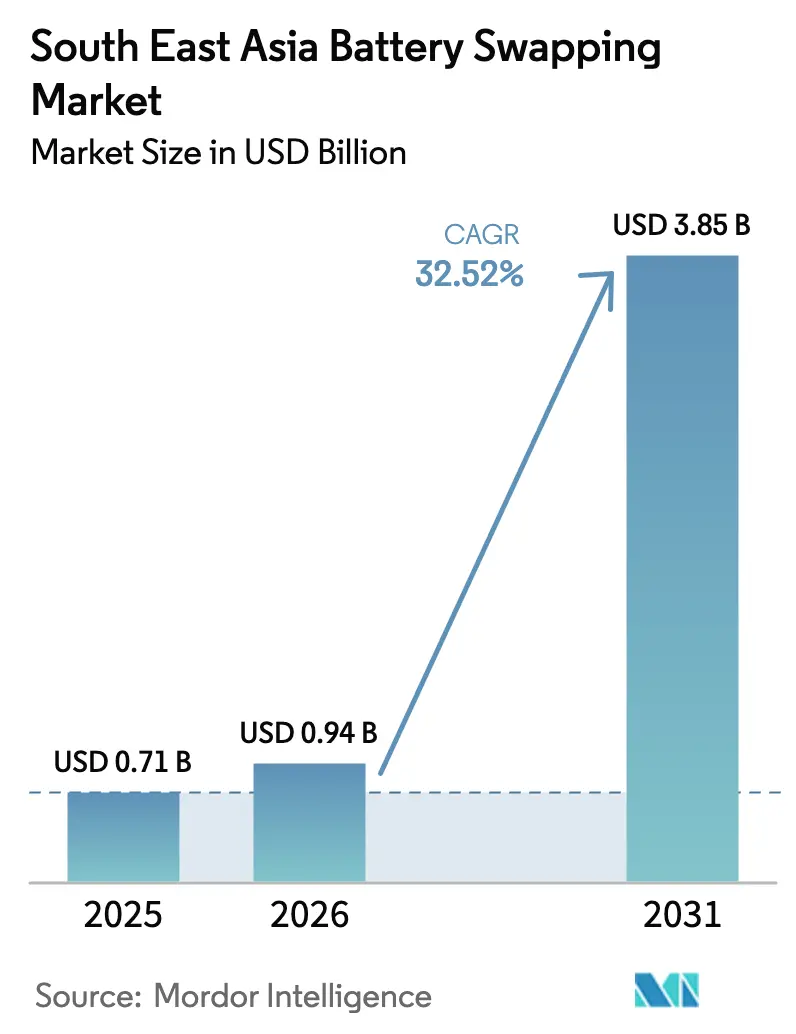
| Base Year Market Size (2025) | USD 0.71 Billion |
| Market Size (2026) | USD 0.94 Billion |
| Market Size (2031) | USD 3.85 Billion |
| Growth Rate (2026 - 2031) | 32.52% CAGR |
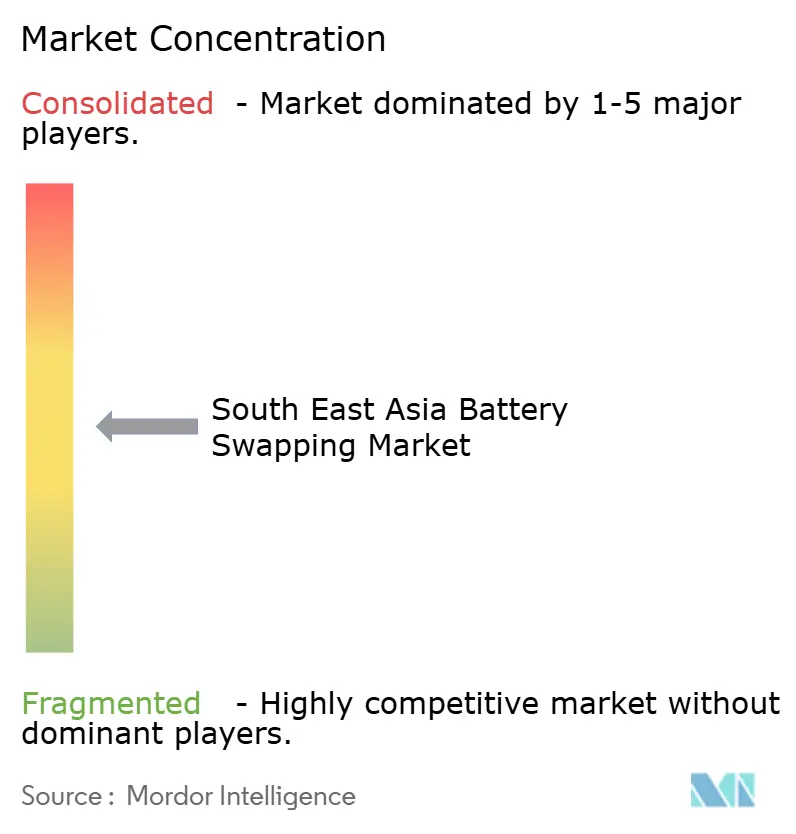
| Market Concentration | Medium |
Major Players *Disclaimer: Major Players sorted in no particular order Image © Mordor Intelligence. Reuse requires attribution under CC BY 4.0. | |
South East Asia Battery Swapping Market Analysis by Mordor Intelligence
The South East Asia Battery Swapping Market size is expected to grow from USD 0.71 billion in 2025 to USD 0.94 billion in 2026 and is forecast to reach USD 3.85 billion by 2031 at 32.52% CAGR over 2026-2031. Momentum rests on three pillars, millions of urban two-wheelers that need rapid refuelling, explicit government mandates to cut transport emissions, and proven sub-5-minute exchange technology that aligns with commercial fleet uptime targets. Operators gain additional tailwinds from ride-hailing and last-mile delivery platforms that guarantee high-frequency usage, while early attempts at cross-OEM battery standardization point to future interoperability gains.
Key Report Takeaways
- By vehicle type, two-wheelers led with 70.62% of the South East Asia battery swapping market share in 2025, while they are expected to accelerate at a 34.89% CAGR to 2031.
- By service type, subscription models commanded 54.81% share of the South East Asia battery swapping market size in 2025; hybrid pricing structures hold the highest projected CAGR at 32.88% to 2031.
- By station type, automated swap hubs captured 51.42% revenue share in 2025, whereas mobile units are advancing at a 34.02% CAGR through 2031.
- By battery chemistry, lithium-ion accounted for 85.76% share in 2025; solid-state alternatives are poised for a 32.56% CAGR to 2031.
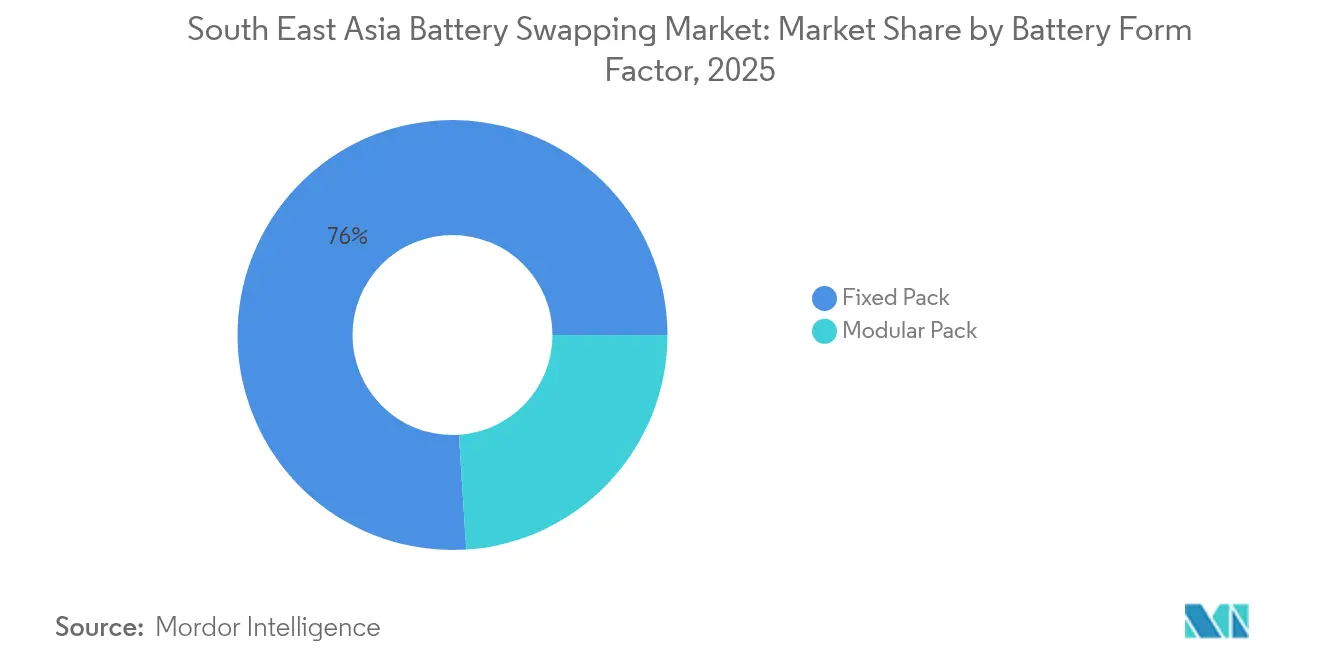
- By form factor, fixed packs held 76.02% share in 2025; modular designs show a 34.67% CAGR outlook.
- By ownership, OEM-controlled networks retained a 44.21% share in 2025, yet independent operators posted the quickest growth at 34.51% CAGR.
- By application, last-mile delivery represented a 37.63% share in 2025, while fleet logistics is projected to climb at a 32.74% CAGR.
- By country, Indonesia dominated with a 37.12% share in 2025; the Philippines is forecast to expand at a 32.69% CAGR through 2031.
Note: Market size and forecast figures in this report are generated using Mordor Intelligence’s proprietary estimation framework, updated with the latest available data and insights as of 2026.
South East Asia Battery Swapping Market Trends and Insights
Drivers Impact Analysis*
| Driver | (~) % Impact on CAGR Forecast | Geographic Relevance | Impact Timeline |
|---|---|---|---|
| Surge in Electric-Two-Wheeler | +7.9% | Indonesia, Thailand, Vietnam core markets | Medium term (2-4 years) |
| Government Purchase and Tax Incentives | +6.8% | Regional, with strongest impact in Thailand and Indonesia | Short term (≤ 2 years) |
| Rapid Growth of Ride-Hailing/Delivery Fleets | +6.1% | Urban centers across ASEAN-6 markets | Short term (≤ 2 years) |
| Renewable Micro-Grid Arbitrage Opportunities | +4.1% | Rural and semi-urban areas, particularly Philippines and Indonesia | Long term (≥ 4 years) |
| FinTech-Enabled Battery-as-a-Service Models | +3.7% | Urban markets with strong digital payment adoption | Medium term (2-4 years) |
| Cross-OEM Battery-Pack Standardisation | +3.2% | Regional, led by Japanese manufacturers | Medium term (2-4 years) |
| Source: Mordor Intelligence | |||
Surge in electric two-wheeler penetration
Commercial operators anchor uptake as Thailand targets 650,000 electric bikes and 1,450 swap sites by 2030, promising drivers 30% fuel-cost savings and removing multi-hour charging pauses. In Vietnam, Selex Motors links with Grab and Lazada to roll out “battery ATMs” that deliver a 150 km range after a 2-minute exchange. Indonesia’s ride-hailing fleets deepen momentum; Gojek’s pilot of 250 Gogoro Smartscooters shows how network effects lift station utilisation above break-even levels once daily swap volumes exceed 80. This B2B focus prioritises total cost of ownership, accelerating the South East Asia battery swapping market in dense urban corridors.[1]“Gogoro and Gojek Launch Battery Swapping Pilot in Jakarta,” Gogoro Inc., gogoro.com
Government purchase & tax incentives for EVs
Thailand’s EV 3.5 scheme grants up to THB 100,000 (USD 2,800) per two-wheeler and insists on local assembly by 2027, an alignment favoring swap models with lower on-board battery stock. Indonesia extends tax holidays for auto makers, nudging supply upward and leasing costs downward. Malaysia’s 20% electrified-vehicle aim by 2030 embeds swap-station siting into city zoning, underscoring a policy view that treats stations as public infrastructure rather than retail assets.
Rapid growth of ride-hailing / delivery fleets
E-commerce surges deliver steady swap demand, Gojek riders cut energy outlay 35% and halve maintenance versus petrol bikes when using Selex kiosks. VinFast backs a USD 1 billion electric-taxi rollout in Manila, illustrating how centralized fleet control speeds infrastructure scale-up. Indonesia’s 13 million electric-motorcycle ambition by 2030 implies that commercial app fleets, not private riders, will dictate early station placement patterns.
Renewable micro-grid arbitrage opportunities
PV-linked swap hubs store midday solar and feed grids after dark, lifting 20-30% site economics. Thailand’s 30% renewable-energy target and the Philippines’ island grids incentivise operators to earn ancillary-service revenue through vehicle-to-grid dispatch. Taiwan’s experience, where swap networks supplied power during typhoon shutdowns, highlights resilience benefits valued by utilities.
Restraints Impact Analysis*
| Restraint | (~) % Impact on CAGR Forecast | Geographic Relevance | Impact Timeline |
|---|---|---|---|
| High Capex for Swapping-Station Roll-Out | -5.8% | Regional, particularly affecting rural deployment | Short term (≤ 2 years) |
| Lack of Uniform Safety | -4.2% | Regional, with varying national regulations | Medium term (2-4 years) |
| Fire-Safety Concerns | -2.1% | Urban centers with high population density | Long term (≥ 4 years) |
| Rural Grid Instability Causing Downtime | -1.9% | Rural and semi-urban areas across the region | Medium term (2-4 years) |
| Source: Mordor Intelligence | |||
High capex for the swapping-station roll-out
Automated sites cost USD 150,000–300,000 each, restricting coverage outside core metros. Indonesia’s 2,182 public swap points are still underserved by its 1.8 million motorbike electrification target by 2025. Mobile vans cut upfront spend up to 60%, prompting infrastructure-as-a-service models where energy firms own assets while mobility operators lease capacity.[2]“Pertamina to Host Gogoro Swap Stations,” Pertamina, pertamina.com
Lack of uniform safety & interface standards
Differing national rules force operators to stock separate battery SKUs, eroding scale economies. Singapore’s updated TR25 guideline marks progress, yet ASEAN-wide adoption remains voluntary. The Japanese motorcycle consortium shows industry-led paths to multi-brand packs, but four-wheeler norms lag, raising compliance costs and lengthening certification queues.[3]“Technical Reference TR25:2024 – EV Charging and Battery Swapping,” Enterprise Singapore, enterprisesg.gov.sg
*Our forecasts treat driver/restraint impacts as directional, not additive. The impact forecasts reflect baseline growth, mix effects, and variable interactions.
Segment Analysis
By Vehicle Type: Two Wheelers Lead Uptake
Two-wheelers delivered 70.62% of 2025 revenue as the South East Asia battery swapping market mirrored the region’s motorcycle culture. Swap usage boosts driver income because each scooter can perform 8–12 daily exchanges, doubling revenue relative to charging. They are projected to climb at a 34.89% CAGR, fuelled by ride-hailing electrification mandates such as Hanoi’s plan to convert buses fully by 2030. Three-wheel cargo bikes and light vans gain share through last-mile logistics efficiencies, while heavy trucks remain at the pilot stage.
Fleet economics underpin growth, Indonesia’s 112 million-strong bike park shows penetration below 1%, signalling early innings despite size. Battery-as-a-service packages strip out battery purchase costs and create subscription income that steadies operator cash flows. Private consumer adoption is expected to follow commercial footprints as infrastructure densifies, reinforcing station utilisation.


By Service Type: Subscription Pricing Sets Pace
Subscription bundles held a 54.81% share in 2025 because predictable monthly outlays fit fleet budget cycles. Bulk plans trim per-swap costs by up to 30% and grant operators flexibility to reassign batteries across vehicles. Hybrid schemes blending base fees with pay-per-use are expanding fastest at 32.88% CAGR, appealing where demand swings by season. Pay-per-use keeps a niche among occasional riders but yields thinner margins.
Digitally integrated payment rails lower friction. Projects in Bangkok pair QR-code kiosks with micro-loans, widening access for motorcycle taxi drivers. Subscription operators mine usage data to forecast demand and optimise battery health, a data asset that strengthens cross-selling of maintenance and insurance.
By Station Type: Automation for Hubs, Mobility for Spokes
Automated cabinets secured 51.42% of 2025 revenue as the South East Asia battery swapping market sought five-minute turnaround and round-the-clock service. Land-efficient pods suit dense capitals where real estate pressure is acute. Mobile swap trucks, the fastest-growing format at 34.02% CAGR, extend their reach into peri-urban and rural zones with swing-arm cranes that unload packs curbside.
Operators increasingly deploy hub-and-spoke models: urban automated depots cover heavy-traffic corridors, while mobile units roam low-volume districts. Solid-state safety gains could later shrink cooling needs, lowering cabinet prices and easing rural roll-outs.
By Battery Chemistry: Lithium-ion Still Rules
Lithium-ion delivered 85.76% of 2025 demand thanks to established Asian supply chains and a 150–200 km range per swap. Therefore, the Southeast Asia battery swapping market relies on global commodity flows for nickel, manganese, and cobalt. Solid-state is tracking a 32.56% CAGR on promises of 40% higher energy density and near-zero fire risk, yet commercial release remains post-2026. Lead-acid persists in budget fleets, while sodium-ion attracts interest for its non-flammable status.
Chemistry choice shapes the station gear. The solid-state cooler operation may remove active thermal management hardware, lowering the site opex. Conversely, sodium-ion’s larger pack footprint might require cabinet redesigns but offers safer urban basement deployment.
By Battery Form Factor: Fixed Packs Dominate, Modular Gains
Fixed packs accounted for 76.02% of income in 2025 due to straightforward vehicle integration and lower certification hurdles. Modular packs are pacing at a 34.67% CAGR as fleets seek right-sizing; short-haul scooters can run with one brick, and cargo vans can run with three. Partial swaps cut idle inventory and lengthen overall asset life as operators retire only worn modules.
Design trade-offs remain: modular layouts mandate more sophisticated battery-management systems and robotic handling, while fixed packs keep mechanical simplicity. Yet over time, higher utilisation and flexible capacity could tip the total cost of ownership in favour of modulars.
By Ownership Model: Independents Accelerate
OEM networks retained 44.21% of 2025 sales by packaging vehicles and energy services under one brand. Independent operators, advancing 34.51% CAGR, target multi-brand compatibility to push volume per cabinet. Utilities also invest, leveraging low-cost capital and grid know-how to monetise storage value.
Scale economies matter: Aulton’s 800-station footprint and CATL’s Choco-Swap alliance with 100 partners show platform strategies that resemble telecom tower sharing, lifting utilisation and cutting capex per served brand.
By Application: Last-Mile Delivery Anchors Demand
Last-mile delivery generated 37.63% of revenue in 2025 because each two-wheeler courier may execute 60–80 drops daily when the exchange time is under two minutes. Fleet logistics, clocking 32.74% CAGR, benefits from route predictability and depot-level swap hubs. Personal mobility trails but grows steadily as urban commuters test rental plans.
Operational clustering shapes station maps: delivery hot-spots near fulfilment centres justify automated kiosks, while personal mobility widens geographic coverage post-breakeven. Fleet contracts often include minimum swap volumes and lock-in operator payback timelines.
Geography Analysis
Indonesia commands 37.12% of the Southeast Asia battery swapping market share in 2025, supported by a motorcycle fleet exceeding 112 million units and a public network of more than 2,000 swap sites concentrated on Java. The government extends tax holidays to manufacturers, South East through 2025, lowering lease costs for fleet owners. Hyundai Motor and LG Energy Solution have opened the country’s first EV battery plant, a move expected to compress pack logistics costs for local swapping networks. Unlocking this latent demand is central to the next growth wave for the South East Asia battery swapping market.
Thailand targets 650,000 electric two-wheelers and 1,450 battery swap stations by 2030, a trajectory that underpins double-digit annual growth through the forecast period. Its EV 3.5 scheme offers up to USD 2,800 per bike and insists on local assembly by 2027, conditions that align naturally with asset-light swap models mea.or.th. Bangkok already hosts 213 automated kiosks, while Chinese automakers have pledged USD 900 million for local vehicle plants that will widen the compatible model roster.
The Philippines is the fastest-growing geography with a projected 32.69% CAGR, catalysed by VinFast’s USD 1 billion plan to deploy 2,500 electric taxis in Metro Manila and build a 2 GWh cell factory by 2030. Singapore contributes regulatory leadership via the updated TR25 standard and plans for 400 motorcycle-centric swap sites within two years, setting a template other ASEAN states can adopt. Malaysia rounds out the regional picture with a 20% electrified-vehicle target by 2030 and city-planning incentives that prioritise swap-station permits, collectively reinforcing the growth runway for the South East Asia battery swapping market size.
Competitive Landscape
Competition in the Southeast Asian battery swapping market is moderate and fragmented, with no single operator controlling a dominant share of installed swap stations. Global technology leaders such as Gogoro, CATL, and NIO contend with regional specialists, including Selex Motors in Vietnam and Oyika in Cambodia and Indonesia. Independent energy firms and utilities have also entered the field, leveraging lower capital costs and grid expertise to monetise storage revenue streams alongside mobility services.
Strategic partnerships are the preferred path to rapid network expansion. Gogoro’s tie-up with Gojek places battery kiosks inside Pertamina forecourts in Jakarta, giving the Taiwanese brand instant access to high-traffic locations. NIO deepened its alliance with CATL in March 2025, trading equity for guaranteed cell supply and agreeing to embed the Choco-Swap pack format in future mid-market models. CATL simultaneously coordinates a 100-partner ecosystem that standardises two battery sizes to simplify cross-brand compatibility and lower inventory costs for station owners. Selex Motors focuses on fleet integrations; its two-minute “battery ATM” network serves Grab and Lazada couriers in Ho Chi Minh City, raising daily swap volumes that surpass consumer-only sites.
Competitive dynamics now hinge on three factors: speed of cross-OEM standard adoption, access to project finance that defers cash burn during build-out, and the ability to blend mobility revenues with grid-services income. Operators that crack rural coverage through mobile swap vans or micro-grid partnerships could capture untapped demand in Indonesia’s outer islands and the Philippines’ archipelago.
South East Asia Battery Swapping Industry Leaders
Blueshark Ecosystem Sdn. Bhd.
Oyika Pte Ltd
PT Swap Energy Indonesia
Selex JSC
Gogoro Inc.
- *Disclaimer: Major Players sorted in no particular order

Recent Industry Developments
- June 2025: VinFast pledged USD 1 billion to deploy 2,500 electric taxis in Metro Manila, creating 70,000 jobs and setting a regional fleet benchmark.
- May 2025: TMT Motors earmarked VND 100 billion (USD 4 million) for a subsidiary planning 30,000 EV charge sites with 60,000 guns across Vietnam.
- March 2025: NIO and CATL formed a swapping-station alliance, with CATL investing USD 345.6 million and integrating Choco-Swap packs into future mid-market models.
- December 2024: CATL unveiled the Choco-Swap ecosystem, introducing two standardised batteries rated 42 kWh and 70 kWh for 400–600 km ranges.


Research Methodology Framework and Report Scope
Market Definitions and Key Coverage
Our study defines the Southeast Asia battery swapping market as all commercial networks, equipment, and recurring services that enable electric two- and three-wheeler owners to exchange a depleted traction battery for a fully charged unit within purpose-built swap cabinets or automated hubs. The valuation includes hardware sales, subscription fees, pay-per-use charges, and associated software platforms recorded within Indonesia, Thailand, Vietnam, Malaysia, Singapore, the Philippines, and the remaining ASEAN nations.
Scope exclusion: passenger car swap programs, stationary energy-storage cabinets, and one-off pilot projects with fewer than ten active swap points are not counted.
Segmentation Overview
- By Vehicle Type
- Two-Wheeler
- Three-Wheeler
- By Service Type
- Subscription
- Pay-per-Use
- Hybrid Models
- By Station Type
- Manual Swap Station
- Automated Swap Station
- Mobile Swap Unit
- By Battery Chemistry
- Lithium-ion
- Lead-acid
- Solid-state
- Others
- By Battery Form Factor
- Fixed Pack
- Modular Pack
- By Ownership Model
- OEM-Owned
- Utility / Energy-Company-Owned
- Independent Third-Party Operators
- By Application
- Personal Mobility
- Ride-hailing / Taxi
- Last-Mile Delivery
- Fleet Logistics
- By Country
- Indonesia
- Thailand
- Vietnam
- Malaysia
- Singapore
- Philippines
- Rest of South East Asia
Detailed Research Methodology and Data Validation
Primary Research
Mordor analysts interviewed battery-as-a-service executives, ride-hailing fleet managers, charger OEMs, and regulators across Jakarta, Bangkok, Ho Chi Minh City, Manila, and Kuala Lumpur. These conversations verified swap-station uptime, average daily swaps, cabinet capex, and realistic subscription uptake, filling gaps left by desk research and anchoring key model drivers.
Desk Research
We extracted foundational volumes on electric two-wheeler parc, annual registrations, and charging-infrastructure roll-outs from sources such as ASEAN Automotive Federation statistics, Indonesia's Ministry of Industry e-mobility dashboard, Thailand's Department of Alternative Energy Development, Vietnam Customs trade tables, and peer-reviewed papers indexed on ScienceDirect. Company filings, investor decks, leading press coverage, and our paid D&B Hoovers and Dow Jones Factiva feeds helped us size operator footprints and track pricing moves. The sources named above are illustrative; many additional open and paid repositories were reviewed to sharpen figures and assumptions.
Market-Sizing & Forecasting
A top-down build began with the in-service two- and three-wheeler pool, applying model-year level EV penetration rates, average swap frequency, and prevailing service tariffs to reconstruct annual spending. Results were cross-checked through a selective bottom-up roll-up of cabinet counts multiplied by average revenue per cabinet and sample supplier quotations. Critical variables, urban EV parc growth, cabinet utilization cycles, battery leasing price trajectories, power-tariff indexation, and policy incentives feed a multivariate regression and scenario analysis that projects value to 2030. Where operator-level data were patchy, we bridged gaps by applying verified utilization proxies from comparable cities and then validated these with local experts before locking the baseline.
Data Validation & Update Cycle
Outputs undergo variance checks against customs battery-pack import data and quarterly station deployment tallies. Senior reviewers sign off after reconciling anomalies. We refresh the file each year and issue interim revisions when material policy or price shocks occur. A final analyst pass is completed immediately before client delivery.
Why Mordor's South East Asia Battery Swapping Baseline Commands Trust
Published estimates often diverge because firms pick dissimilar geographies, include differing revenue streams, or stretch forecasts far beyond verifiable infrastructure roll-outs.
Key gap drivers here involve (i) whether four-wheeler swap pilots are folded into totals, (ii) how subscription discounts are annualized, (iii) currency-conversion timing, and (iv) refresh cadence. Mordor updates annually, whereas some outlets keep 18- to 24-month cycles.
Benchmark comparison
| Market Size | Anonymized source | Primary gap driver |
|---|---|---|
| USD 0.71 B (2025) | Mordor Intelligence | - |
| USD 12.57 M (2022) | Regional Consultancy A | Counts only manual stations and excludes service revenue, leading to understatement |
| USD 240.7 M (2024, Global) | Trade Journal B | Global scope blended with charging hardware; lacks ASEAN split, diluting regional view |
| USD 20.26 B (2035, Asia-Pacific) | Global Consultancy C | Wider geography and ten-year horizon inflate number versus our near-term, SEA-only baseline |
The comparison shows that once geography, revenue buckets, and forecast span are aligned, Mordor's disciplined, annually refreshed approach delivers a balanced, transparent baseline that decision-makers can trace to clear variables and reproducible steps.


Key Questions Answered in the Report
What is the current size of the Southeast Asia battery swapping market?
The market stands at USD 0.94 billion in 2026 with a 32.52% CAGR to 2031.
Which country leads the Southeast Asia battery swapping market?
Indonesia holds the largest share at 37.12% because of its vast motorcycle fleet and supportive incentives.
Why are subscription models popular for battery swapping?
Subscriptions provide predictable monthly costs and can cut per-swap expenses up to 30% for high-utilisation fleets.
What is the biggest obstacle to faster deployment?
Automated station capex of USD 150,000–300,000 remains the primary barrier, especially in lower-density areas.
How do battery swapping stations support the power grid?
When paired with solar, stations act as distributed storage, selling power back during peak demand and improving project returns by 20–30%.
Which battery chemistry is expected to grow the fastest?
Solid-state batteries show the highest projected CAGR at 32.56% owing to safety and energy-density advantages.
Page last updated on:


