Market Overview
| Study Period | 2021 - 2031 |
|---|---|
| Forecast Data Period | 2026 - 2031 |
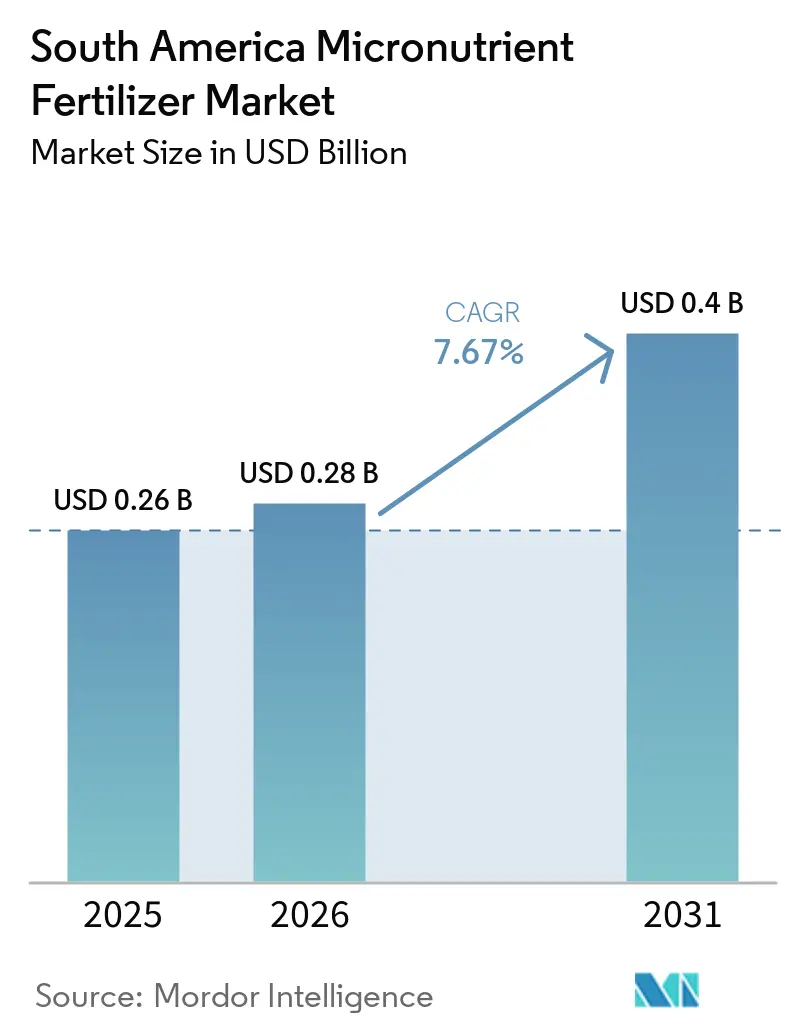
| Base Year Market Size (2025) | USD 0.26 Billion |
| Market Size (2026) | USD 0.28 Billion |
| Market Size (2031) | USD 0.4 Billion |
| Growth Rate (2026 - 2031) | 7.67% CAGR |
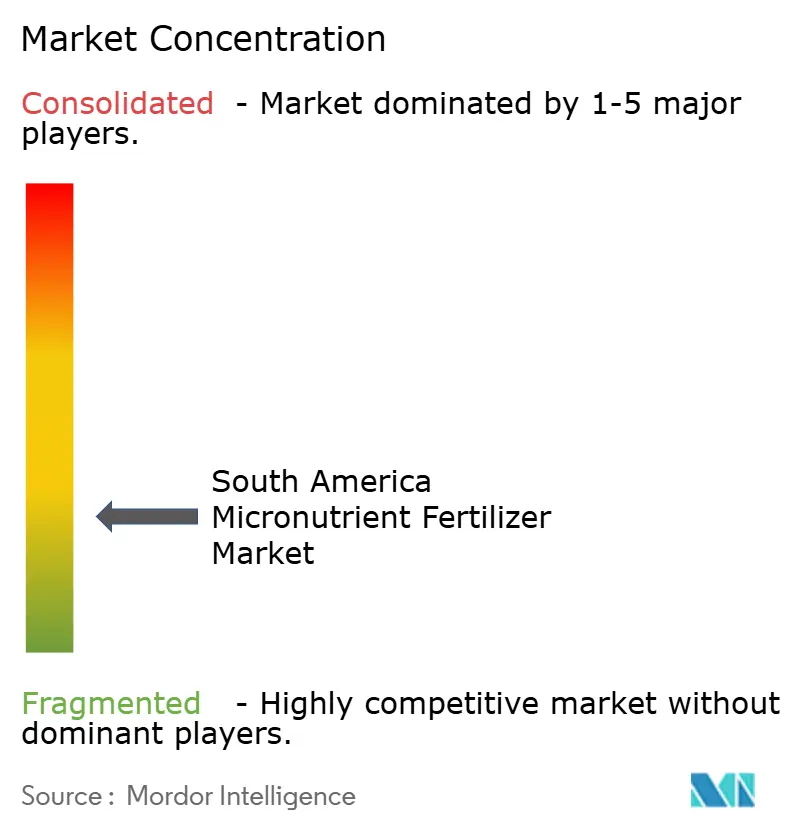
| Market Concentration | Medium |
Major Players*Disclaimer: Major Players sorted in no particular order Image © Mordor Intelligence. Reuse requires attribution under CC BY 4.0. | |
South America Micronutrient Fertilizer Market Analysis by Mordor Intelligence
The South America micronutrient fertilizer market size was valued at USD 0.26 billion in 2025 and estimated to grow from USD 0.28 billion in 2026 to reach USD 0.40 billion by 2031, at a CAGR of 7.67% during the forecast period (2026-2031). Brazil’s National Fertilizer Plan 2050 and persistent zinc-deficient soils across Brazil and Argentina frame the expansion of the micronutrient fertilizer market. Continued soybean and corn acreage growth, coupled with rising precision-ag adoption, underpins consistent demand for targeted blends suited to diverse soil profiles. Logistics bottlenecks in interior regions inflate delivered costs yet simultaneously spur local production investments encouraged by the national plan. Fragmented competitive dynamics, in which the top five players jointly hold a smaller share, create whitespace for regional formulators fluent in crops, soils, and specialty application modes. Higher-margin niches continue to appear as sugarcane fertigation, specialty coffee, and premium fruit exports all demand customized micronutrient solutions.
Key Report Takeaways
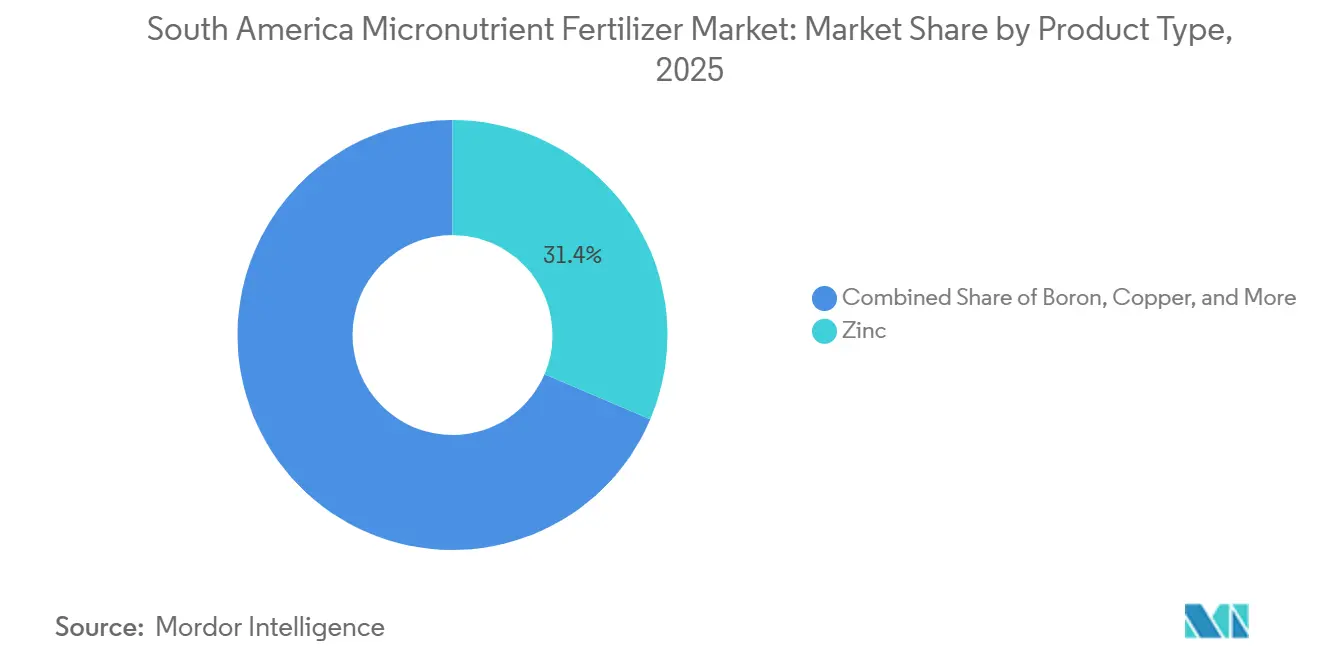
- By product, zinc led with 31.4% of the South America micronutrient fertilizer market share in 2025 and is projected to expand at a 7.0% CAGR through 2031.
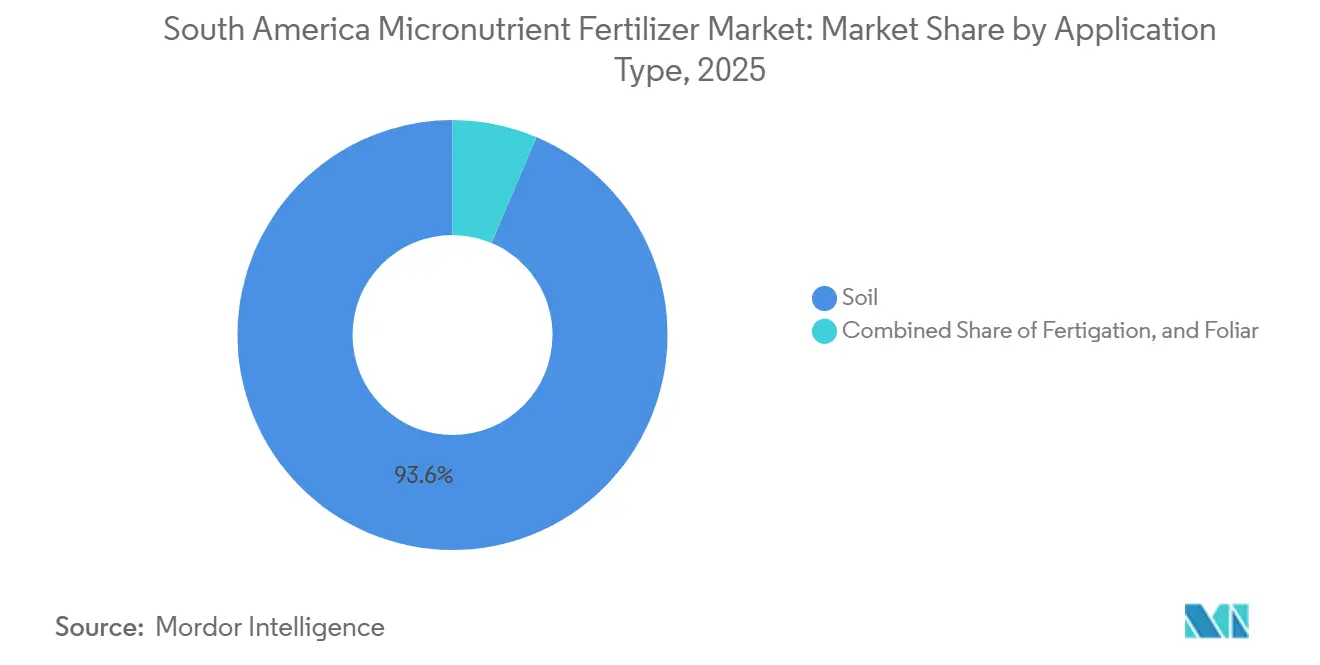
- By application mode, soil application mode accounted for 93.6% of the South America micronutrient fertilizer market size in 2025, whereas fertigation is set to grow at a 6.0% CAGR through 2031.
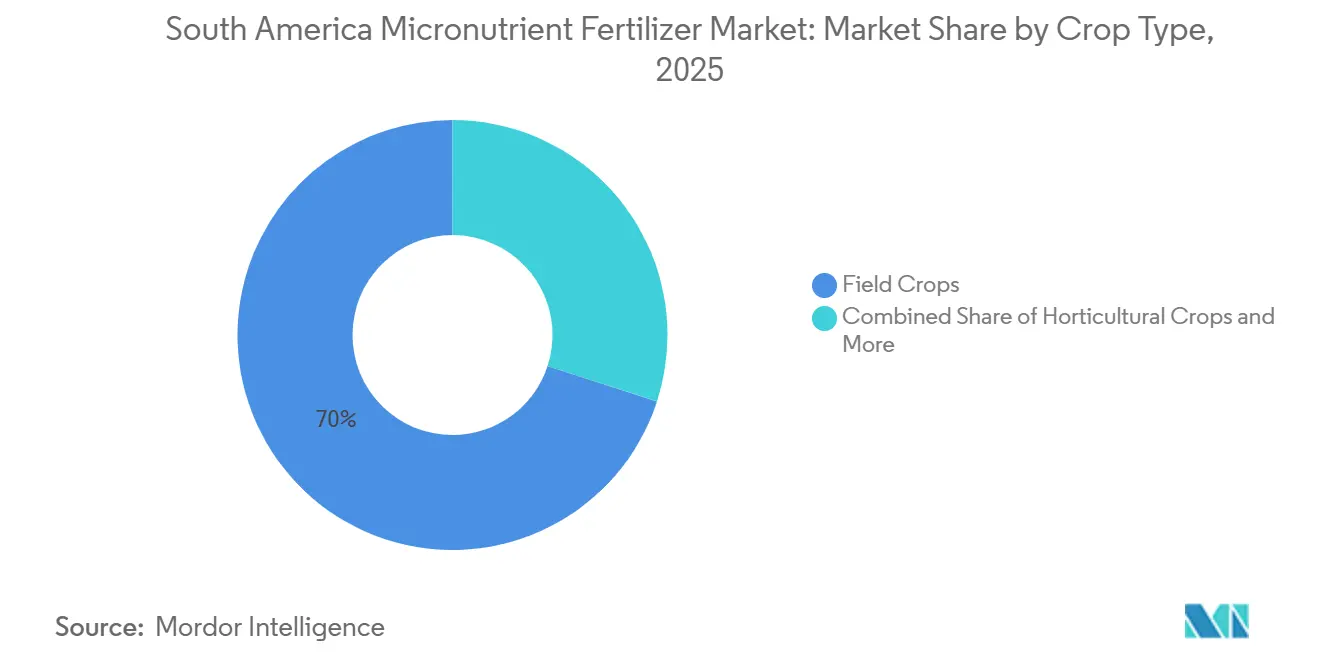
- By crop type, field crops captured 70.0% of the market share in 2025, and horticultural crops are projected to grow at a 6.8% CAGR through 2031.
- By geography, Brazil held a 57.0% share of the market in 2025 and is forecast to grow at a 6.1% CAGR to 2031.
Note: Market size and forecast figures in this report are generated using Mordor Intelligence’s proprietary estimation framework, updated with the latest available data and insights as of 2026.
South America Micronutrient Fertilizer Market Trends and Insights
Drivers Impact Analysis*
| Driver | ( ~ ) % Impact on CAGR Forecast | Geographic Relevance | Impact Timeline |
|---|---|---|---|
| Widespread zinc-deficient soils driving corrective demand | +1.2% | Brazil, Argentina core regions | Long term (≥ 4 years) |
| Expansion of soybean and corn acreage | +1.0% | Brazil Cerrado, Argentine Pampas | Medium term (2-4 years) |
| Precision-ag adoption and soil-testing penetration | +0.8% | Brazil, Argentina with spillover to Chile | Medium term (2-4 years) |
| National Fertilizer Plan 2050 incentives for domestic supply | +0.7% | Brazil national, limited regional spillover | Long term (≥ 4 years) |
| Premium micronutrient blends for specialty coffee and fruit exports | +0.5% | Brazil, Colombia, Ecuador highlands | Short term (≤ 2 years) |
| Sugarcane ethanol clusters adopting fertigation infrastructure | +0.4% | Brazil São Paulo, Goiás, Minas Gerais | Medium term (2-4 years) |
| Source: Mordor Intelligence | |||


Widespread Zinc-Deficient Soils Driving Corrective Demand
Extensive soil tests reveal that more than half of Brazilian and Argentine croplands exhibit DTPA-extractable zinc levels below critical thresholds, underscoring a structural requirement for sustained zinc supplementation [1]Brazilian Agricultural Technology Association, “Censo Agro Digital 2024,” ABAG, abag.com.br. These deficiencies span 12.15 million hectares across the Argentine Pampas alone [2]Argentine National Institute of Agricultural Technology, “Deficiencia de zinc en suelos pampeanos,” INTA, inta.gob.ar. High-pH conditions in Brazil’s Cerrado further diminish zinc bioavailability, even when total soil zinc appears sufficient. Resulting protein and grain-quality penalties erode export premiums, prompting growers to invest in corrective zinc programs that typically require two or more seasons to restore optimal status. Because soil zinc recovery is slow, a predictable replacement cycle stabilizes purchasing volumes for suppliers. The enduring nature of the deficiency anchors the long-term growth of the micronutrient fertilizer market.
Expansion of Soybean and Corn Acreage
Brazil’s record grain harvest, projected at 341 million metric tons for 2025, reflects the continued expansion of soybean and corn acreage that today represents three-quarters of the planted area [3]Source: Brazilian Sugarcane Industry Association, “Histórico de Área IBGE,” UNICA, unicadata.com.br. Soybeans lift molybdenum demand by facilitating nitrogen fixation, while corn’s high uptake of potassium and phosphorus often triggers secondary zinc and manganese deficiencies. Hybrid corn varieties require 15-20% more zinc to realize full yield potential, intensifying per-hectare micronutrient needs. Argentinian growers pushing into marginal lands face soils with lower organic matter, magnifying micronutrient depletion. Export contracts that now specify trace-element minimums reinforce the commercial necessity of balanced nutrient programs. Together, acreage gains and quality standards ignite recurring orders across the micronutrient fertilizer market.
Precision-ag Adoption and Soil Testing Penetration
Roughly 84% of Brazilian farms now deploy at least one digital ag technology, with soil testing and variable-rate spreaders among the most common tools. Grid sampling exposes within-field variability, converting blanket micronutrient applications into data-driven prescriptions. GPS-guided spreaders can deliver customized blends across a single pass, cutting waste and uplifting yields. Suppliers that offer formulation flexibility and analytics support stand to capture loyalty, as growers increasingly view micronutrients as managed inputs rather than “insurance” applications. Adoption extends to Argentine producers in high-value wheat and soybean belts, signaling region-wide maturation. This tech infusion reshapes demand toward premium, often chelated, micronutrient products and reinforces long-term upside for the micronutrient fertilizer market.
National Fertilizer Plan 2050 Incentives for Domestic Supply
Brazil’s National Fertilizer Plan 2050 aims to shrink import dependence from 87% to 45% by channeling USD 25 billion in annual incentives into domestic capacity[4]Ministry of Agriculture Brazil, “Plano Nacional de Fertilizantes 2050,” Government of Brazil, gov.br. Tax holidays, subsidized loans, and fast-track permitting collectively lower capital hurdles for micronutrient plants. Projects sited in interior states benefit from freight savings that can run 25-30% of delivered cost. Preferential procurement clauses guarantee offtake to compliant producers, improving bankability. Although the plan’s initial beneficiaries are domestic conglomerates, global majors with local joint ventures also qualify. Resulting capacity expansions will gradually ease logistics constraints and enhance supply reliability, both of which advance adoption across the micronutrient fertilizer market.
Restraints Impact Analysis*
| Restraint | ( ~ ) % Impact on CAGR Forecast | Geographic Relevance | Impact Timeline |
|---|---|---|---|
| High price sensitivity among smallholders | −0.9% | Brazil, Argentina rural regions | Short term (≤ 2 years) |
| Logistics bottlenecks inflating delivered cost | −0.7% | Remote agricultural areas, interior regions | Medium term (2-4 years) |
| Volatile by-product supply of industrial metals | −0.5% | Global supply chains affecting South America | Short term (≤ 2 years) |
| Export-market scrutiny of chelate residues | −0.4% | Export-oriented agricultural regions | Long term (≥ 4 years) |
| Source: Mordor Intelligence | |||
High Price Sensitivity Among Smallholders
Roughly 60% of Brazilian and Argentine farms operate on less than 100 ha, and many rely on basic sulfate formulations costing around USD 800 per metric ton, while chelated alternatives often exceed USD 2,000 per metric ton[5]Brazilian Agricultural Confederation, “Custos de Produção Agrícola,” CNA, cna.org.br. Credit programs prioritize NPK fertilizers, leaving micronutrients underfinanced. Cooperative purchases offset some costs, but struggle to align diverse soil needs. During commodity price dips, growers trim discretionary inputs, delaying chelated micronutrient adoption even when agronomic ROI is evident. Suppliers must therefore balance premium positioning with affordable entry-level offerings to sustain penetration in the micronutrient fertilizer market.
Logistics Bottlenecks Inflating Delivered Cost
Poor roads and congested ports add 25-30% to micronutrient delivery costs in Brazil’s Cerrado and Argentina’s northern provinces. Granular micronutrients require specialized storage and handling, shrinking carrier options and pushing freight rates above bulk NPK cargos. Seasonal shipping peaks worsen bottlenecks, as demand clusters around planting months. Port delays at Santos and Buenos Aires force distributors to stockpile inventory, swelling working capital burdens. High delivered prices can push growers to defer applications, particularly for foliar or corrective treatments, and thereby dampen immediate expansion of the micronutrient fertilizer market.
*Our forecasts treat driver/restraint impacts as directional, not additive. The impact forecasts reflect baseline growth, mix effects, and variable interactions.
Segment Analysis
By Product: Zinc’s Dominance Mirrors Regional Soil Profiles
Zinc accounted for 31.4% of the South America micronutrient fertilizer market zinc in 2025 and posted the fastest growth, with a 7.0% CAGR through 2026-2031. Corrective applications across 12.15 million hectares support its sustained leadership in the market. Demand for zinc-based micronutrient fertilizers is projected to expand steadily, driven by stringent grain-quality specifications in export contracts. Molybdenum, though smaller, accelerates as soybean acreage rises, elevating attention to nitrogen-fixing efficiency. Copper, iron, and manganese cater to crop-specific niches such as Chilean fruits, Argentine wheat, and high-pH soybean soils. Boron remains essential in flowering crops such as coffee and mango. Advanced chelation, notably EDDHA, gains traction in high-pH zones despite higher prices, signaling an ongoing shift from basic sulfates toward value-added chemistries.
Growing awareness of secondary deficiencies pushes growers to adopt multi-micro mixes that mitigate hidden yield losses. Suppliers that bundle zinc with manganese and boron capture cross-selling synergies. As Brazilian regulation fast-tracks domestic capacity, local chelate production may narrow price gaps, smoothing the adoption curve. Concurrently, patent activity in nano-encapsulation and controlled-release formats promises step-wise improvements in nutrient-use efficiency, further enriching the product landscape and supporting long-term market value growth.


By Application Mode: Soil Broadcasting Reigns, Fertigation Scales
Soil broadcasting accounted for 93.6% of the South America micronutrient fertilizer market share in 2025 due to its compatibility with large-scale mechanized planting. The segment benefits from low application cost, bulk logistics, and growers’ familiarity with granular inputs. Foliar sprays remain tactical tools for quick corrections in specialty crops but face weather windows that restrict adoption.
Fertigation is projected to grow at a 6.0% CAGR through 2031, driven by drip irrigation in sugarcane and horticulture. Its precise placement enhances nutrient-use efficiency by 20-25%, justifying premium formulations. The micronutrient fertilizer market for fertigation-compatible products is growing faster than the overall market, rewarding suppliers that master solubility and chelation stability. Integration with digital irrigation management further maximizes uptake, providing decision support based on evapotranspiration and phenology. In parallel, controlled-release granules for no-till systems are gaining modest traction, offering predictable release under variable moisture conditions. As irrigation infrastructure proliferates in drought-prone regions, fertigation’s share is poised to double by 2031, though soil application will still dominate tonnage in field crops.
By Crop Type: Field Crops Anchor Volume, Specialties Lift Margin
Field crops dominated the South America micronutrient fertilizer market, accounting for 70.0% of total revenue in 2025, driven by continued expansion of soybean and corn acreage across Brazil's Cerrado and Argentina's Pampas regions. Their dominance is supported by the increasing importance of trace-element management in improving yields, crop quality, and export competitiveness. Modern crop hybrids intensify per-hectare nutrient uptake, particularly for zinc and manganese. Specialty crops such as coffee, citrus, mango, and vegetables contribute disproportionately to market value despite their smaller cultivated area. Premium coffee production, in particular, supports demand for customized micronutrient blends and higher-value formulations.
Horticultural crops are projected to be the fastest-growing segment, registering a CAGR of 6.8% through 2031. Growth is driven by the need for precise nutrient management in high-value crops such as fruits, vegetables, vineyards, citrus, and berries to maximize yield, quality, and export performance. These crops are highly sensitive to deficiencies of zinc, boron, iron, and manganese, which influence flowering, fruit set, size, color, shelf life, and overall marketability. The expansion of export-oriented horticulture in Brazil, Chile, Peru, and Argentina, combined with increasing adoption of fertigation and foliar application technologies, is supporting higher micronutrient consumption. Turf and ornamental applications remain relatively small but offer long-term growth opportunities as investments in urban landscaping, recreational facilities, and commercial green spaces increase. Overall, the South America micronutrient fertilizer market benefits from a balanced demand structure, with field crops providing scale and specialty crops driving innovation and value creation.
Geography Analysis
Brazil accounted for a 57.0% share of the South America micronutrient fertilizer market size in 2025 and is projected to grow at a CAGR of 6.1% through 2031. This leadership is attributed to the country’s USD 5.2 billion specialty coffee industry and a grain harvest of 341 million metric tons, both of which rely heavily on effective micronutrient management. The country’s Cerrado region alone hosts 200 million ha of cultivable land, where high pH soils suppress the availability of zinc and manganese. São Paulo’s sugarcane clusters accelerate demand for fertigation, while Minas Gerais coffee estates drive specialized boron-zinc blends that support export grades. Brazil’s National Fertilizer Plan 2050 further sweetens local investment by trimming import dependence and ensuring long-run supply security.
Argentina’s Pampas region, spanning Buenos Aires, Córdoba, and Santa Fe provinces, accounts for the bulk of the nation’s micronutrient spending. Zinc deficiencies across 12.15 million ha reduce wheat protein content, narrowing export premiums unless mitigated by targeted applications. Buenos Aires port congestion inflates landed input costs, yet rapid precision-ag adoption in no-till systems offsets some logistical drawbacks. SENASA’s (National Food Safety and Quality Service) alignment with Codex standards boosts compliance for export-oriented growers, thereby reinforcing structured micronutrient programs that meet global traceability expectations.
Rest of South America comprises fast-emerging micronutrient pockets. Chile’s fruit valleys pay 25-40% premiums for micronutrient formulations meeting European residue norms, while Colombia’s coffee axis values trace element ratios integral to flavor profiles. Uruguay scales commercial soybean production and mirrors Argentine soil deficiency patterns, creating a new frontier for zinc-centric blends. Regional trade corridors and free-trade deals facilitate cross-border distribution from Brazilian production bases, tightening delivery cycles and curbing costs. Overall, geography-specific drivers and constraints combine to protect regional momentum, ensuring robust expansion of the micronutrient fertilizer market.
Competitive Landscape
The South American micronutrient fertilizer market remains moderately fragmented, with the top five players controlling a smaller combined share. The Mosaic Company leads through its MicroEssentials SZ platform that integrates sulfur and zinc into every granule. Yara International secures second place, leveraging proprietary chelate technologies and comprehensive field service. EuroChem’s 2024 joint venture with Heringer accelerates its reach in Minas Gerais and Goiás, while ICL and Nutrien strengthen their portfolios through controlled-release and local acquisitions. Regional specialists such as FertGrow and Inquima cater to local soil chemistries, often undercutting global majors on freight costs.
Innovation competition intensifies, as patent filings in nano-encapsulation and controlled release rise, promising higher nutrient-use efficiency and environmental compliance. Suppliers pair digital agronomy platforms with physical products, offering variable-rate prescriptions that cement customer loyalty.
Regulatory scrutiny on chelate residues creates barriers for firms lacking R&D muscle, thereby favoring diversified players with global labs. Yet, modest overall concentration leaves room for niche entrants specializing in fertigation-compatible liquids or organic-certified blends, reinforcing a dynamic, opportunity-rich competitive environment.
South America Micronutrient Fertilizer Industry Leaders
The Mosaic Company
Yara International ASA
EuroChem Group
K+S Aktiengesellschaft
Nortox S.A.
- *Disclaimer: Major Players sorted in no particular order

Recent Industry Developments
- August 2025: Yara introduced a new market access strategy in Brazil aimed at increasing the availability of high-technology, value-added products for rural producers. The company is establishing commercial agreements with input distributors to position them as brand representatives in the field. These agreements have an initial duration of four years and are based on criteria such as the distributors' history, performance, and location.
- April 2025: Yara introduced YaraBasa TURBO, expanding its established YaraBasa product line. This product line is developed and formulated to address the specific needs of Brazilian soils and key crops, ensuring a balanced nutrient supply for base fertilization, which is critical for successful harvests.
- April 2023: K+S acquired a 75% stake in the fertilizer business of Industrial Commodities Holdings (Pty) Ltd (ICH), a South African trading company. This acquisition expanded K+S's presence in the fertilizer market and strengthened its operations in southern and eastern Africa. Additionally, it aligns with K+S's strategic global expansion, which could influence its broader supply chains, including those in South America.


South America Micronutrient Fertilizer Market Report Scope
Boron, Copper, Iron, Manganese, Molybdenum, Zinc, Others are covered as segments by Product. Fertigation, Foliar, Soil are covered as segments by Application Mode. Field Crops, Horticultural Crops, Turf & Ornamental are covered as segments by Crop Type. Argentina, Brazil are covered as segments by Country.By Product
| Boron |
| Copper |
| Iron |
| Manganese |
| Molybdenum |
| Zinc |
| Others |
By Application Mode
| Fertigation |
| Foliar |
| Soil |
By Crop Type
| Field Crops |
| Horticultural Crops |
| Turf and Ornamental |
By Country
| Argentina |
| Brazil |
| Rest of South America |
| By Product | Boron |
| Copper | |
| Iron | |
| Manganese | |
| Molybdenum | |
| Zinc | |
| Others | |
| By Application Mode | Fertigation |
| Foliar | |
| Soil | |
| By Crop Type | Field Crops |
| Horticultural Crops | |
| Turf and Ornamental | |
| By Country | Argentina |
| Brazil | |
| Rest of South America |


Market Definition
- MARKET ESTIMATION LEVEL - Market Estimations for various types of fertilizers has been done at the product-level and not at the nutrient-level.
- NUTRIENT TYPES COVERED - Micronutients: Zn, Mn, Cu, Fe, Mo, B, and Others
- AVERAGE NUTRIENT APPLICATION RATE - This refers to the average volume of nutrient consumed per hectare of farmland in each country.
- CROP TYPES COVERED - Field Crops: Cereals, Pulses, Oilseeds, and Fiber Crops Horticulture: Fruits, Vegetables, Plantation Crops and Spices, Turf Grass and Ornamentals
| Keyword | Definition |
|---|---|
| Fertilizer | Chemical substance applied to crops to ensure nutritional requirements, available in various forms such as granules, powders, liquid, water soluble, etc. |
| Specialty Fertilizer | Used for enhanced efficiency and nutrient availability applied through soil, foliar, and fertigation. Includes CRF, SRF, liquid fertilizer, and water soluble fertilizers. |
| Controlled-Release Fertilizers (CRF) | Coated with materials such as polymer, polymer-sulfur, and other materials such as resins to ensure nutrient availability to the crop for its entire life cycle. |
| Slow-Release Fertilizers (SRF) | Coated with materials such as sulfur, neem, etc., to ensure nutrient availability to the crop for a longer period. |
| Foliar Fertilizers | Consist of both liquid and water soluble fertilizers applied through foliar application. |
| Water-Soluble Fertilizers | Available in various forms including liquid, powder, etc., used in foliar and fertigation mode of fertilizer application. |
| Fertigation | Fertilizers applied through different irrigation systems such as drip irrigation, micro irrigation, sprinkler irrigation, etc. |
| Anhydrous Ammonia | Used as fertilizer, directly injected into the soil, available in gaseous liquid form. |
| Single Super Phosphate (SSP) | Phosphorus fertilizer containing only phosphorus which has lesser than or equal to 35%. |
| Triple Super Phosphate (TSP) | Phosphorus fertilizer containing only phosphorus greater than 35%. |
| Enhanced Efficiency Fertilizers | Fertilizers coated or treated with additional layers of various ingredients to make it more efficient compared to other fertilizers. |
| Conventional Fertilizer | Fertilizers applied to crops through traditional methods including broadcasting, row placement, ploughing soil placement, etc. |
| Chelated Micronutrients | Micronutrient fertilizers coated with chelating agents such as EDTA, EDDHA, DTPA, HEDTA, etc. |
| Liquid Fertilizers | Available in liquid form, majorly used for application of fertilizers to crops through foliar and fertigation. |


Research Methodology
Mordor Intelligence follows a four-step methodology in all our reports.
- Step-1: IDENTIFY KEY VARIABLES: In order to build a robust forecasting methodology, the variables and factors identified in Step-1 are tested against available historical market numbers. Through an iterative process, the variables required for market forecast are set and the model is built on the basis of these variables.
- Step-2: Build a Market Model: Market-size estimations for the forecast years are in nominal terms. Inflation is not a part of the pricing, and the average selling price (ASP) is kept constant throughout the forecast period for each country.
- Step-3: Validate and Finalize: In this important step, all market numbers, variables and analyst calls are validated through an extensive network of primary research experts from the market studied. The respondents are selected across levels and functions to generate a holistic picture of the market studied.
- Step-4: Research Outputs: Syndicated Reports, Custom Consulting Assignments, Databases & Subscription Platforms


