
South America Container Terminal Operations Market Size and Share
Market Overview
| Study Period | 2020 - 2031 |
|---|---|
| Forecast Data Period | 2026 - 2031 |
| Base Year Market Size (2025) | USD 4.37 Billion |
| Market Size (2026) | USD 4.56 Billion |
| Market Size (2031) | USD 5.66 Billion |
| Growth Rate (2026 - 2031) | 4.42 % |
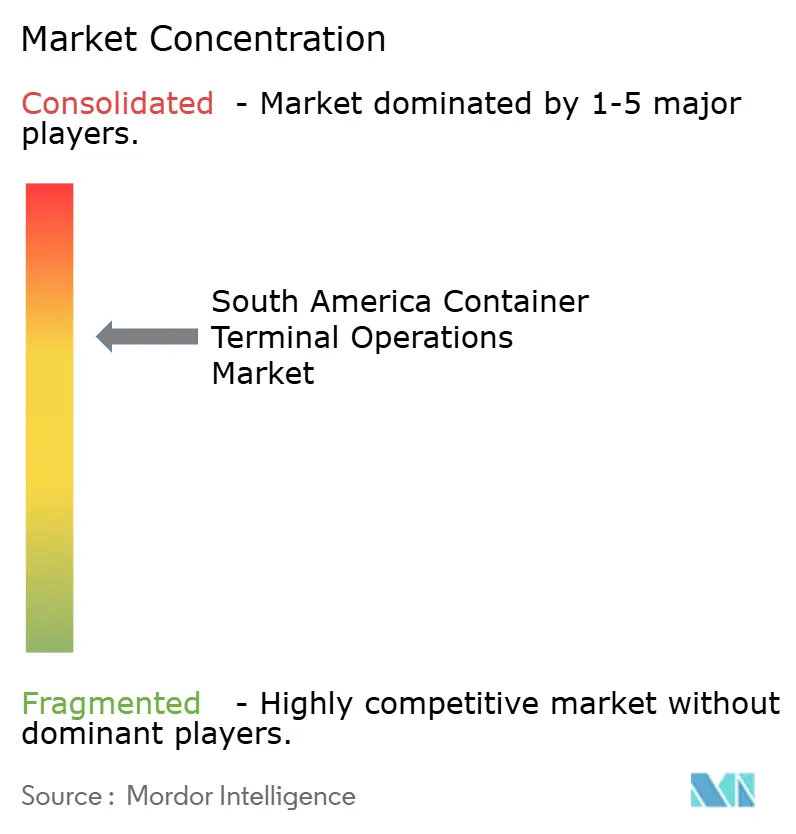
| Market Concentration | Medium |
Major Players
*Disclaimer: Major Players sorted in no particular order Image © Mordor Intelligence. Reuse requires attribution under CC BY 4.0. |
|
South America Container Terminal Operations Market Analysis by Mordor Intelligence
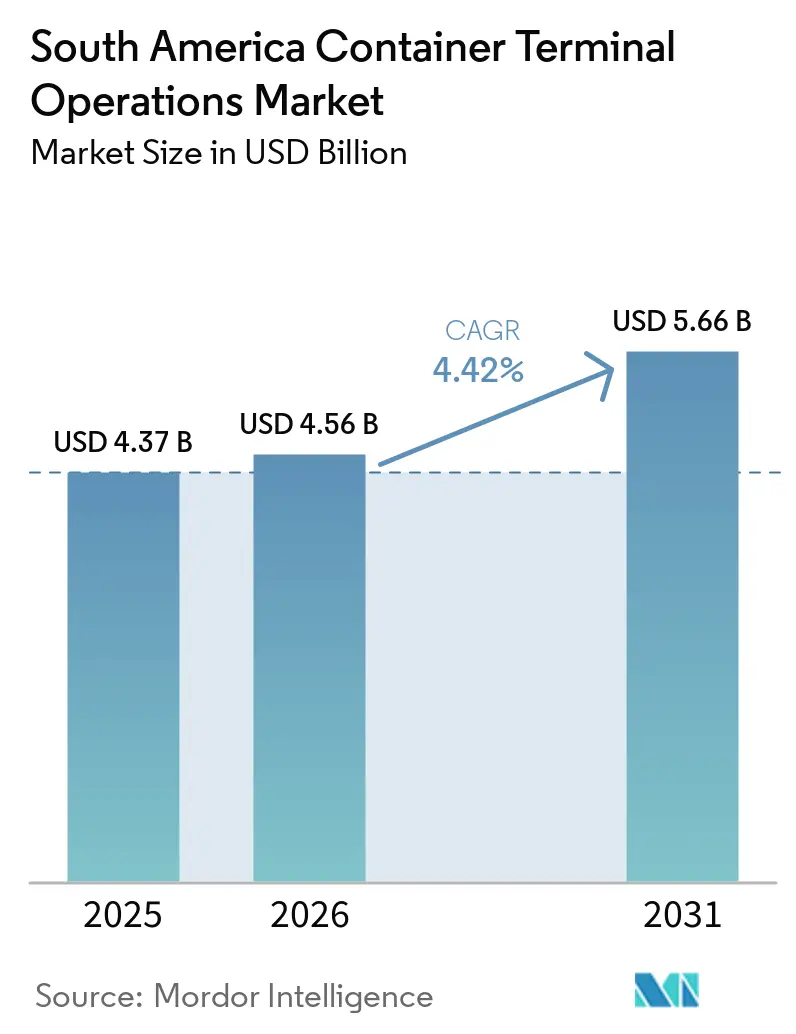
The South America container terminal operations market size was valued at USD 4.37 billion in 2025 and is estimated to grow from USD 4.56 billion in 2026 to reach USD 5.66 billion by 2031, at a CAGR of 4.42% during the forecast period (2026-2031).
Agribusiness export chains, stronger links with Asia-Pacific routes, and concession-backed capacity projects support demand across the South America container terminal operations market, while direct Pacific connections are changing the cargo-routing choices available to importers and exporters and placing greater focus on gateway reliability. Terminal operators are extending their role beyond quay handling by adding warehousing, rail links, inland transport, cold-chain facilities, customs support, and other services that allow customers to manage more of their logistics through one provider. Brazil, Chile, Peru, and Colombia are refining concession frameworks to attract private capital with longer investment horizons, because berth expansions require coordinated investment in access channels, equipment, yards, workforce capability, and cargo connections. Competition for transshipment traffic is influencing investment priorities on both Atlantic and Pacific coastlines, particularly as Chancay and Callao develop roles in shorter Asia-Pacific service patterns.
Key Report Takeaways
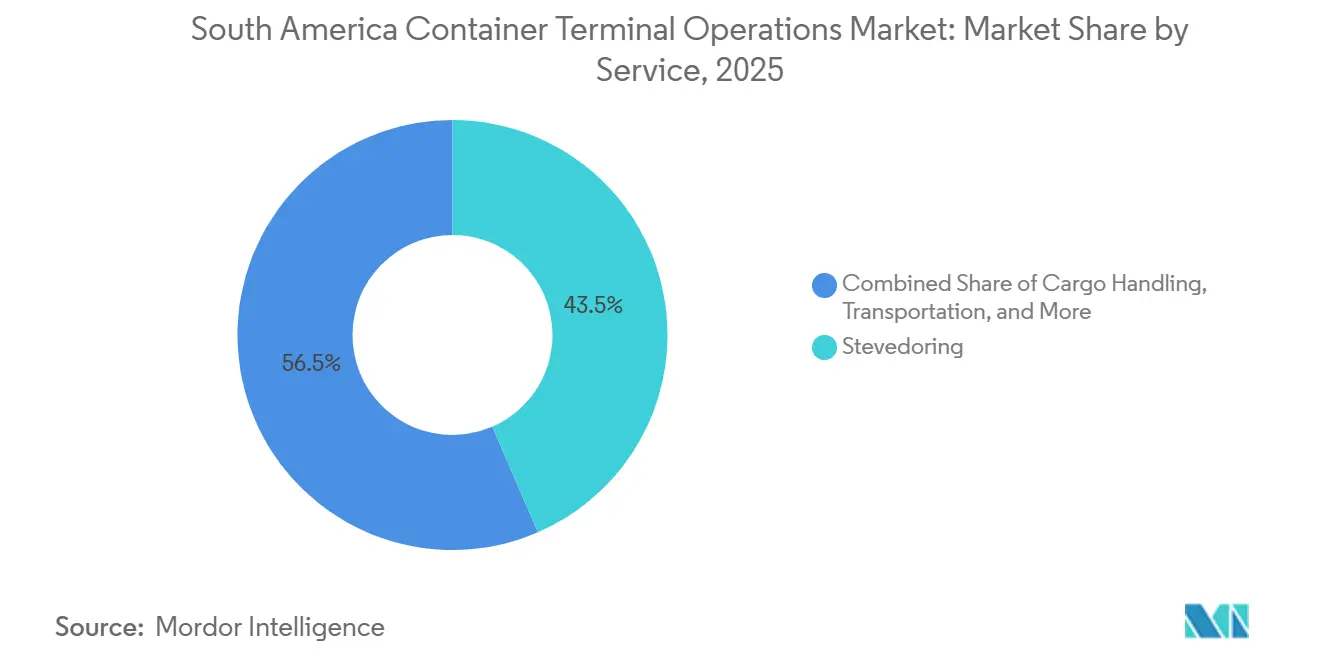
- By service, stevedoring held 43.50% of the South America container terminal operations market share in 2025, while transportation is expected to be the fastest-growing service segment at a 4.81% CAGR through 2031.
- By ownership model, state-owned terminals held 47.06% of the South America container terminal operations market size in 2025, while public-private partnerships are projected to grow at a 5.15% CAGR through 2031.
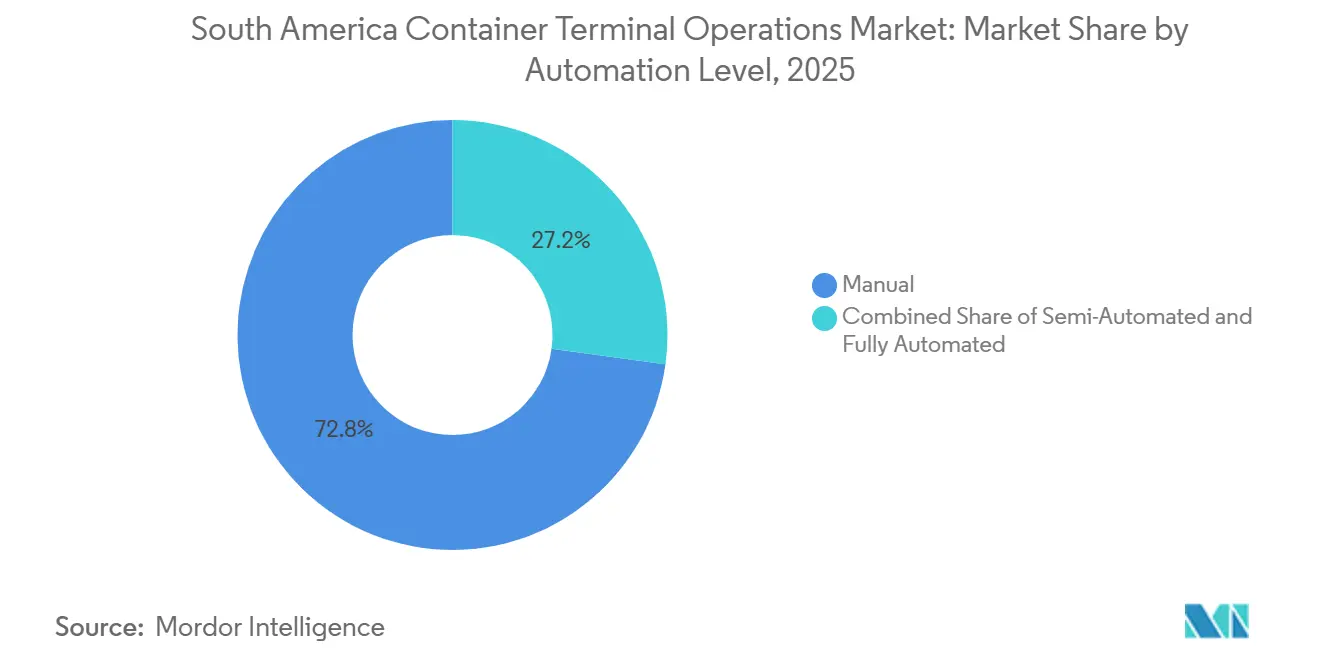
- By automation level, manual operations held 72.82% of the South America container terminal operations market share in 2025, while fully automated terminals are projected to grow at a 6.33% CAGR through 2031.
- By container type, general containers held 57.43% of the South America container terminal operations market size in 2025, while reefer containers are projected to grow at a 5.07% CAGR through 2031.
- By country, Brazil held 55.20% of the revenue in 2025, while Peru is forecast to grow at a 5.31% CAGR through 2031.
Note: Market size and forecast figures in this report are generated using Mordor Intelligence’s proprietary estimation framework, updated with the latest available data and insights as of January 2026.
South America Container Terminal Operations Market Trends and Insights
Drivers Impact Analysis*
| Driver | (~) % Impact on CAGR Forecast | Geographic Relevance | Impact Timeline |
|---|---|---|---|
| Expansion of deep-water gateway capacity | +1.2% | Brazil, Chile, Peru | Medium term (2-4 years) |
| Asia-South America service upgrades and larger vessel calls | +0.9% | Peru, Chile, Brazil, Pacific and Atlantic corridors | Short term (≤ 2 years) |
| Public-private concession investment in terminal modernization | +0.8% | Brazil, Chile, Colombia, Peru | Medium term (2-4 years) |
| Cold-chain containerization of agribusiness exports | +0.7% | Brazil, Chile, Peru, Argentina | Short term (≤ 2 years) |
| Electrification improving equipment uptime and operating economics | +0.5% | Brazil, Chile, Peru | Long term (≥ 4 years) |
| Pacific-corridor cargo redistribution through Chancay and Callao | +0.6% | Peru, Chile, feeder network | Short term (≤ 2 years) |
| Source: Mordor Intelligence | |||
Expansion of Deep-Water Gateway Capacity
Deep-water expansion is allowing terminals to receive vessels that earlier required calls at hubs in Panama or Mexico, changing the commercial value of individual gateway locations across the South America container terminal operations market. Larger vessels require sufficient channel depth, berth strength, crane reach, yard space, and faster gate operations, because a delayed handover of high volumes can weaken the benefit of a direct call. Chile began an international bidding process for the San Antonio expansion in 2025 after the project cleared environmental review. The project is expected to provide 6 million TEUs of annual capacity, with construction planned to begin in 2027, and it would significantly increase Chile’s ability to receive larger container ships[1]"Chile Plans to Triple Port Capacity with Massive Expansion." UPI, May 29, 2026, https://www.upi.com/Top_News/World-News/2026/05/29/latam-Chile-triple-port-capacity/7921780071484. Brazil is also pursuing channel deepening at Paranaguá through a 25-year access-channel concession. These projects increase the value of terminals that can coordinate water access, equipment upgrades, and landside capacity within one operating plan, rather than treating berth work and cargo evacuation as separate investments.
Asia-South America Service Upgrades and Pacific-Corridor Cargo Redistribution
Chancay began commercial operations in June 2025 and changed the routing options available to Pacific coast cargo owners in the South America container terminal operations market. The port handled 200,000 TEUs in the first half of 2026 across mainline and feeder services connecting Asia, Central America, and the South American Pacific coast[2]"Chancay Registers 70.94% Growth in Container Movement in H1 2026." DataPortuaria, August 20, 2026, https://dataportuaria.com/en/peru/ports/chancay-registers-70-94-growth-in-container-movement-in-h1-2. Its direct connection to Shanghai reduces transit time to 23 days from a previous 35 to 40 days, giving cargo owners a shorter route for time-sensitive shipments. Feeder services connect Chancay with 4 key Chilean terminals and with northern Pacific ports, including Paita and Guayaquil. Shipping lines are deploying vessels with a capacity of nearly 13,100 TEUs on these routes, a scale that was not previously viable on this trade lane. Terminals without the necessary draft and crane capability may lose direct calls as larger vessels become more common, while Pacific gateways may attract Asia-bound cargo that would otherwise move through Atlantic coast ports.
Public-Private Concession Investment in Terminal Modernization
Concession programs are becoming a central source of terminal capital in the South America container terminal operations market. Governments are offering longer tenures and defined investment obligations to support projects with extended payback periods and to limit uncertainty over required capacity additions. Brazil has advanced auctions for container assets in Fortaleza and other locations through a framework overseen by ANTAQ. Colombia opened Puerto Antioquia for commercial operations in February 2026 after USD 774 million of private investment. The facility adds New Panamax-ready infrastructure and is located 350 kilometers closer to Colombia’s main production centers than established Caribbean coast terminals. Clearer concession obligations can make investment timing more predictable for operators, lenders, shipping lines, and cargo owners, particularly where a terminal requires coordinated spending on berths, yards, gates, and connecting infrastructure.
Cold-Chain Containerization and Equipment Electrification
Agribusiness exports are increasing demand for reefer plugs, cold storage, and related handling capacity across the South America container terminal operations market. Brazil’s maritime fruit exports reached 36,552 TEUs in the first half of 2026, rising 20.4% from the same period in 2025, and provisional full-year figures pointed to a new annual record[3]"Fruit Exports from Brazil Rise Across Air and Sea Freight." Freshplaza, H1 2026, https://www.freshplaza.com/latin-america/article/9869816/fruit-exports-from-brazil-rise-across-air-and-sea-freight. TCP expanded its reefer plug capacity to 5,268 units, supporting higher volumes of refrigerated exports and improving the terminal’s ability to handle cargo with controlled-temperature requirements. Emergent Cold LatAm added blast-freezing tunnels at San Antonio during June 2026, with the capacity to process more than 10,500 tons each year. Electrified equipment and remote operation can improve equipment availability while reducing local emissions, although these systems require operators to develop practical technical skills. These investments allow operators to serve refrigerated cargo while building operational capabilities needed for more automated yards, and reefer handling can improve the quality of terminal revenue because it requires specialized infrastructure and chargeable electricity.
Restraints Impact Analysis*
| Restraint | (~) % Impact on CAGR Forecast | Geographic Relevance | Impact Timeline |
|---|---|---|---|
| Road and rail bottlenecks beyond the terminal gate | -0.6% | Brazil, Argentina | Long term (≥ 4 years) |
| Uneven concession, tariff, and customs regimes | -0.4% | Cross-regional, most acute in Peru and Argentina | Medium term (2-4 years) |
| Climate exposure to drought, floods, and river-level volatility | -0.3% | Brazil, southern waterways, Argentina | Long term (≥ 4 years) |
| High retrofit cost and skills scarcity for automation | -0.3% | Brazil, Chile, Peru | Medium term (2-4 years) |
| Source: Mordor Intelligence | |||
Road, Rail, and Climate Constraints Beyond the Terminal Gate
Quay capacity does not translate into higher throughput when road, rail, and waterway links remain unreliable for the South America container terminal operations market. Southern Brazilian corridors continue to face delays that add drayage time and raise cargo dwell costs, offsetting gains from better vessel turnaround at the berth. The BR-280 connection serving the Sao Francisco do Sul and Itapoa complex remains unresolved after a long planning period. Rail investment also takes longer to complete than many terminal construction programs, creating a gap between port capacity and the freight network needed to use it. The Paraná-Paraguay waterway can face navigability disruptions from silting and seasonal low-water conditions, affecting inland cargo aggregation ahead of export. Droughts, floods, and river-level changes can therefore reduce the benefit of berth productivity improvements, because trucks, railcars, and barges still determine how quickly containers can enter or leave a terminal.
Uneven Concession Terms, Customs Rules, and Automation Readiness
Different concession terms, tariff rules, and customs processes create uncertainty for shipping lines planning regional rotations in the South America container terminal operations market. Exclusive-access provisions at Chancay have drawn scrutiny from competing users and carriers, especially where users question whether tariff levels are set through a neutral process. Argentina adds foreign-exchange and revenue-repatriation uncertainty for terminal operators charging in USD, weakening the case for non-essential capacity additions. Brazil has provided a more established framework for arbitration and investment obligations, although disputes can still take time to resolve before operators can commit capital. Automation projects also require capital, technical skills, and operating experience that many established terminals do not yet have at the needed scale. These conditions can delay investment decisions even where cargo demand and berth capacity justify an expansion, because lenders and operators need confidence in both contract terms and the workforce available to operate new systems safely.
*Our forecasts treat driver/restraint impacts as directional, not additive. The impact forecasts reflect baseline growth, mix effects, and variable interactions.
Segment Analysis
By Service: Stevedoring Leads Revenue While Transportation Expands
Stevedoring accounted for 43.50% of the South America container terminal operations market share in 2025. Vessel and quay services remain central because shipping alliances assess berth productivity, crane availability, berth windows, and reliability when selecting rotation ports. Operators continue to invest in cranes, berth infrastructure, and systems that support faster moves per hour, since each call must be completed within tightly managed shipping schedules. Cargo handling is the second-largest service area and includes yard management, stacking, storage, container release, and the movement of boxes between operating zones. Santos Brasil introduced 8 automated rubber-tired gantry cranes at Tecon Santos in 2025. The equipment is remotely operated and is expected to reduce CO2 emissions by 97% compared with the diesel equipment it replaced, while also removing the need for operators to climb into elevated crane cabs for each shift.
Transportation is expected to be the fastest-growing service segment during 2026-2031 with a CAGR of 4.81%. Terminal groups are expanding drayage, inland depot, and rail offerings to capture more value after containers leave the gate and to give cargo owners a more continuous service. These services can also reduce congestion by coordinating truck appointments, depot use, container positioning, and inland cargo flows before vehicles reach the terminal perimeter. Other services include customs support, cargo consolidation, inspection coordination, port agency work, and practical assistance that can reduce the number of separate logistics providers used by exporters. Exporters increasingly seek a more integrated logistics offer rather than managing several providers separately. ICTSI’s investment in the Rio-Minas and Rio-Suzano rail corridors shows how international operators are building inland logistics positions alongside terminal investments, rather than relying only on vessel-side handling revenue.



By Ownership Model: State-Owned Terminals Lead While PPPs Grow Faster
State-owned terminals accounted for 47.06% of the South America container terminal operations market size in 2025. This position reflects Brazil’s federal port network, Argentina’s public port authorities, and state management in parts of the Andean corridor, where public investment supports national trade and infrastructure priorities. Public ownership remains important where ports are treated as strategic assets that must maintain service continuity and cargo access. Private and independent facilities serve the rest of the sector, including carrier-owned terminals, standalone commercial operators, and facilities with different operating mandates. Their competitive position depends on concession security, traffic density, access to investment capital, and their ability to meet alliance requirements. Carrier acquisitions completed during 2025 have increased the importance of integrated ownership structures in major Brazilian terminals, raising concerns for independent operators that did not have a related carrier base.
Public-private partnerships are projected to grow at a 5.15% CAGR through 2031. The South America container terminal operations market size for PPP structures is supported by tenders that require private investment while keeping public oversight of strategic infrastructure. Brazil is running auctions for facilities in Fortaleza, Santana, Porto Alegre, and Natal, maintaining a pipeline that matches the long planning cycles used by international terminal groups. Mandatory investment obligations and ANTAQ oversight give investors clearer requirements for long-term business plans, including defined delivery expectations for capacity and infrastructure. Carrier-affiliated terminals may use handling rates to secure volume from related shipping networks and to support alliance commitments. Independent operators may therefore become more concentrated in secondary ports where automation investment is harder to fund, and throughput density may not justify the same equipment programs.
By Automation Level: Manual Operations Remain Largest While Fully Automated Sites Set Benchmarks
Manual operations held 72.82% of the South America container terminal operations market share in 2025 across the South America container terminal operations market. Most established terminals were designed before current automation requirements became standard, and their physical layouts often limit the use of a single technology model across the entire yard. Retrofitting yards requires investment that earlier concession contracts did not always anticipate and can disrupt operations at already busy facilities. It also requires technicians and operators who can manage automated equipment safely, maintain systems, and respond when equipment or operating conditions change. Semi-automated systems offer an intermediate path for terminals that need productivity gains without a full yard redesign. Porto Itapoa added a ship-to-shore crane during December 2025 and is installing remotely controlled, semi-autonomous rubber-tired gantry cranes, demonstrating an incremental approach to equipment modernization.
Fully automated terminals are projected to grow at a 6.33% CAGR through 2031. Greenfield sites can install automated stacking systems, remote-control rooms, electrified equipment, and appropriate power infrastructure from the initial design stage, avoiding some of the constraints faced by older sites. APM Terminals Suape in Pernambuco is expected to begin full commercial operations during the second half of 2026. The facility uses remotely operated, electrified equipment and has an initial capacity of 400,000 TEUs, providing a regional benchmark for fully electrified terminal design. Workforce training remains necessary because equipment deployment alone cannot deliver planned productivity or ensure that terminal systems are operated consistently. APM Terminals’ approach illustrates why labor development is being pursued alongside technology investment, particularly where the local technical ecosystem has limited experience with fully automated yards.
By Container Type: General Containers Lead While Reefer Cargo Grows Faster
General containers held 57.43% of the South America container terminal operations market size in 2025, representing the largest share of the South America container terminal operations market size. This traffic includes manufactured products, consumer goods, processed exports, and industrial cargo, and it supports established import routes from Asia and North America. It also supports regional export activity in processed goods and commodities, giving terminals a broad volume base across different trade cycles. OOG and project containers are linked to investment in extractive activities, wind projects, and infrastructure, which can generate uneven but important specialized demand. Brazil’s offshore oil and gas activity and Chile’s mining equipment trade provide recurring demand for these movements. Dangerous goods containers remain smaller but require more rigorous handling, safety procedures, inspection coordination, and compliance practices from port authorities and terminal operators.
Reefer containers are projected to grow at a 5.07% CAGR through 2031. Beef, poultry, fruit, seafood, and dairy exporters are shifting more cargo into standardized refrigerated containers as cold-chain logistics become available closer to production areas. At Paranagua, higher reefer plug capacity was followed by a 53% increase in beef-export volumes during 2025, showing the importance of adequate connections and storage facilities for perishable cargo. Refrigerated boxes generate handling, electricity, and storage income during their terminal dwell time, which can improve the value of each yard position used. Reefer-capable terminals can therefore improve revenue per yard area while supporting cargo that needs controlled temperatures and timely vessel connections. New containerized exports of avocados, specialty citrus, and tropical fruit also broaden the demand base beyond traditional refrigerated trade and reduce reliance on a narrow set of commodity flows.
Geography Analysis
Brazil held 55.20% of the South America container terminal operations market share in 2025 and remains the largest country within the South America container terminal operations market. Santos is the principal gateway and is receiving investment in cranes, automated yard systems, reefer capacity, and other equipment needed to handle larger volumes efficiently. Brazil’s national waterway and port network handled 15.3 million TEUs in 2025, a 10.2% increase from 2024, confirming the importance of its container flows to regional activity[4]"Brazil Waterway Cargo Volumes Reach 1.4 Billion Tonnes in 2025." Datamarnews, 2025, https://datamarnews.com/noticias/brazil-waterway-cargo-volumes-reach-1-4-billion-tonnes-in-2025. ANTAQ projects that total Brazilian port throughput will reach 1.44 billion tons by the end of 2026. Inland waterway shipping is expected to be the fastest-growing transport mode, although the modal network remains exposed to infrastructure constraints. Brazil’s established concession framework continues to attract international terminal groups, because it provides a more familiar setting for operators planning long-term capacity, equipment, and logistics investments.
Peru is forecast to grow at a 5.31% CAGR through 2031, the highest country rate in the region. Chancay processed 502,646 TEUs from its opening through May 2026, and its vessel-call frequency rose 44% in the January to May 2026 period compared with the same months of 2025. Its 23-day Shanghai connection is supporting cargo flows from Peru and nearby Pacific markets, while reducing dependence on longer transit routes through other hubs. DP World’s South Terminal at Callao handled more than 2 million TEUs in 2025, becoming the first Pacific coast terminal in South America to pass that annual threshold. In August 2026, DP World launched Latin America’s first operational shore-power system at Callao as part of a USD 105 million decarbonization program. Questions around Chancay’s concession terms and exclusive-access provisions remain relevant because regulatory disputes could slow adoption by users seeking a neutral Pacific gateway.
Chile remains the second-largest country market and has a major capacity project at San Antonio. The proposed expansion is expected to provide 6 million TEUs of annual handling capacity when completed, which would triple current capacity and strengthen Chile’s role in Pacific coast trade. Cold-chain investment near San Antonio supports fruit and seafood exports that require reefer services. Colombia began commercial operations at Puerto Antioquia in February 2026 with New Panamax-capable berths that improve access to the country’s interior production regions. Argentina continues to face macroeconomic pressure, although terminal modernization investment remains targeted. Ecuador, Uruguay, Paraguay, Bolivia, and Venezuela retain resource-export and transshipment-related flows, while Chancay’s feeder network is changing established routing patterns that previously relied more heavily on Callao, Guayaquil, and Buenaventura.
Competitive Landscape
The South America container terminal operations market is moderately consolidated among the largest assets. Global terminal groups and carrier-linked operators control important high-volume terminals, while domestic concessionaires and specialized operators remain active in mid-tier and regional ports. Carrier-led integration has become a defining feature of current ownership changes, affecting how major operators secure cargo, allocate capacity, and plan future investment. CMA CGM acquired a 51% controlling interest in Santos Brasil during April 2025. MSC completed its acquisition of a 68.4% stake in Wilson Sons during June 2025, adding terminal and tugboat assets to its regional position. These ownership changes increase the importance of relationships between carriers and terminal operators, while independent operators remain exposed to margin pressure when competing for the same high-volume cargo pools.
Technology investment is a second area of competition in the South America container terminal operations market. Remote crane control, automated rubber-tired gantries, electrified equipment, and shore power can influence shipping-line preferences by improving productivity and supporting lower-emission operations. Konecranes received an order for 14 electric rubber-tired gantry cranes from Portonave in Brazil, showing continued investment in lower-emission yard equipment. Mid-tier terminals may have sufficient cargo volumes for semi-automation but lack the concession tenure or cash-flow certainty needed to finance it on viable terms. This creates an opportunity for operators that can combine stable contracts, equipment finance, staff training, and customer commitments. Electrification can reduce operating costs and help terminals meet shipping-line requirements for lower-emission port calls, but it also requires power systems and practical operating capabilities.
Investment partnerships are also changing the competitive structure of the South America container terminal operations market. Stonepeak and CMA CGM completed the formation of UNITED PORTS LLC in July 2026, including assets in Santos. The transaction shows that infrastructure investors are participating alongside carriers in the region’s terminal sector and can provide further capital for capacity and technology upgrades. Large operators can combine capital resources with shipping relationships, global procurement, and longer planning horizons. Regional operators still compete through local customer knowledge, concession positions, specialized cargo capabilities, and service at secondary ports. The South America container terminal operations market therefore favors scale at major gateways while leaving space for focused operators in regional and cargo-specific terminals, especially where large integrated groups have not prioritized local trade flows.
South America Container Terminal Operations Industry Leaders
-
DP World Limited
-
APM Terminals B.V.
-
Mediterranean Shipping Company S.A.
-
CMA CGM Group
-
International Container Terminal Services, Inc. (ICTSI)
- *Disclaimer: Major Players sorted in no particular order

Recent Industry Developments
- August 2026: DP World launched Latin America's first shore power system at the Port of Callao, Peru, under a USD 105 million decarbonization program. The system supplies 7.50 MVA of renewable electricity to berthed vessels, is expected to avoid 6,300 tons of CO₂ equivalent annually, and is supported by 36 electric internal transfer vehicles and the region's first dedicated port EV charging station.
- June 2026: APM Terminals Suape in Pernambuco, Brazil, Latin America's first fully electrified container terminal, completed final equipment commissioning ahead of second-half 2026 operations. The terminal involved USD 47 million in electrified equipment within a USD 350 million total investment, delivering a 55% capacity increase and deploying 28 fully electrified Sany units operated remotely.
- June 2025: MSC completed its USD 790 million acquisition of a 68.39% controlling stake in Wilson Sons S.A. following ANTAQ approval, gaining control of Tecon Rio Grande and Tecon Salvador container terminals and a major Latin American tugboat fleet.
- April 2025: CMA CGM completed the acquisition of a 51% controlling stake in Santos Brasil Participacoes S.A., the operator of Tecon Santos, Brazil's largest container terminal, with a Port of Santos concession through 2047 and capacity of 2.50 million TEUs, expandable to 3.00 million.


South America Container Terminal Operations Market Report Scope
| Stevedoring |
| Cargo Handling |
| Transportation |
| Other Services |
| State-Owned |
| Public-Private Partnership |
| Private / Independent |
| Manual |
| Semi-Automated |
| Fully Automated |
| General Containers |
| Reefer Containers |
| OOG / Project Containers |
| Dangerous Goods Containers |
| Argentina |
| Brazil |
| Chile |
| Colombia |
| Peru |
| Rest of South America |
| By Service | Stevedoring |
| Cargo Handling | |
| Transportation | |
| Other Services | |
| By Ownership Model | State-Owned |
| Public-Private Partnership | |
| Private / Independent | |
| By Automation Level | Manual |
| Semi-Automated | |
| Fully Automated | |
| By Container Type | General Containers |
| Reefer Containers | |
| OOG / Project Containers | |
| Dangerous Goods Containers | |
| By Country | Argentina |
| Brazil | |
| Chile | |
| Colombia | |
| Peru | |
| Rest of South America |


Key Questions Answered in the Report
What is the projected growth rate for container terminal operations in South America?
The sector is projected to grow at a 4.42% CAGR from 2026 to 2031, reaching USD 5.66 billion by 2031.
Which country leads container terminal operations in South America?
Brazil led regional revenue with 55.20% in 2025, supported by Santos and a broad national port network.
Which service is growing fastest at South American container terminals?
Transportation is the fastest-growing service segment because operators are adding inland logistics, drayage, depots, and rail services.
Why are reefer containers important for terminal operators?
Reefer containers support growing agricultural exports and generate revenue from handling, storage, and electricity connections.
What is driving automation at container terminals?
Operators are adopting remote controls, electrified yard equipment, and semi-automated systems to improve productivity and equipment availability.
How concentrated is the South America container terminal operations market?
Global and carrier-linked groups control several leading gateways, while domestic operators remain active across regional and specialized terminals.
Page last updated on:





