
Market Overview
| Study Period | 2021 - 2031 |
|---|---|
| Forecast Data Period | 2026 - 2031 |
| Base Year Market Size (2025) | USD 27.89 Billion |
| Market Size (2026) | USD 29.93 Billion |
| Market Size (2031) | USD 42.56 Billion |
| Growth Rate (2026 - 2031) | 7.30 % |
| Market Concentration | Medium |
Major Players
*Disclaimer: Major Players sorted in no particular order Image © Mordor Intelligence. Reuse requires attribution under CC BY 4.0. |
|
South America Bottled Water Market Analysis by Mordor Intelligence
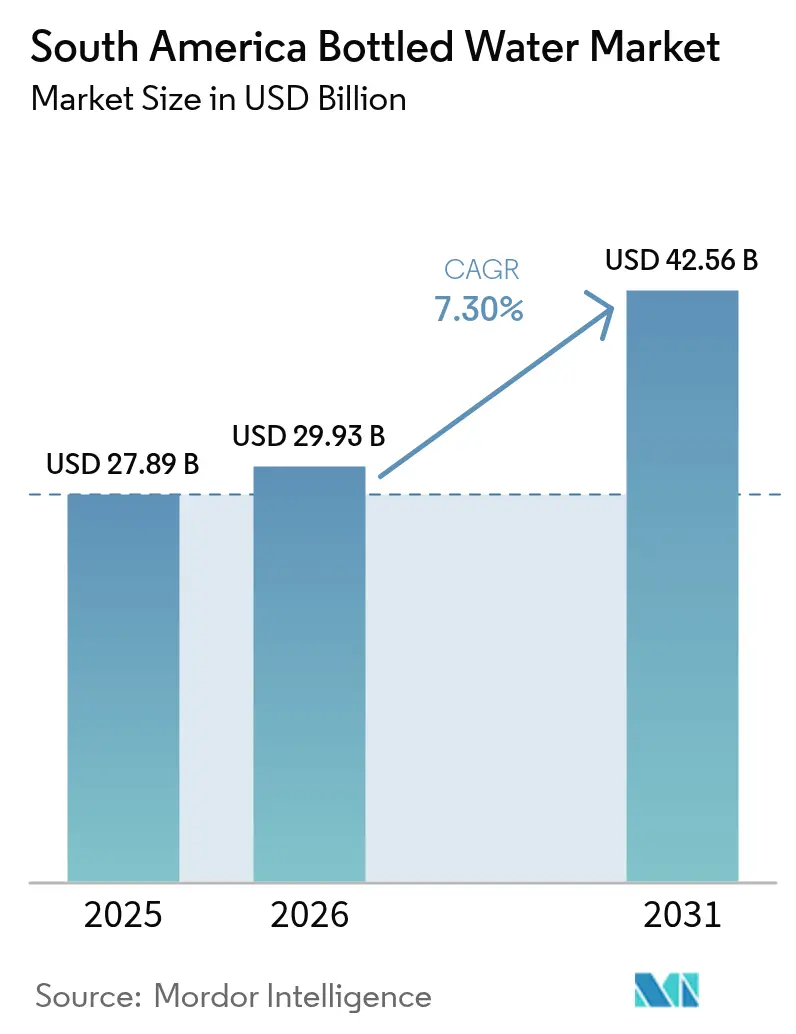
South America bottled water market size in 2026 is estimated at USD 29.93 billion, growing from 2025 value of USD 27.89 billion with 2031 projections showing USD 42.56 billion, growing at 7.3% CAGR over 2026-2031. This growth trajectory reflects the region's evolving consumer preferences toward premium hydration solutions and functional beverages, driven by rising health consciousness and expanding foodservice infrastructure. Moreover, bottled water demand in Brazil is showing significant growth, owing to that consumer inclination has shifted from soft drinks and alcoholic beverages to functional, flavored, and mineral water. Infrastructure investment in foodservice, tourism, and last-mile retail is widening cold-chain reach, while regulatory moves on recycled PET spur packaging upgrades that favor well-capitalized producers. Competitive intensity remains moderate as regional brands defend local loyalty even as multinationals push scale advantages. Sustainability credentials, direct-to-consumer models, and ingredient transparency are becoming decisive purchase criteria, especially in urban hubs where consumers scrutinize purity claims and carbon footprints.
Key Report Takeaways
- By product type, still bottled water led with 65.78% revenue share in 2025, whereas functional/flavored water is set to post the fastest 7.75% CAGR through 2031.
- By packaging format, PET bottles retained 81.05% share in 2025, yet aluminum cans are forecast to grow at 8.08% CAGR between 2026-2031.
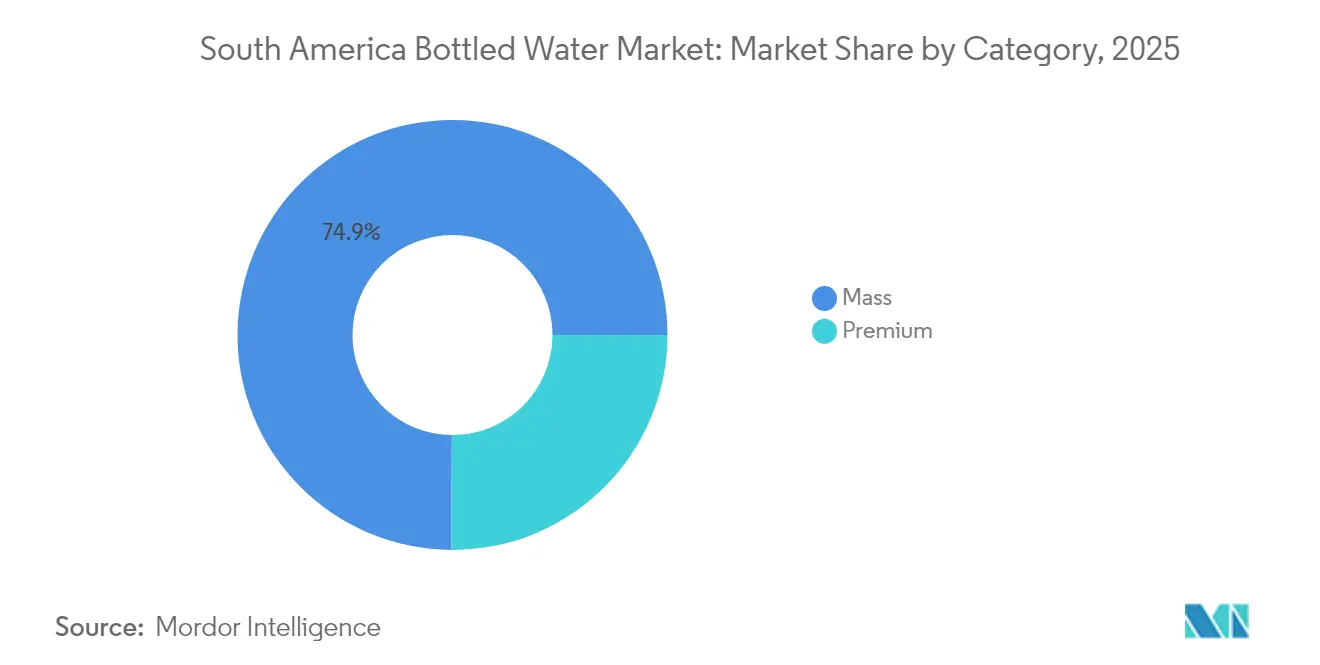
- By category, the mass segment captured 74.90% of 2025 sales, while the Premium tier is projected to expand at 8.52% CAGR through 2031.
- By distribution channel, off-trade outlets commanded 71.80% of 2025 revenues; on-trade recovery will accelerate at 7.55% CAGR to 2031.
- By geography, Brazil secured 56.30% of the South America bottled water market share in 2025 and Argentina will record the highest 9.08% CAGR through 2031.
Note: Market size and forecast figures in this report are generated using Mordor Intelligence’s proprietary estimation framework, updated with the latest available data and insights as of 2026.
Market Trends and Insights
Drivers Impact Analysis of South America Bottled Water Market*
| Driver | (~) % Impact on CAGR Forecast | Geographic Relevance | Impact Timeline |
|---|---|---|---|
| Rising Demand for Functional Water From Fitness Enthusiasts | +1.2% | Brazil, Argentina, Chile core markets | Medium term (2-4 years) |
| Consumer Perception Regarding Pure and Healthy Hydration Fueling Demand | +1.8% | Global, strongest in urban centers | Long term (≥ 4 years) |
| Expansion of Food Service Establishments | +1.1% | Brazil, Colombia, Argentina with tourism recovery | Short term (≤ 2 years) |
| Convenience and Portability Drives Demand | +1.5% | Peru, Colombia, secondary cities across region | Medium term (2-4 years) |
| Increased Awareness of Waterborne Diseases | +0.9% | Rural and peri-urban areas, strongest in Brazil and Peru | Long term (≥ 4 years) |
| Advertisements and Promotional Campaigns | +0.8% | Urban markets across all countries | Short term (≤ 2 years) |
| Source: Mordor Intelligence | |||
Rising Demand for Functional Water from Fitness Enthusiasts
Fitness and sports culture expansion across South America's urban centers is creating unprecedented demand for electrolyte-enhanced and vitamin-fortified water products. According to the Ministry of Tourism and Sports data from 2023, 55% of the respondents in Argentina participated in sports [1]Source: Ministry of Tourism and Sports, "Sports Participation in Argentina", argentina.gob.ar . Brazilian consumers increasingly view hydration as performance optimization rather than a basic necessity, driving premiumization trends that extend beyond traditional sports drinks into everyday consumption patterns. The demographic shift toward younger, health-conscious consumers willing to pay premium prices for perceived wellness benefits creates sustainable competitive advantages for brands investing in functional innovation. This consumer behavior shift fundamentally alters competitive dynamics, as traditional volume-based competition gives way to value-creation strategies focused on ingredient transparency and health positioning. The trend's sustainability is reinforced by rising disposable incomes in key urban markets and expanding wellness consciousness across the region.
Consumer Perception Regarding Pure and Healthy Hydration Fueling Demand
Health consciousness evolution in South America reflects broader global wellness trends, yet manifests uniquely through regional concerns about municipal water quality and industrial contamination. Consumer willingness to pay premium prices for perceived purity creates margin expansion opportunities for brands emphasizing source protection and advanced filtration technologies. The trend gains momentum from social media influence and health professional recommendations, particularly among educated urban demographics who view bottled water as preventive healthcare investment. Brazil's flavored water market reveals high trial rates among consumers, with novelty and health positioning driving initial adoption, though sustained growth requires demonstrable functional benefits beyond marketing claims. This perception shift enables premium positioning strategies that differentiate products through mineral content, pH levels, and source story narratives. The sustainability of this driver depends on maintaining consumer trust through transparent quality assurance and avoiding quality scandals that could undermine category credibility.
Expansion of Food Service Establishments
The post-pandemic recovery of the foodservice industry drives bottled water demand through on-trade channels, with consumption patterns showing significant growth as businesses resume normal operations. Regional tourism recovery in Argentina, Chile, and Colombia drives demand for branded water products in hospitality settings, where international visitors expect familiar quality standards. The reopening of restaurants, hotels, and entertainment venues increases consumption through these channels, reflecting broader economic recovery trends. The recovery enables premium positioning in hospitality settings, where water service quality aligns with establishment standards and customer expectations, particularly in fine dining and luxury hospitality segments. The foodservice industry's growth benefits glass bottles and premium packaging formats that enhance the dining experience, with establishments increasingly focusing on presentation and brand differentiation. The revival of regional tourism increases the demand for branded water products in hospitality venues, as international visitors seek familiar quality standards and premium offerings.
Convenience and Portability Drives Demand
Convenience and portability remain primary purchase motivators in South America’s bottled water market, especially among commuters and on-the-go urban professionals who favor lightweight single-serve packs that slip easily into bags and car cupholders. A trend is surging in São Paulo and Buenos Aires, of shoppers valuing grab-and-go hydration during public-transport commutes and gym sessions. Growing smartphone usage also drives impulse buying via delivery apps that promise chilled bottles within minutes, reinforcing the link between immediate availability and brand choice. Manufacturers respond by refining ergonomics—introducing ribbed grips, sports caps, and slim profiles—to enhance user experience while differentiating from bulk home-use gallons. As work-from-anywhere lifestyles blur boundaries between office, gym, and leisure settings, portability centric design is expected to support sustained volume growth across both mass and premium segments
Restraints Impact Analysis of South America Bottled Water Market*
| Restraint | (~) % Impact on CAGR Forecast | Geographic Relevance | Impact Timeline |
|---|---|---|---|
| Environmental Concerns and Plastic Waste | -1.4% | Brazil, Chile leading regulatory pressure | Medium term (2-4 years) |
| Strong Competition From Water Purifier Appliances | -0.9% | Urban Brazil, Argentina middle-class segments | Long term (≥ 4 years) |
| Misleading labels and concerns about nanoplastics restrict growth | -1.1% | Urban centers, educated demographics | Medium term (2-4 years) |
| High Cost Associated With Functional Water | -0.7% | Price-sensitive rural and lower-income segments | Short term (≤ 2 years) |
| Source: Mordor Intelligence | |||
Environmental Concerns and Plastic Waste
Regulatory pressure intensifies across South America as governments implement circular economy policies targeting single-use packaging, with Brazil's National Action Plan mandating 50% collection rates by 2040[2]Source: Brazilian NR, "Recycling food packaging", braziliannr.com. Consumer environmental consciousness creates market headwinds for traditional packaging formats while accelerating innovation in sustainable alternatives, including refillable systems and aluminum packaging. The constraint forces industry transformation toward circular business models, with Coca-Cola Latin America targeting 40% refillable bottles by 2030 through innovative QR code tracking systems. BlueTriton's aluminum bottle launch for water brands demonstrates industry adaptation to sustainability demands, though implementation costs create competitive disadvantages for smaller players lacking scale economies. The restraint's impact varies by company sustainability capabilities, with well-capitalized multinationals potentially gaining market share as regulatory compliance costs eliminate marginal competitors. Long-term market evolution favors companies investing in packaging innovation and circular economy infrastructure.
Strong Competition From Water Purifier Appliances
Home and office water purification technology advancement creates substitution pressure, particularly among middle-class consumers in urban Brazil and Argentina where infrastructure improvements reduce perceived bottled water necessity. The competitive threat intensifies as purification systems achieve cost parity with regular bottled water consumption while offering convenience and environmental benefits. Culligan Chile's expansion of customized hydration solutions with advanced purification technology demonstrates market evolution toward service-based alternatives that eliminate single-use packaging. The substitution effect varies by consumer segment, with premium bottled water categories maintaining differentiation through mineral content and taste profiles that purification systems cannot replicate. Market response strategies include emphasizing portability, convenience, and functional ingredients that home purification cannot provide. The restraint's long-term impact depends on purification technology costs and consumer behavior evolution toward sustainability preferences.
*Our forecasts treat driver/restraint impacts as directional, not additive. The impact forecasts reflect baseline growth, mix effects, and variable interactions.
South America Bottled Water Market Segment Analysis
By Product Type:
Functional Innovation Drives PremiumizationStill Bottled Water holds a 65.78% market share in 2025, supported by established consumer preferences and efficient distribution networks. The functional/flavored water segment is projected to grow at a 7.75% CAGR through 2031, demonstrating a market shift toward premium, value-added products. This growth reflects consumers' increasing willingness to pay more for products with health benefits, particularly those featuring electrolyte enhancement and vitamin fortification. Sparkling water continues to show consistent demand in urban markets, especially among younger consumers seeking alternatives to carbonated soft drinks.
The functional water segment continues to expand through product diversification and health-focused positioning. Manufacturers are developing specialized products targeting specific consumer needs, including post-workout recovery, immune support, and energy enhancement. The segment's continued growth relies on products with proven health benefits rather than marketing claims. While still water maintains its market leadership due to competitive pricing and established consumption habits, the market shows a gradual shift toward higher-value categories. Companies with strong product innovation capabilities and consumer insights are gaining competitive advantages over traditional volume-based business models.




By Packaging Format:
Sustainability Pressures Reshape Container PreferencesAluminum cans project an 8.08% CAGR through 2031, achieving the highest growth rate among packaging formats as consumers shift away from single-use plastic due to environmental concerns. PET bottles hold 81.05% market share in 2025, supported by cost advantages and established supply chains, but face growing regulatory constraints and resistance from environmentally conscious consumers. Glass bottles serve premium segments in foodservice and gift markets, though higher production costs restrict broader market adoption. These packaging trends align with the circular economy principles, transforming consumer goods industries across South America.
In April 2025, MERCOSUR's new recycled PET regulations increase operational costs, providing advantages to large manufacturers with established recycling capabilities while creating challenges for smaller regional producers . The aluminum can segment benefits from complete recyclability and premium market positioning, though higher material costs necessitate value-added product strategies to sustain profitability. PET bottles maintain market leadership through cost efficiency and widespread consumer acceptance, but require significant investment in recycling systems and recycled content integration for long-term viability. Companies that demonstrate packaging innovation and verifiable sustainability practices gain competitive advantages in serving environmentally aware consumers.
By Category:
Premium Segment Accelerates Despite Economic HeadwindsPremium bottled water is projected to grow at 8.52% CAGR through 2031, surpassing the Mass segment despite economic uncertainties and price sensitivity in South America. The Mass market segment maintains a dominant 74.90% share in 2025, driven by price-conscious consumers and established traditional retail distribution networks. The premium segment's acceleration reflects increasing consumer willingness to pay more for perceived quality, health benefits, and brand prestige, especially among urban consumers with higher disposable incomes. This shift toward premium products presents opportunities for margin expansion among companies that demonstrate strong brand positioning and product differentiation.
Consumer behavior study in Brazil reveals growing sophistication in hydration product evaluation, with factors beyond price including source story, mineral content, and packaging sustainability influencing purchase decisions. The premium segment benefits from functional water innovation and health positioning strategies that justify higher price points through perceived value creation. Mass market resilience reflects economic realities for large consumer segments, yet gradual income growth and urbanization trends support long-term premiumization. The competitive landscape increasingly rewards companies with portfolio strategies spanning both segments, enabling market share capture across diverse consumer price points while building brand equity for future premium migration.
By Distribution Channel:
On-Trade Recovery Drives Channel DiversificationOff-trade channels hold a 71.80% market share in 2025, supported by established retail networks and consumer preferences for convenient purchasing options. The on-trade segment is projected to grow at a 7.55% CAGR through 2031, supported by the recovery in foodservice and increased tourism activity. This growth difference shows a market shift toward experiential consumption, where water service is increasingly tied to establishment quality and guest expectations. Supermarkets and hypermarkets remain the primary off-trade channels due to consumer preferences for consolidated shopping and competitive pricing.
Online retail continues to expand through e-commerce platforms and direct-to-consumer models, particularly in premium and functional water segments where digital engagement drives customer retention. Convenience stores benefit from increasing urbanization and evolving consumer lifestyles that prioritize immediate consumption. Companies must adapt their strategies to address specific consumer requirements and price sensitivity across different retail formats. While the On-Trade channel offers higher profit margins during economic growth periods, its performance remains dependent on sustained economic and tourism growth, making it susceptible to economic fluctuations.
Geography Analysis
Brazil Bottled Water Market
Brazil dominates the market with a 56.30% share in 2025, supported by its large population and extensive distribution networks reaching both urban and rural areas. The market's maturity has shifted focus from volume growth to premium offerings. Major beverage companies have increased local production investments, developing flavors aligned with Brazilian preferences. The National Solid Waste Policy creates opportunities for circular economy initiatives, potentially benefiting companies with strong sustainability capabilities. Urban consumers' increasing health awareness and disposable income drive demand for functional and premium water products.
Argentina Bottled Water Market
Argentina shows the highest growth rate at 9.08% CAGR through 2031, supported by economic stabilization and infrastructure development. Multinational companies are expanding production capacity and enhancing distribution networks, indicating confidence in the market's long-term potential. The market expansion is supported by tourism recovery and increased middle-class consumption in urban areas. Distribution networks are improving through technology adoption, enhancing operational efficiency and customer service. However, sustained growth depends on economic stability and consistent policies supporting business investment.
Andean South America Bottled Water Market
Colombia, Chile, and Peru present growth opportunities driven by tourism recovery and urbanization. Chile's water infrastructure partnerships affect bottled water demand, with improved municipal systems potentially reducing necessity while economic growth supports premium product consumption. Peru's water quality issues in secondary cities maintain steady demand, creating opportunities for brands focused on purity and safety. Colombia's recovering foodservice sector drives On-Trade channel growth, particularly benefiting premium packaging formats. Success in these markets requires companies to balance local market adaptation with regional operational efficiency.
Regulatory Landscape
Bottled water regulation in South America is administered primarily through national health and sanitary authorities, which creates country-specific registration and compliance requirements that influence go-to-market strategies. In Brazil, ANVISA sets technical identity and quality requirements for packaged waters through Resolution RDC 274/2005 (covering categories such as natural mineral water and water with added salts), making local conformity assessment and labeling compliance central to commercialization.
Across other key markets, producers operate under parallel national frameworks rather than a single regional rulebook. Chile applies sanitary controls for packaged foods and beverages under its Food Sanitary Regulations (Supreme Decree No. 977), and potable-water quality baselines such as NCh409/1 shape quality expectations applied to packaged waters. In Paraguay, DINAVISA oversight includes sanitary product registration requirements (RSPA) for commercialization, which increases administrative and documentation burdens for multi-country portfolios.
Competitive Landscape
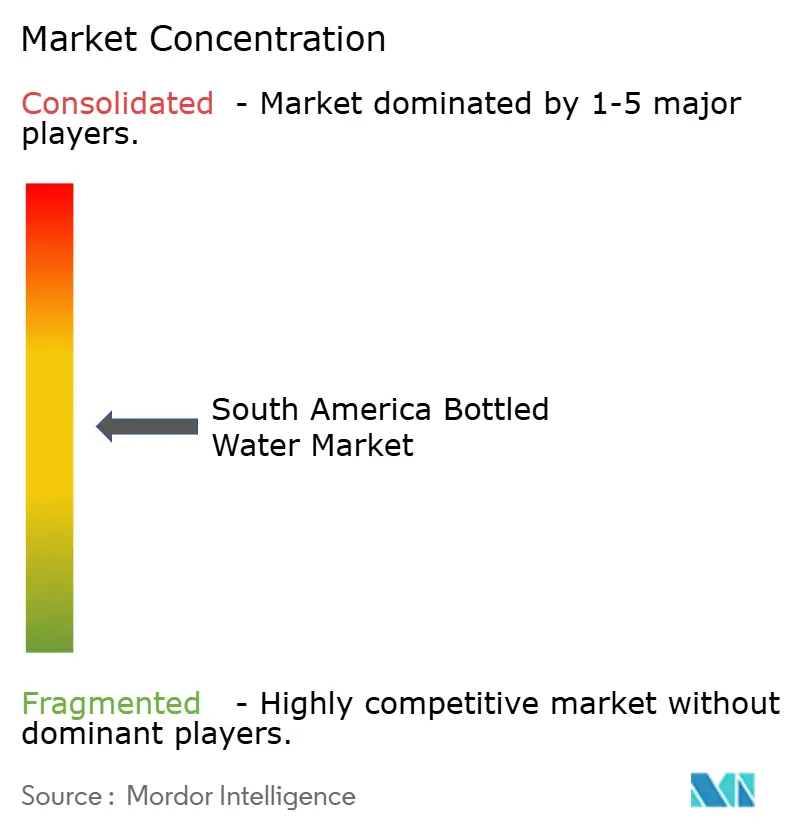
The South American bottled water market demonstrates moderate concentration. The market features established multinational companies operating alongside strong regional players, balancing the advantages of scale with local market expertise. Companies focus on vertical integration and sustainability investments while restructuring operations to improve efficiency and environmental performance. Regional brands maintain competitive positions through cultural alignment and distribution networks.
Strategic patterns emphasize vertical integration and sustainability investments, with major players like Coca-Cola and Nestlé restructuring operations to enhance efficiency and environmental credentials while regional brands leverage cultural connections and distribution expertise. Technology adoption accelerates through AI-powered supply chain optimization and digital consumer engagement platforms, exemplified by Arca Continental's investment in Argentine startup Sensify for intelligent cooling equipment management
New competitive threats emerge from circular economy business models and direct-to-consumer platforms that offer personalized hydration solutions outside traditional distribution channels. Private equity investment in bottled water companies indicates ongoing market consolidation through acquisitions and operational improvements. Companies with strong sustainability practices, innovation capabilities, and adaptable business models gain competitive advantages as consumer preferences and regulations evolve, moving beyond traditional scale-based competition.
South America Bottled Water Industry Leaders
-
The Coca-Cola Company
-
Minalba Brasil
-
PepsiCo Inc.
-
Danone S.A
-
Nestle S.A
- *Disclaimer: Major Players sorted in no particular order
South America Bottled Water Market Companies Covered in this Report
- The Coca-Cola Company
- Minalba Brasil
- PepsiCo Inc.
- Danone SA
- Nestle SA
- Grupo Edson Queiroz (Indaia)
- Ambev S.A. (AMA)
- AJE Group (Cielo)
- CCU S.A.
- Grupo Agua da Serra
- Socorro Bebidas
- Agua Mineral Ouro Fino
- Lindoya Verao
- Gota Water S.A.
- AJE Group
- Alpina Productos Alimenticios S.A
- Postobon S.A
- Socorro Bebidas
- Aguas Prata
- Togni SPA (Frasassi)

Market Opportunities and Future Outlook
Packaging and circular-economy compliance is opening opportunities for producers and converters to industrialize recycled content and expand alternative formats beyond PET. PET still accounts for 81.05% share in 2025, while cans have the fastest growth among packaging formats. The April 2025 MERCOSUR recycled PET requirements increase the operational bar for resin traceability, recycled-content sourcing, and quality assurance, which benefits firms with established recycling partnerships and capital for line modifications. At the same time, packaging suppliers that can deliver compliant rPET, lightweighting, and canning solutions can capture demand linked to these upgrades.
Capacity, cold availability, and returnable systems are also becoming practical investment levers for bottled water. This is reflected in disclosed bottler capex and distribution projects anchored to South American demand centers. In May 2025, Coca-Cola FEMSA and The Coca-Cola Company announced an investment of R$380 million to build a dedicated Crystal mineral water plant in Antonio Prado (Rio Grande do Sul), which supports localizing water output closer to consumption hubs and reduces logistics exposure. In 2026, investment programs by regional bottlers such as Embotelladora Andina and Coca-Cola Embonor emphasize returnable containers and refrigeration equipment, supporting a stronger premium on-trade execution and last-mile chilled availability, particularly for differentiated portfolios that include functional and flavored water where ingredient transparency and packaging credentials influence purchase decisions.
Recent Industry Developments in South America Bottled Water Market
- June 2026: Grupo Edson Queiroz announced an approximately R$1 billion investment program covering upgrades at Minalba Brasil, aimed at modernizing manufacturing plants and supporting portfolio expansion. The investment strengthens production and packaging capabilities for bottled water and other beverages, while raising the competitive bar for regional players that lack comparable modernization budgets.
- May 2025: Coca-Cola FEMSA and The Coca-Cola Company announced an investment of about R$380 million to establish a dedicated Crystal mineral water plant in Antonio Prado (Rio Grande do Sul), Brazil. A dedicated site focused on mineral water supports higher throughput and supply proximity in Southern Brazil, reinforcing scale advantages in a market where distribution reach and packaging compliance are becoming more decisive.
- November 2024: The Brazilian Association of Aluminum Can Manufacturers (Abralatas) partnered with the G20 to supply 100,000 units of mineral water in 350 ml aluminum cans for G20 meetings, using water sourced from Aguas de Lindoia (Sao Paulo). The program highlighted aluminum packaging as a circular-economy format for bottled water, reinforcing can-format visibility and supporting broader adoption beyond niche launches.


South America Bottled Water Market Report Scope and Research Methodology
Market Definition and Coverage
For this study, the market covers packaged drinking water sold in sealed containers across South America, including still, sparkling, and functional bottled water. The value is measured as sales revenue at prevailing prices across retail and foodservice routes.
Scope exclusions: We exclude home and office water dispenser services, bulk tanker supply, and in-home filtration or purifier equipment sales.
Segments Covered in This Report
-
By Product Type
- Still Bottled Water
- Sparkling Bottled Water
- Functional/Flavored Bottled Water
-
By Packaging Format
- PET Bottles
- Glass Bottles
- Cans
-
By Category
- Mass
- Premium
-
By Distribution Channel
- On-Trade
-
Off-Trade
- Supermarket/Hypermarket
- Convenience/Grocery Stores
- Online Retail Stores
- Others Distribution Channel
-
By Geography
- Brazil
- Argentina
- Colombia
- Rest of South America
Data Sources, Market Sizing, and Validation
Desk Research
Desk work starts by building the demand and pricing context for packaged water in South America, and then aligning it to how the category is tracked in trade and consumer datasets. We typically lean on public series such as national statistics offices for household spending, central bank inflation and FX tables, and customs trade data where bottled water lines can be isolated.
To ground assumptions, we review sources such as food and beverage trade associations, ministries of health or food safety agencies (labeling and bottled water rules), peer reviewed papers on hydration trends and packaging, and reputed press coverage on retail pricing and sustainability moves. We also scan company annual reports, investor presentations, and audited filings for volume and revenue cues, and we selectively use paid subscriptions for company financials, patent lookups, and shipment level import export checks when the public trail is thin. These desk sources are not exhaustive, and many other references are used to collect data, cross-check it, and clarify open questions.
Primary Interviews and Surveys
Interviews with bottlers, distributors, retailers, foodservice buyers, packaging specialists, and regulatory experts in South America clarify volume trends, package mix, channel margins, local price points, seasonality, and currency assumptions. Where desk sources conflict, analysts re-contact relevant experts in the region and use their input to adjust the model and final analysis.
Distribution of primary research fieldwork respondents
| Company type | Respondent position |
|---|---|
| Top tier: 28% | CXOs: 18% |
| Mid tier: 47% | Functional/Unit leaders: 32% |
| Smaller Players: 25% | Managers: 50% |
Market-Sizing & Forecasting
The market is sized using a top-down and bottom-up approach, where consumption and spending signals are built first and then checked against supplier side reality. In practice, we reconstruct a demand pool using indicators such as population by major markets, per capita bottled water consumption trends, retail price ladders by pack size, on-trade versus off-trade split, and premium share movement, and then we convert those into value totals by country and for South America overall.
Once the top-down picture is formed, the totals are corroborated using selective bottom-up approximations like sampled SKU price points multiplied by estimated volumes, channel checks on promotional intensity, and roll ups of reported category revenue cues from public filings. When gaps appear (for example, limited visibility on functional water in smaller markets), we use ranges agreed in interviews and apply conservative carryovers until better signals emerge.
For forecasting, scenario analysis is used so demand growth, inflation, and mix shifts can be stress-tested without making the model overly complex. Growth paths are then adjusted with country-level expectations shared by industry participants, particularly around pricing power, packaging cost pass-through, and the speed of premiumization in modern trade.
Data Validation & Update Cycle
Checks are run in layers so obvious math errors and quieter scope drifts are caught early. We compare model outputs with independent signals such as trade flows, price inflation series, and channel expansion markers, and then anomalies are reviewed by another analyst before sign-off.
The study is refreshed annually, and interim updates are triggered when major events materially shift pricing, currency conversion timing, or consumption behavior in the region. Before delivery, we do a final pass to ensure the newest public releases and any critical interview feedback are reflected in the numbers clients receive.
Mordor Intelligence's South America Bottled Water Market Estimate Compared With Other Published Estimates
Published values for this market can differ even when the topic sounds identical, since each publisher draws the boundary around geography, channels, and product definitions in their own way. Differences also show up when the latest inflation and FX movements are applied in different months, which then changes how local prices convert into a single USD number.
In addition, some estimates blend South America into a wider Latin America view or use a packaged water definition that is not consistent across still, sparkling, and functional variants. By keeping the ASP build updated to recent retail price ladders and converting currencies using a consistent timing window, followed by cross-checks against country consumption and channel mix signals, the refresh-led choices used by Mordor Intelligence can land at a different 2025 value than sources that rely on older price points or broader regional rollups.
Benchmark comparison
| Source | Market Size | Gaps in Research Methodology |
|---|---|---|
| Mordor Intelligence | USD 27.89 B (2025) | |
| Industry Publisher A | USD 14.86 B (2023) | Uses a Latin America scope and an earlier base year, so country coverage and the FX and inflation window differ, which typically compresses the USD value versus a refreshed South America-only view. |
| Market Tracker B | USD 36.42 B (2025) | Uses a packaged water framing for LATAM that can pull in adjacent categories and different channel assumptions, and the pricing ladder method is not clearly tied back to country-level validation checks. |
The spread across the three figures is mainly explained by geography boundaries, what is counted as packaged or bottled water, and how current prices are translated into USD at a given point in time. Our approach stays traceable because each step is tied to observable consumption, pricing, and channel signals, which makes it easier to revisit assumptions when the market shifts.


Key Questions Answered in the Report
What is the current value of the South America bottled water market?
The market is valued at USD 29.93 billion in 2026.
How fast is the South America bottled water market expected to grow?
It is projected to expand at a 7.3% CAGR, reaching USD 42.56 billion by 2031.
Which country holds the largest share of sales?
Brazil leads with 56.30% of total 2025 market share
What product category is expanding most quickly?
Functional and flavored water lines are growing at 7.75% CAGR as consumers seek added health benefits.
Page last updated on:





