
Market Overview
| Study Period | 2019 - 2031 |
|---|---|
| Forecast Data Period | 2026 - 2031 |
| Base Year Market Size (2025) | USD 0.47 Billion |
| Market Size (2026) | USD 0.51 Billion |
| Market Size (2031) | USD 0.76 Billion |
| Growth Rate (2026 - 2031) | 8.39 % |
| Market Concentration | Medium |
Major Players
*Disclaimer: Major Players sorted in no particular order Image © Mordor Intelligence. Reuse requires attribution under CC BY 4.0. |
|
South America Bike Sharing Market Analysis by Mordor Intelligence
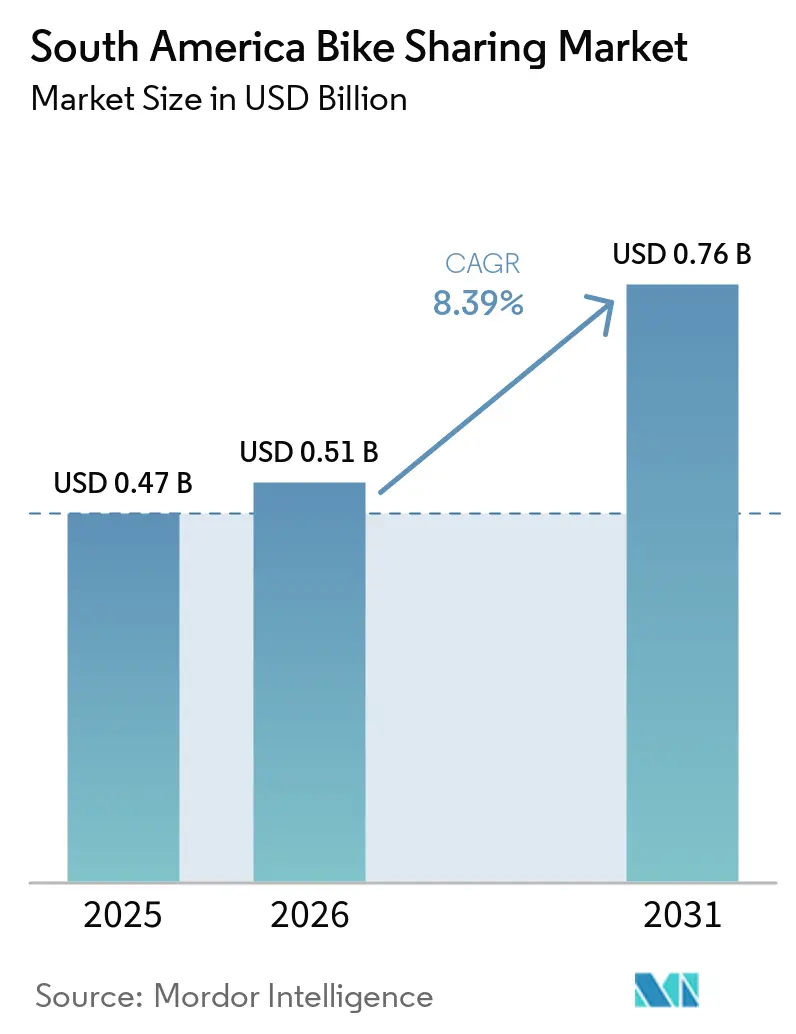
The South America bike sharing market size was valued at USD 0.47 billion in 2025 and is estimated to grow from USD 0.51 billion in 2026 to reach USD 0.76 billion by 2031, registering a CAGR of 8.39% during the forecast period (2026-2031). Urban congestion is supporting the use of shared bicycles for short trips that are difficult to complete by car or bus. Public authorities are also linking cycling networks with transit planning, which gives operators a clearer role in daily mobility. Long concession periods can help providers plan station investments, fleet renewal, and local maintenance capacity. Corporate subscriptions and delivery partnerships are adding recurring demand alongside public sponsorship and individual ride payments. The South America bike sharing market, therefore, depends on operating models that can serve commuters, delivery riders, and occasional users without losing control of fleet availability.
Key Report Takeaways
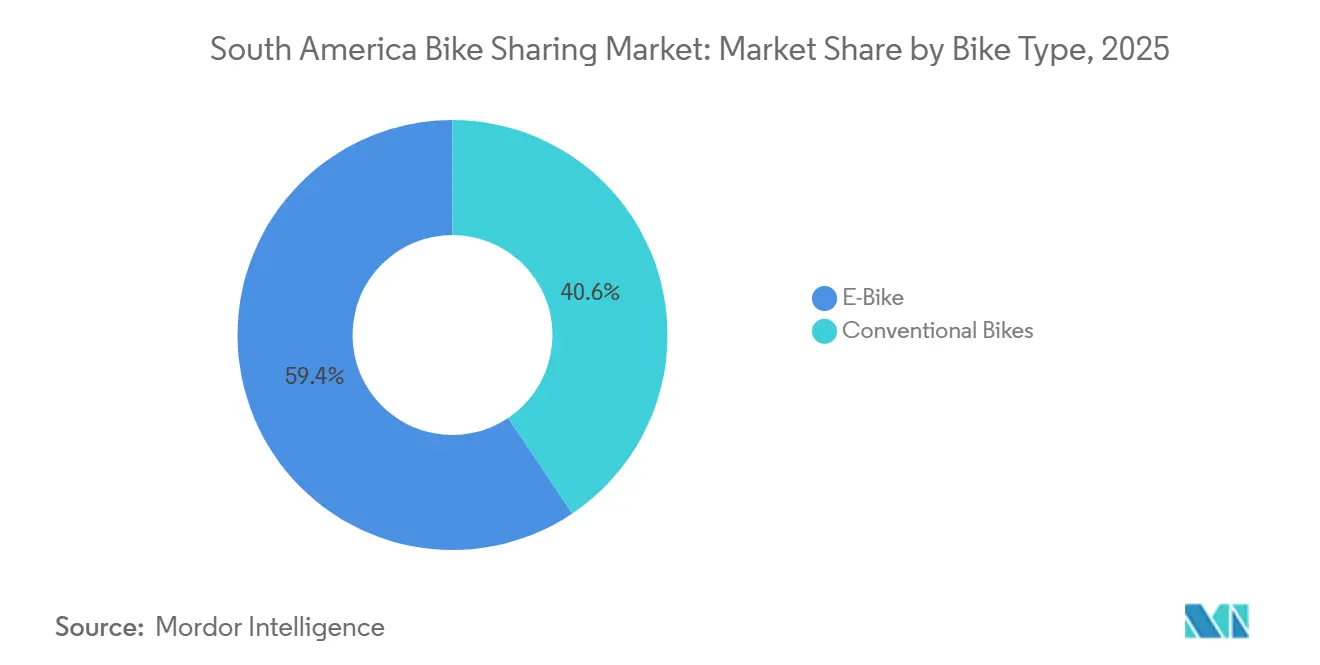
- By bike type, e-bikes held 59.41% of revenue in 2025 and are forecasted to expand at a 12.85% CAGR to 2031.
- By sharing system, docked systems accounted for 74.61% of revenue in 2025, while dockless systems are projected to record the fastest CAGR at 13.71% through 2031.
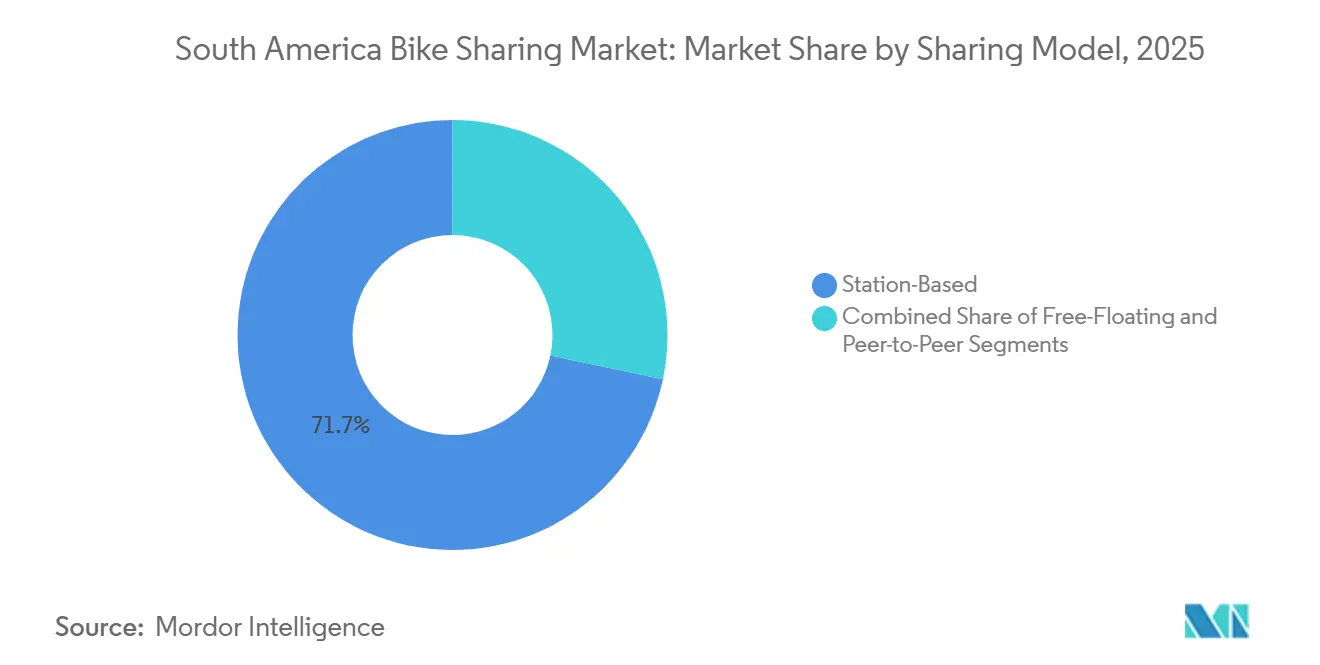
- By sharing model, station-based sharing held 71.71% of revenue in 2025, while free-floating sharing is projected to record the fastest projected CAGR at 15.42% through 2031.
- By duration, the source draft did not capture the largest segment share, while long-term sharing is projected to record the fastest CAGR at 11.59% through 2031.
- By customer type, urban commuters accounted for 63.51% of revenue in 2025, while delivery couriers are projected to record the fastest CAGR at 17.99% through 2031.
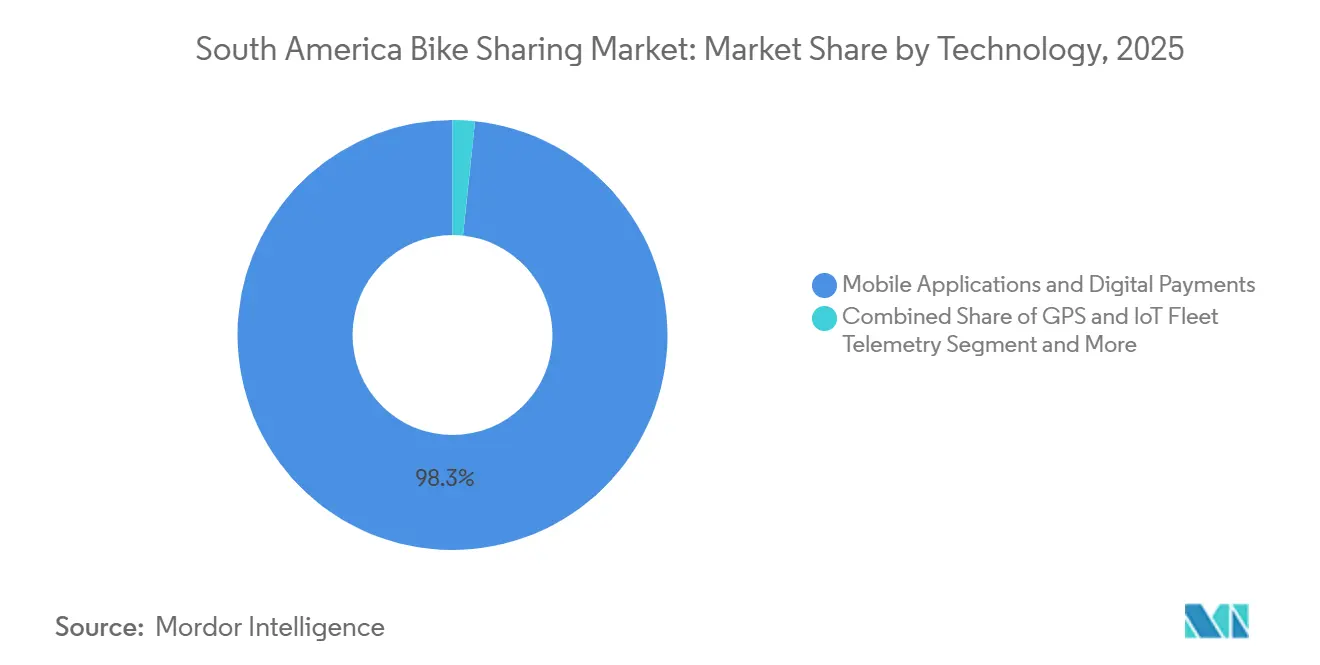
- By technology, mobile applications and digital payments accounted for 98.34% of revenue in 2025, while predictive rebalancing and fleet analytics are projected to record the fastest CAGR at 17.14% through 2031.
- By application, daily commuting held 61.46% of revenue in 2025, while delivery and commercial mobility are projected to record the fastest projected CAGR at 17.99% through 2031.
- By geography, Brazil held 56.34% of revenue in 2025 and is projected to be the fastest-growing country at a 15.51% CAGR.
Note: Market size and forecast figures in this report are generated using Mordor Intelligence’s proprietary estimation framework, updated with the latest available data and insights as of January 2026.
South America Bike Sharing Market Trends and Insights
E-Bike Fleet Electrification for Longer Urban Trips
E-bikes make longer urban trips more practical for riders who may not use a conventional bicycle. They can extend the useful travel range of a shared fleet beyond short recreational journeys. Tembici has an assembly facility in Manaus[1]"Deal Book Inclusive & Sustainable Growth," Global Private Capital Association (GPCA), globalprivatecapital.org, a local capability that can reduce exposure to imported equipment costs and currency movements. Charging at docking stations can reduce the need for separate battery collection and replacement work. This model favors operators that can fund and maintain reliable charging infrastructure across a dense network. It also gives municipalities a way to support lower-emission local travel without treating shared cycling only as a leisure service.
Public-Transport and First-/Last-Mile Integration
Bike sharing becomes more useful when riders can combine it with buses, metro services, or rail links. EnCicla is part of the integrated transport system in the Medellín metropolitan area, which situates shared bicycles within a broader public mobility offering. Connections near transit stops can help residents complete journeys that would otherwise require a longer walk or an additional trip by vehicle. They can also make cycling relevant in neighborhoods that are not directly served by high-capacity transit. The approach requires coordination over station placement, payment access, and service standards. Where that coordination is sustained, operators can build regular weekday use rather than relying mainly on weekend or tourism demand.
Municipal Funding and Public-Private Partnership Expansion
Municipal participation can reduce the uncertainty that has limited some earlier shared-bike programs. Public-private contracts may clarify responsibility for stations, public space, and maintenance standards. Long-term concessions can give operators time to spread infrastructure costs over a longer operating period. They can also encourage investment in local assembly, staff training, and fleet upgrades. Development finance support for Tembici illustrates how capital can be directed toward electric shared mobility and related operating capacity. The South America bike sharing market benefits when city policy and operator commitments are aligned, rather than when fleets are introduced without a durable service framework.
App-Based Access and Super-App Distribution
Digital access can make shared bicycles easier to find, unlock, and pay for during a routine journey. Distribution through established mobility and delivery applications can introduce the service to users who may not download a separate cycling application. Delivery riders also need dependable vehicles for repeated trips, which creates demand for e-bike fleet subscriptions. iFood has presented its Pedal program as part of a delivery decarbonization program that uses electric bicycles for couriers[2]"iFood to Deploy 45,000 E-Bikes in $56.3 Million Push," Startup Researcher, startupresearcher.com. Congested streets strengthen the case for a vehicle that can move through dense urban areas with less delay. Operators still need to protect their direct customer relationship when they use a partner platform for distribution.
Restraints Impact Analysis*
| Restraint | (~) % Impact on CAGR Forecast | Geographic Relevance | Impact Timeline |
|---|---|---|---|
| Theft, Vandalism and Fleet-Loss Exposure | -1.8% | Bogotá, Medellín, Rio de Janeiro, Recife | Short to medium term (≤ 4 years) |
| Weak Cycling Infrastructure Outside Core Corridors | -1.3% | Lima, Montevideo, secondary cities in Brazil and Colombia | Long term (≥ 4 years) |
| Fragmented Municipal Governance and Subsidy Dependence | -0.8% | Mid-sized cities in Brazil, Colombia, Peru | Medium to long term (2–4 years) |
| Uneven Payment Access and Low Willingness to Subscribe | -0.5% | Northern Brazil, Andean Peru, interior Colombia | Long term (≥ 4 years) |
| Source: Mordor Intelligence | |||
Theft, Vandalism and Fleet-Loss Exposure
Theft and vandalism can interrupt service even when demand for cycling is present. Damage to stations removes convenient pickup and return points, which can make a network less dependable for regular users. E-bike equipment can increase the replacement burden because stations also contain charging hardware. EnCicla has reported damage and theft issues within its system, showing why asset protection remains a practical operating concern. Clear responsibilities between city authorities and operators can support quicker repairs and better security measures. Without that support, a service can lose riders as station availability declines.
Weak Cycling Infrastructure Outside Core Corridors
Protected cycling routes remain uneven outside central corridors in many South American cities. Riders are less likely to use shared bicycles when their route requires mixing with fast vehicle traffic. This limits coverage in peripheral districts, even where residents could benefit from affordable local travel. Differences in municipal planning can also delay permits, station approvals, and subsidy decisions. Payment access and willingness to purchase subscriptions can vary across income groups and locations. The South America bike sharing market needs service models that match local infrastructure, governance capacity, and the ways residents pay for transport.
*Our forecasts treat driver/restraint impacts as directional, not additive. The impact forecasts reflect baseline growth, mix effects, and variable interactions.
Segment Analysis
By Bike Type: E-Bikes Support Broader Everyday Use
E-bikes held 59.41% of revenue in 2025, giving them the largest position in the bike-type mix. Their role reflects the need for a service that can support commuting and delivery work as well as shorter personal trips. Electric assistance can reduce the physical effort on hills, in heat, and over longer distances. This makes the fleet relevant to users who may not see a conventional bicycle as a practical transport option. The South America bike sharing market size for e-bikes is supported by operator investment in charging and maintenance systems. Local assembly can also help an operator manage procurement risk and keep spare parts closer to the operating network. Tembici’s manufacturing plans have been supported through development finance focused on urban electric bike sharing. The segment will depend on service reliability because a low battery level can undermine confidence in the product.
Conventional bicycles continue to serve short-distance trips, leisure use, and flat urban routes, leading to their 12.85% CAGR. They can be suitable where the cost of charging infrastructure cannot yet be justified. They also provide a simple entry option for municipalities introducing shared cycling for the first time. Operators may maintain a mixed fleet to serve different trip needs and price points. The 59.41% position held by e-bikes does not remove the need for conventional bicycles in tourist areas and smaller networks. A balanced fleet can help providers retain accessibility while they expand electric capacity. Battery safety, charging quality, and repair response will influence how quickly e-bikes become the main operating format. The South America bike sharing market can use this mix to match fleet design with street conditions and rider behavior.


By Sharing System: Docked Networks Remain the Core Format
Docked systems held 74.61% of revenue in 2025, while dockless systems are projected to grow at a 13.71% CAGR through 2031. Fixed stations provide a visible location for pickup, return, charging, and customer support. They can also help city authorities manage bicycle parking in crowded public areas. For e-bike fleets, a dock provides a practical place to recharge vehicles between trips. This strengthens the operating case for stations even as flexible return models become more available. Docked systems can produce useful data on where and when bicycles are returned. That information can help operators allocate staff, schedule repairs, and plan station capacity. The leading position of docked systems reflects the importance of controlled infrastructure in large urban concessions.
Dockless systems offer flexibility in areas where a dense station network is not affordable or necessary. They can be useful around university campuses, tourist districts, and emerging outer-city routes. Their faster growth rate reflects potential for targeted expansion rather than a replacement of docked networks. Cities may still require designated parking areas to prevent blocked sidewalks and poorly stored bicycles. Hybrid systems can combine flexible use with incentives to return a bicycle to a dock. This can give operators better control of fleet distribution while preserving some rider convenience. Security and charging needs will shape which system works best in each location. The South America bike sharing market is likely to retain more than one operating format as cities differ in density and public-space management.
By Sharing Model: Station-Based Services Retain a Strong Commercial Role
Station-based sharing held 71.71% of revenue in 2025, while free-floating sharing is projected to grow at a 15.42% CAGR through 2031. Station-based services fit naturally with municipal concessions that define service zones and operating standards. A physical station can carry sponsor branding and provide a recognizable presence in the street. This can support advertising and sponsorship income alongside rider payments. Banco Itaú's sponsorship of Bike Itaú shows how brand participation can support public-facing bike networks. The South America bike sharing market size linked to station-based services is therefore shaped by both mobility demand and the commercial value of station visibility. Operators can also use station data to track fleet condition and identify recurring demand locations. These features support structured agreements with city governments and corporate partners.
Free-floating systems can be easier to deploy where a city wants wider coverage with less permanent infrastructure. Their projected growth rate underscores their relevance in places with changing demand or less-developed station networks. However, the model requires effective rules for parking, charging, and retrieval. Poorly managed returns can create public-space concerns and increase operating costs. Peer-to-peer sharing remains more suitable for closed communities such as campuses and workplaces. Restricted user groups can reduce the risk of asset loss and improve accountability. The South America bike sharing market benefits when each sharing model is matched to local enforcement and street conditions. Providers that use different models carefully can serve more trip types without weakening daily operations.

By Sharing Duration: Longer Plans Improve Demand Visibility
Long-term sharing captured 56.34% share in 2025 and is projected to grow at an 11.59% CAGR through 2031, the fastest rate among duration formats. The source draft did not provide a revenue share for the largest duration segment. Longer plans can give operators more predictable use than individual rides purchased only when needed. They are particularly relevant for delivery riders who require a vehicle for repeated work shifts. Subscription plans can also support employee commuting programs offered by businesses. The South America bike sharing market has room for these arrangements because they reduce dependence on tourism and occasional leisure trips. They may also make it easier for riders to include bicycle costs in a regular household or work budget. Providers need clear maintenance terms because longer use places greater wear on each vehicle. Reliable access is essential if a subscription is to be seen as a practical transport service.
Short-term rentals remain important for visitors, casual riders, and people testing the service. They can introduce new users to bike sharing without asking for a longer commitment. Tourist locations may see higher use during events, holidays, and favorable weather. This demand can complement regular commuting use, but it can also vary across seasons. Long-term plans create steadier demand, while short-term access maintains openness and flexibility. Corporate subscriptions can add another layer of recurring use when employers support active travel. The South America bike sharing market can serve both needs by setting simple rules for duration, payment, and vehicle care. A varied duration offer can reduce reliance on one type of rider while keeping the service easy to understand.
By Customer Type: Delivery Couriers Create New Fleet Requirements
Urban commuters held 63.51% of revenue in 2025, while delivery couriers are projected to grow at a 17.99% CAGR through 2031. Commuters provide a dependable base for systems near employment centers, transit stations, and residential districts. They generally need a reliable bicycle for routine journeys at predictable times. Couriers have different needs because they ride more frequently and may carry goods throughout the day. Their growth is changing the specification of shared e-bikes, including durability, range, and comfort. The leading position of urban commuters remains central, but courier demand gives operators another source of regular use. Purpose-built delivery e-bikes can help providers serve this work more safely and efficiently. iFood’s electric bicycle program shows the role of delivery partnerships in supporting this use case.
Leisure and tourism riders can bring valuable demand to destination districts and coastal areas. Their trips often differ from commuter journeys in timing, route choice, and duration. Corporate and institutional users can provide stable contracts when employers support employee mobility. These agreements may take longer to establish, but they can give providers clearer demand visibility. Customer groups should not be treated as interchangeable because their fleet, pricing, and support needs differ. A commuter-focused network may not meet the practical needs of a courier who rides for a full work shift. The South America bike sharing market can serve a wider customer base when operators design products for distinct daily uses. This approach also reduces the risk of relying only on public subsidy or leisure demand.
By Technology: Analytics Move Beyond Basic Digital Access
Mobile applications and digital payments held 98.34% of technology-layer revenue in 2025, while predictive rebalancing and fleet analytics are projected to grow at a 17.14% CAGR through 2031. App-based access is now a basic expectation for many riders using shared mobility. It allows a user to locate a bicycle, start a trip, and pay without visiting a staffed location. Digital payments can also make membership and subscription plans easier to administer. The next operating challenge is not simply attracting app users, but maintaining fleet availability at the right locations. The South America bike sharing market size for analytics is tied to that operational need rather than to a separate consumer product. GPS, smart locks, and connected devices provide data that can improve repair response and fleet monitoring. They can also support faster action when a bicycle is moved outside its permitted area.
Predictive rebalancing can help operators anticipate where bicycles will be needed during the day. This may reduce the manual work required to move fleets between stations after peak travel periods. Better information can also support planning for charging, repairs, and station expansion. The technology should be used with practical local knowledge because travel patterns may change with weather, events, and road conditions. Mobile access will remain essential, but it is no longer the main point of difference between established providers. Operators that improve day-to-day fleet management may gain a stronger service advantage than those focused only on the customer interface. The South America bike sharing market needs dependable technology that works for field teams as well as riders. Strong operations can make digital tools meaningful in a way that a simple application alone cannot.
By Application: Commuting Remains Central as Commercial Use Expands
Daily commuting held 61.46% of revenue in 2025, while delivery and commercial mobility are projected to grow at a 17.99% CAGR through 2031. Commuting supports the everyday purpose of station networks in major cities. Riders use bicycles to connect homes, offices, education sites, and transit nodes. This makes station placement and early-morning availability especially important. First- and last-mile travel can strengthen the role of bike sharing where transit does not reach every destination. The prevalence of daily commuting underscores why operators must maintain routine reliability. Delivery and commercial use add a different pattern of demand that can continue throughout the day. These uses can help fleets generate value outside traditional commuter peaks.
Tourism and recreation remain relevant where visitors want a simple way to travel through central districts or waterfront areas. These trips can introduce new people to a city and to shared cycling services. Commercial use can diversify revenue, but it also places greater demands on fleet durability and service response. Operators need to avoid building a network that serves only a single activity or neighborhood. A balanced application mix can help a system remain useful across changing travel patterns. Transit integration is also important because it connects short bicycle trips with longer public journeys. The South America bike sharing market can grow through applications that reinforce each other rather than compete for the same limited fleet. City planning will determine whether these uses can expand safely beyond central corridors.
Geography Analysis
Brazil held 56.34% of regional revenue in 2025, giving it the leading South America bike sharing market share. Its cities combine large urban populations, regular congestion, and established public mobility systems. São Paulo, Rio de Janeiro, Recife, Salvador, Porto Alegre, Brasília, and Curitiba form important locations for station networks. Local operator experience and long municipal relationships can support continued fleet investment. Development finance for Tembici has supported urban electric bike-sharing capacity and related expansion plans. The country is also the fastest-growing market with a 15.51% CAGR. Brazil also has a growing link between e-bikes and app-based delivery work. This combination makes the country important for both commuter use and commercial fleet subscriptions. The national setting can favor providers with local maintenance, procurement, and operational experience.
Colombia and Chile provide distinct examples of how governance shapes service delivery. Medellín’s EnCicla is connected to the metropolitan public mobility system and is managed in a public service setting. Bogotá illustrates a private-concession environment in which an operator must directly manage service quality and fleet protection. Chile’s shared-bike networks show the value of coordination across more than one municipality. These countries demonstrate that a bike-sharing network can be supported through different funding and operating approaches. The choice between public operation and a private concession affects who carries maintenance and security risk. It also affects how quickly a service can make infrastructure decisions. A local approach is therefore more useful than a single regional model.
Argentina, Peru, Uruguay, and other South American countries have opportunities outside their largest city centers. Buenos Aires has an established public-access model that shows the role of municipal support in making bicycles available. Lima and Montevideo have operating programs but face limitations in cycling infrastructure and network coverage. Secondary cities may offer space for smaller systems designed around local travel patterns. These cities need a practical balance between capital investment, route safety, and expected rider demand. Expansion beyond central districts will depend on protected routes and better connections to transit. Operators may need to manage several smaller cities as a portfolio instead of relying on a single large system. This geography can reward flexible concession designs that are appropriate for local budgets and service needs.
Competitive Landscape
The South America bike sharing market is moderately concentrated because established operators hold key municipal concessions and have experience in station operations. Tembici, Serttel, EnCicla, Bike Itaú, and Moventia or CityBike Perú were identified in the source draft as leading participants. Their positions depend more on operating capability, public relationships, and infrastructure than on simple price competition. Tembici operates across several South American countries and has developed local capacity for electric bicycles. Development finance partners have described their support for Tembici’s expansion of urban electric bike sharing in the region DFC. Bike Itaú and Bike Santiago also demonstrate how sponsorship can support a public-facing mobility service. EnCicla differs because it operates within a metropolitan public-service framework. These varied structures mean that direct competition is shaped by each city’s procurement and governance model.
Leading providers are adapting their strategies to serve delivery riders and regular commuters at the same time. Tembici has paired its e-bike approach with regional expansion and local assembly capacity. iFood’s Pedal initiative is an example of a delivery partnership that connects electric bicycles with courier work. EnCicla has added electric bicycles with station charging in the Valle de Aburrá area. Serttel has focused on municipal relationships and services connected with urban technology. These moves show that operators are competing through fleet design, partnerships, and service delivery. The ability to maintain stations and respond to field issues remains as important as adding bicycles. Companies that can connect their systems with public transport and employer programs may have more stable demand.
Opportunities remain in secondary Brazilian cities, peripheral areas of Lima, and employer-supported mobility programs across the region. These locations may require smaller or more flexible services than the large fixed-station networks of capital cities. New entrants can focus on specialized delivery fleets rather than attempt to displace an established citywide concession. However, security risks, uneven bike lanes, and public-space rules can make expansion expensive. Operators with proven maintenance systems and local public-sector relationships have an advantage when cities seek dependable service. Corporate subscriptions can create an additional route to demand where municipal budgets are constrained. Competitive outcomes will depend on whether providers can keep fleets available while controlling repair and redistribution costs.
South America Bike Sharing Industry Leaders
-
CityBikeLima
-
EnCicla
-
Moventia
-
Serttel
-
Tembici
- *Disclaimer: Major Players sorted in no particular order


Recent Industry Developments
- June 2026: Tembici secured BRL 340 million (~USD65.6 million) in debt financing from BNDES to deploy 85,000 electric bikes for app-based delivery workers on platforms such as iFood.
- February 2026: Lyft Urban Solutions was awarded a contract by Guadalajara's AMIM to expand Mi Bici, introducing electric bikes and charging infrastructure to a previously pedal-only bikeshare system.


South America Bike Sharing Market Report Scope
The South America Bike Sharing market is segmented by bike type, sharing system, sharing model, sharing duration, customer type, technology, application, and country. By Bike Type, the market is segmented into Conventional Bikes and E-Bikes. By Sharing System, the market is segmented into Docked, Dockless, and Hybrid. By Sharing Model, the market is segmented into Station-Based, Free-Floating, and Peer-to-Peer. By Sharing Duration, the market is segmented into Short Term and Long Term. By Customer Type, the market is segmented into Urban Commuters, Delivery Couriers, Leisure and Tourism Riders, and Corporate and Institutional. By Technology, the market is segmented into GPS and IoT Fleet Telemetry, Smart Locks and QR Access, Mobile Applications and Platforms, and Predictive Rebalancing AI. By Application, the market is segmented into Daily Commuting, First- and Last-Mile Transit, Tourism and Recreation, and Delivery and Commercial. By Country, the market is segmented into Brazil, Argentina, Colombia, Peru, Chile, Uruguay, and Rest of South America. Market forecasts are provided in terms of Value (USD).
By Bike Type
| Conventional Bikes |
| E-Bikes |
By Sharing System
| Docked |
| Dockless |
| Hybrid |
By Sharing Model
| Station-Based |
| Free-Floating |
| Peer-to-Peer |
By Sharing Duration
| Short Term |
| Long Term |
By Customer Type
| Urban Commuters |
| Delivery Couriers |
| Leisure and Tourism Riders |
| Corporate and Institutional Users |
By Technology
| GPS and IoT Fleet Telemetry |
| Smart Locks and QR Access |
| Mobile Applications and Digital Payments |
| Predictive Rebalancing and Fleet Analytics |
By Application
| Daily Commuting |
| First- and Last-Mile Transit |
| Tourism and Recreation |
| Delivery and Commercial Mobility |
By Country
| Brazil |
| Argentina |
| Columbia |
| Peru |
| Chile |
| Uruguay |
| Rest of South America |
| By Bike Type | Conventional Bikes |
| E-Bikes | |
| By Sharing System | Docked |
| Dockless | |
| Hybrid | |
| By Sharing Model | Station-Based |
| Free-Floating | |
| Peer-to-Peer | |
| By Sharing Duration | Short Term |
| Long Term | |
| By Customer Type | Urban Commuters |
| Delivery Couriers | |
| Leisure and Tourism Riders | |
| Corporate and Institutional Users | |
| By Technology | GPS and IoT Fleet Telemetry |
| Smart Locks and QR Access | |
| Mobile Applications and Digital Payments | |
| Predictive Rebalancing and Fleet Analytics | |
| By Application | Daily Commuting |
| First- and Last-Mile Transit | |
| Tourism and Recreation | |
| Delivery and Commercial Mobility | |
| By Country | Brazil |
| Argentina | |
| Columbia | |
| Peru | |
| Chile | |
| Uruguay | |
| Rest of South America |


Key Questions Answered in the Report
What is driving demand for bike sharing in South America?
Congestion, transit connections, e-bike availability, and delivery use are supporting demand across major urban areas.
Which country leads bike sharing revenue in South America?
Brazil held 56.34% of regional revenue in 2025.
Why are e-bikes important for shared mobility services?
E-bikes make longer and more demanding urban trips practical, which supports commuting and delivery use.
What is the main challenge for bike sharing operators?
Theft, vandalism, weak cycling routes, and uneven local governance can limit service reliability and expansion.
Page last updated on:





