South America Automotive LED Lighting Market Size and Share
Market Overview
| Study Period | 2020 - 2031 |
|---|---|
| Forecast Data Period | 2026 - 2031 |
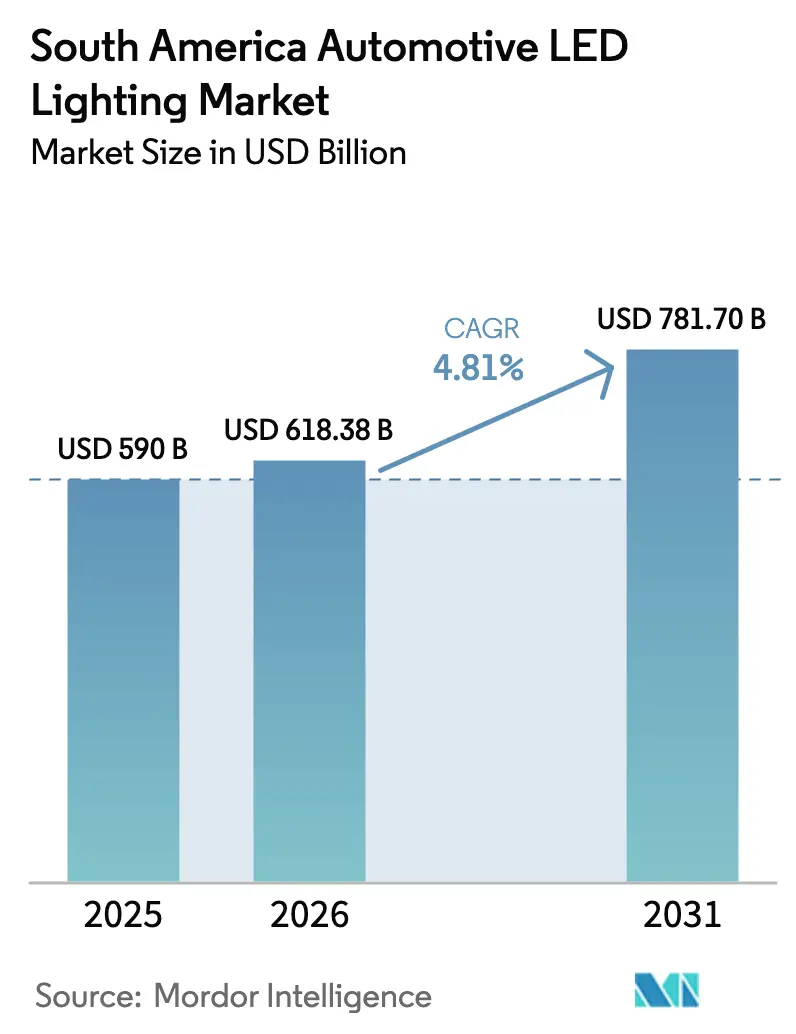
| Base Year Market Size (2025) | USD 590 Billion |
| Market Size (2026) | USD 618.38 Billion |
| Market Size (2031) | USD 781.7 Billion |
| Growth Rate (2026 - 2031) | 4.81% CAGR |
| Market Concentration | High |
Major Players *Disclaimer: Major Players sorted in no particular order Image © Mordor Intelligence. Reuse requires attribution under CC BY 4.0. | |
South America Automotive LED Lighting Market Analysis by Mordor Intelligence
The South America automotive LED lighting market size was valued at USD 590 million in 2025 and estimated to grow from USD 618.38 million in 2026 to reach USD 781.7 million by 2031, at a CAGR of 4.81% during the forecast period (2026-2031). Regulatory pushes for daytime running lights, falling LED package prices, and OEM electrification roadmaps are the primary engines behind this steady expansion. Vehicle makers now bundle full-LED headlamps as standard across new trims, while cost‐optimized retrofit kits unlock untapped demand from the region’s aging fleet. Supply-chain shocks that began in 2023 have not yet fully eased, yet local content programs in Brazil and Argentina have cushioned the impact by encouraging regional sourcing. Competitive intensity remains moderate; European technology providers still influence optical design standards, but rising Chinese imports have altered pricing dynamics and accelerated innovation cycles.
Key Report Takeaways
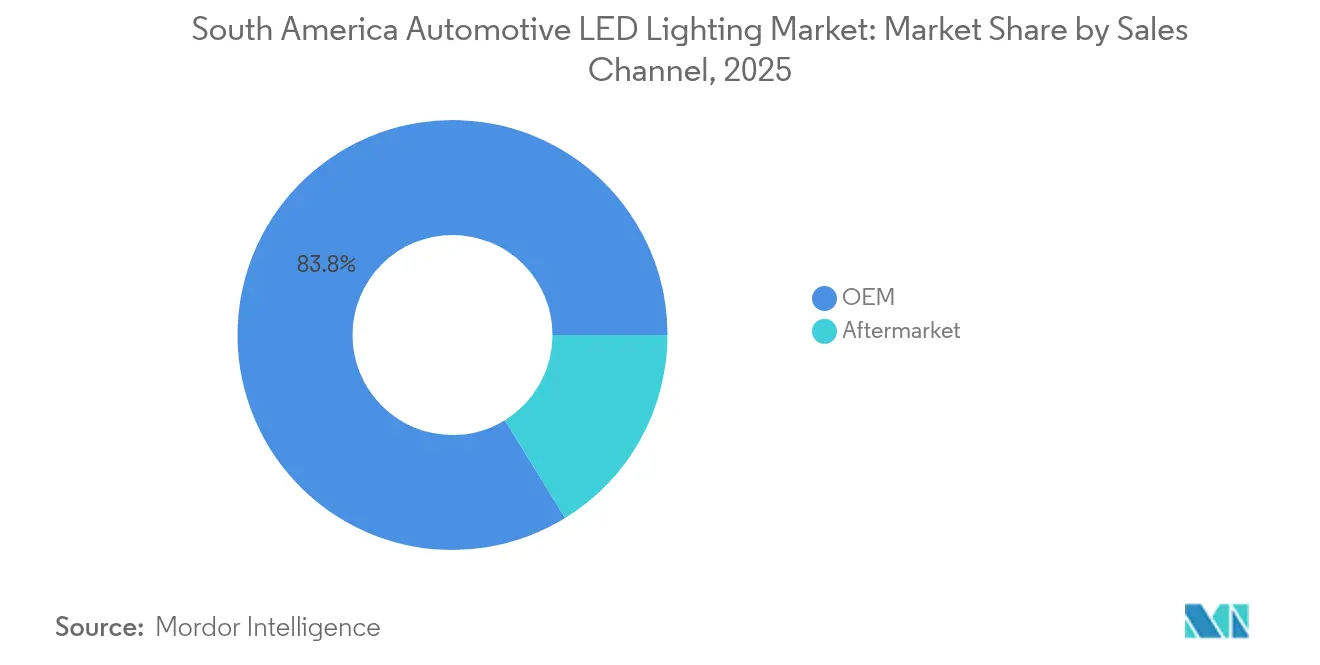
- By sales channel, the OEM segment accounted for 83.78% of the South America automotive LED lighting market size in 2025, while the aftermarket is projected to grow at a 5.16% annual rate through 2031.
- By vehicle type, passenger cars captured a 65.74% revenue share of the South America automotive LED lighting market size in 2025 and are expected to advance at a 7.41% CAGR to 2031.
- By application, exterior lighting led with 76.02% revenue share in 2025; interior lighting is expected to expand at a 5.76% CAGR through 2031.
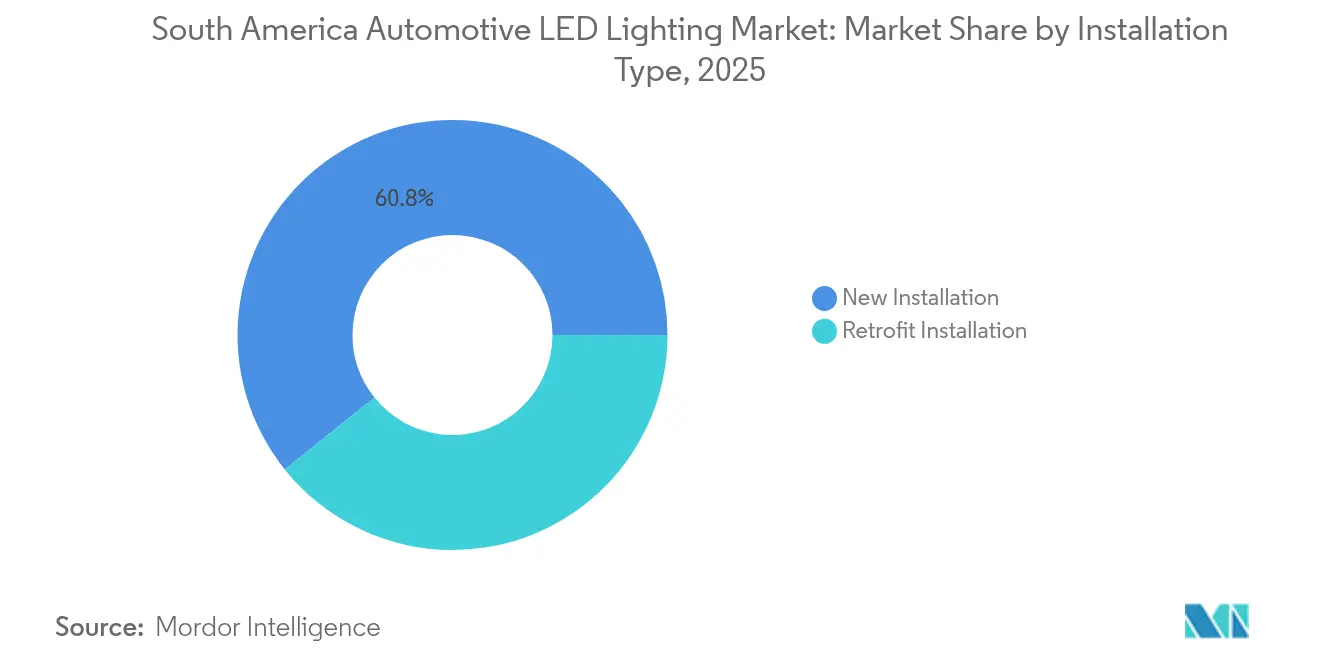
- By installation type, new installations commanded 60.75% share of the South America automotive LED lighting market size in 2025, whereas retrofit is forecast to post the fastest 5.62% CAGR to 2031.
- By country, Brazil controlled 35.52% of the South America automotive LED lighting market share in 2025; Colombia is projected to record the fastest 8.47% CAGR through 2031.
Note: Market size and forecast figures in this report are generated using Mordor Intelligence’s proprietary estimation framework, updated with the latest available data and insights as of 2026.
South America Automotive LED Lighting Market Trends and Insights
Drivers Impact Analysis*
| Driver | (~) % Impact on CAGR Forecast | Geographic Relevance | Impact Timeline |
|---|---|---|---|
| Rapid OEM shift toward full-LED headlamp modules | +1.2% | Brazil, Argentina, Chile | Medium term (2-4 years) |
| Falling LED package prices lowering ASP of lighting systems | +0.8% | Global, strongest in Brazil and Colombia | Short term (≤ 2 years) |
| Strict UNECE and Mercosur safety regulations mandating DRLs | +1.0% | Regional, with early adoption in Brazil, Chile | Medium term (2-4 years) |
| Vehicle electrification boosting demand for low-power lighting | +0.9% | Brazil, Colombia, Argentina | Long term (≥ 4 years) |
| Local content incentives in Brazil and Argentina | +0.6% | Brazil, Argentina, spillover to Paraguay | Medium term (2-4 years) |
| Emergence of flexible micro-LED arrays for styling | +0.5% | Brazil, Chile, premium segments regionally | Long term (≥ 4 years) |
| Source: Mordor Intelligence | |||


Rapid OEM shift toward full-LED headlamp modules
Automakers across South America migrated from halogen to full-LED headlamps after UNECE R112 and R113 benchmarks became compulsory. The modules offer lower warranty outlay, survive harsher tropical temperatures, and bundle adaptive features, thereby shrinking the bill of materials by consolidating multiple bulbs into a single sealed unit. Suppliers such as Marelli are now integrating microLED projectors and advanced heat sinks that can tolerate cabin temperatures above 35 °C, capturing incremental design wins in upcoming Brazilian vehicle launches. This reshapes the value chain because fewer, higher-value assemblies replace dozens of low-margin bulbs once sourced through distributors.
Falling LED package prices lowering ASP of lighting systems
Average packaged-LED costs declined roughly 15% annually through 2024, letting automakers specify LED headlamps for entry models once limited to halogen units. [1]Technical Paper 2024-28-0060, SAE International, sae.orgThe aftermarket feels the benefit even more, with road-approved retrofits like Philips Ultinon Pro6000 undercutting legacy xenon kits while delivering triple the luminous flux. [2]Philips 2024-25 Automotive Catalog, Philips, philips.com Regional import tariffs on driver ICs offset some of the savings, but local assembly partnerships in Brazil still achieve single-digit margins, thanks to government R&D credits.
Strict UNECE and Mercosur safety regulations mandating DRLs
Brazil’s CONTRAN Resolution 780/2020 solidified UNECE R87 daytime running light standards, eliminating compliance mismatches that had previously plagued cross-border shipments. OEM engineering groups now homologate a single LED platform for Argentina, Chile, and Brazil, reducing testing overhead and accelerating model refresh cycles. European lighting brands with mature certification workflows enjoyed an early-mover advantage; however, their Chinese peers have quickly established local test labs to gain parity.
Vehicle electrification boosting demand for low-power lighting
Pure-electric and hybrid models rely heavily on efficient lighting to preserve battery range. BYD retained roughly 70% of Brazil’s EV sales in 2024, catalyzing orders for ultra-low-power LEDs with CAN-bus diagnostics. Suppliers experiment with high-lumen blue-laser diodes coated with YAG phosphor, promising greater flux within existing thermal envelopes, vital for EVs that lack engine-bay airflow.
Restraints Impact Analysis*
| Restraint | (~) % Impact on CAGR Forecast | Geographic Relevance | Impact Timeline |
|---|---|---|---|
| Persistent supply-chain fragility post-pandemic | -0.6% | Regional, strongest impact in Argentina and Peru | Short term (≤ 2 years) |
| High import tariffs on advanced LED driver ICs | -0.4% | Brazil, Argentina, with spillover effects regionally | Medium term (2-4 years) |
| Thermal-management issues in tropical climates | -0.3% | Northern Brazil, Colombia, Venezuela border regions | Medium term (2-4 years) |
| Limited two-wheeler LED adoption outside Brazil | -0.2% | Argentina, Chile, Peru, Rest of South America | Long term (≥ 4 years) |
| Source: Mordor Intelligence | |||
Persistent supply-chain fragility post-pandemic
Semiconductor shortages and shipping bottlenecks continue to disrupt delivery of LED driver ICs sourced mainly from East Asia. Argentinian assemblers report lead times exceeding 30 weeks, forcing costly airfreight on critical items. OEMs respond by dual-sourcing and stockpiling safety components, but smaller aftermarket brands lack the capital buffer, delaying product launches and constraining channel inventory.
High import tariffs on advanced LED driver ICs
Tariffs between 14% and 20% increase the cost of materials for adaptive lighting systems. Local driver-IC fabrication remains unfeasible due to wafer-scale investment hurdles, so suppliers redesign boards to utilize fewer, general-purpose microcontrollers where possible. Even so, some adaptive cornering functions get dropped in lower-priced trims to keep sticker prices palatable.
*Our forecasts treat driver/restraint impacts as directional, not additive. The impact forecasts reflect baseline growth, mix effects, and variable interactions.
Segment Analysis
By Sales Channel: OEM Integration Dominates, Retrofit Picks Up Pace
OEM programs accounted for 83.78% of the South America automotive LED lighting market in revenue terms during 2025, underscoring how deeply lighting is baked into platform engineering and homologation. Tight safety regulations and long warranty cycles make factory-fit modules the default choice. BMW’s USD 200 million expansion of its Santa Catarina facility ensures long-term demand for integrated LED headlamps, signaling manufacturers’ plans to localize electronics within Brazil for cost and compliance reasons.
The aftermarket is smaller but growing at 5.16% CAGR. Fleet owners retrofit older trucks to extend uptime and reduce labor hours associated with bulb replacement. Retail chains in São Paulo are reporting double-digit sales growth of plug-and-play DRL inserts, which are compatible with common halogen sockets. To serve cost-sensitive buyers, distributors bundle wiring harnesses, resistors, and compliance labels, simplifying do-it-yourself installs. As vehicles age in circulation reach 13 years on average, retrofitting remains a lucrative niche, especially in secondary cities where used imports from the United States dominate.
Regional content rules influence both channels differently. OEM contracts stipulate 50% domestic value, steering suppliers toward local thermal-pad molding and PCB population. Conversely, aftermarket kits exploit tariff loopholes by shipping semi-knocked-down parts for final assembly in free-trade zones.


By Vehicle Type: Passenger Cars Command Growth Trajectory
Passenger cars captured 65.74% of overall revenue in 2025 and are heading for a 7.41% CAGR through 2031. The segment benefits from electrification incentives and aesthetic preferences for signature lighting. Chinese newcomers, such as BYD and Great Wall, upgrade base trims with full-LED clusters, pressuring incumbents to match their specifications. The South America automotive LED lighting market size tied to passenger cars is expected to hit USD 0.61 billion by 2031, reflecting both higher unit volumes and richer content per vehicle.
Light commercial vehicles lag but still convert halogen to LED for head-up fleets in Brazil’s e-commerce logistics boom. Owners of vans appreciate the lower power draw that reduces alternator load, thereby preserving fuel. Heavy trucks adopt adaptive lamps at a slower pace; high ASPs and longer replacement cycles restrain penetration. Two-wheeler adoption outside Brazil remains marginal because lower-cost motorcycles dominate the streets of Peru and Chile, and their owners prioritize mechanical upkeep over electronics.
Electrification acts as a cross-cutting catalyst. Great Wall’s Iracemápolis plant targets 60% local content, creating a pull for domestic lens manufacturers and board assemblers who can supply multiple car platforms with modular lamp carriers. This localization cycle reduces lead times and positions Brazil as an export base for neighboring countries once supply-chain reliability returns.
By Installation Type: New Builds Lead but Retrofit Accelerates
Factory installations represented 60.75% of spending in 2025. Engineers prefer purpose-designed LED units that integrate seamlessly with vehicle CAN networks, adaptive cruise sensors, and aesthetic guidelines. They embed heat spreaders sized for tight engine-bay constraints, a feature that retrofits cannot replicate.
Retrofit nonetheless posts a faster 5.62% CAGR. Taxi cooperatives in Bogotá commission bulk upgrades to LED tail lights to reduce maintenance trips. Regulations have evolved; Colombia now recognizes UNECE-certified aftermarket lamps, easing enforcement fears. Philips gray-market imports once dominated shelves, but local brands now rebadge Asian die-casts and add Spanish manuals to comply with consumer protection laws. The South America automotive LED lighting market size attributed to retrofits could surpass USD 0.32 billion by 2031 if tariff exemptions on knock-down kits persist.
The two channels converge technologically. Covestro’s flexible light-sheet seamlessly transitions between ambient roof lighting and cabin heating, serving both plant-installed premium sedans and aftermarket camper-van conversions, hinting at future cross-pollination where a single module meets diverse installation scenarios.
By Application: Exterior Still Dominant, Interior Races Ahead
Exterior functions, including headlamps, tails, DRLs, and turn indicators, commanded 76.02% of 2025 turnover, underscoring safety mandates that leave no room for compromise. Homologation costs keep barriers to entry high, so Tier-1 suppliers leverage existing optical tooling across multiple OEMs to amortize investment. The South America automotive LED lighting market share of exterior products is unlikely to dip below 70% this decade.
Interior lighting, currently accounting for 23.98% of revenue, is growing at a 5.76% CAGR. The cockpit becomes a brand playground: color-tunable strips sync with drive modes, while infotainment units dim foot-well LEDs during night navigation. ECARXperience’s generative HMI enables occupants to create personalized color schemes, increasing content per vehicle and driving demand for addressable RGB LEDs.
Interior modules skip complex photometric tests, speeding design cycles. Start-ups, therefore, rush to supply plug-and-play PCBs featuring capacitive touch, easing assembly inside door cards. As ride-sharing expands, fleet operators are retrofitting ambient lighting to enhance perceived value, aligning revenue models with subscription-based cabin personalization packages.
Geography Analysis
Brazil remains the anchor market, accounting for a 35.52% revenue share in 2025, thanks to an integrated OEM-tier supply chain that has been nurtured over 40 years. Incentive frameworks, such as MOVER and Nova Indústria Brasil, steer suppliers to localize LED housings, lenses, and wiring, thereby buffering currency volatility and logistics delays. Stellantis will channel USD 2.74 billion into its Betim hub through 2030, ensuring steady lamp demand across Jeep and Fiat lines.
Colombia, albeit smaller today, is the clear growth champion at a projected 8.47% CAGR through 2031. Roughly 600 auto-parts firms line its industrial belt, allowing global OEMs to tap into established stamping, plastic injection, and electronics clusters. PROFIA incentives reimburse up to 40% of capital spent on plant upgrades, reducing break-even points for LED module assembly. Coupled with free-trade lanes into the Andean bloc, this positions Colombia as a strategic hub for parts exports.
Argentina, Chile, and Peru contribute niche opportunities. Argentina’s Mercosur ties grant tariff-free access to Brazil, yet peso depreciation impedes component import planning. Chile’s strong mining fleet favors robust dust-sealed lamps, enticing specialty LED bar makers. Peru’s newly announced Electric Mobility Master Plan targets localized EV components, potentially seeding future demand for power-efficient lamps in Lima’s congested corridors.
Altogether, market forces drive a north-south hump: Brazil supplies scale, Colombia offers momentum, and smaller nations yield specialized demand pockets, obliging suppliers to adopt tiered distribution networks that balance border friction with customer proximity.
Competitive Landscape
Competition remains moderately fragmented. The top five vendors collectively control approximately 45% of OEM billings, resulting in a concentration score of 6 for the sector. European brands such as Marelli and ams OSRAM anchor long-standing supply contracts on premium models, emphasizing pixelated matrices and advanced optics. Asian manufacturers leverage cost advantages; Sanan’s Lumileds acquisition grants deeper access to local distributors, lowering entry barriers for Chinese lamp makers.
Thermal management know-how differentiates contenders. Marelli patents copper-foam heat sinks, while regional upstart OptiLux integrates vapor-chamber plates sourced from cellphone scrap. To sidestep import duties, several vendors assemble driver boards in Manaus' free-trade zone, then ship completed lamps to São Paulo plants, meeting Brazil’s 65% domestic-value rule.
Strategic moves show localization urgency. Great Wall’s Iracemápolis launch created a pipeline for regional PCB makers, aligning with the automaker’s 60% local target. BMW’s Santa Catarina upgrade features a new lighting validation lab, reducing test cycles by eight weeks and providing local suppliers with faster feedback loops. Suppliers unable to finance Brazilian footprints instead court Colombian plants, where labor cost advantages offset smaller volumes.
South America Automotive LED Lighting Industry Leaders
Marelli Holdings Co., Ltd.
Stanley Electric Co., Ltd.
Valeo S.A.
HELLA GmbH & Co. KGaA
ams-OSRAM AG
- *Disclaimer: Major Players sorted in no particular order

Recent Industry Developments
- July 2025: Marelli received U.S. Bankruptcy Court approval for “second-day” motions, unlocking USD 130 million of debtor-in-possession financing to keep global LED production on track.
- April 2025: ECARX unveiled ECARXperience, a generative AI HMI that will influence future interior lighting specs across regional EV rollouts.
- October 2024: BMW confirmed a USD 200 million expansion of its Brazilian plant to add new models and technology capacity by 2028.
- October 2024: Great Wall Motor set May 2025 for the opening of its Iracemápolis factory, progressing to 60% local content by 2028.


South America Automotive LED Lighting Market Report Scope
Daytime Running Lights (DRL), Directional Signal Lights, Headlights, Reverse Light, Stop Light, Tail Light, Others are covered as segments by Automotive Utility Lighting. 2 Wheelers, Commercial Vehicles, Passenger Cars are covered as segments by Automotive Vehicle Lighting.| OEM |
| Aftermarket |
| New Installation |
| Retrofit Installation |
| Passenger Cars |
| Light Commercial Vehicles |
| Heavy Commercial Vehicles |
| Two-Wheelers |
| Exterior Lighting | Headlamps |
| Daytime Running Lights | |
| Taillights | |
| Fog Lamps | |
| Turn Signals | |
| Other Exterior Lightings | |
| Interior Lighting | Dome and Map Lights |
| Ambient Lighting | |
| Instrument Cluster and Infotainment Backlighting | |
| Others Interior Lightings |
| Brazil |
| Argentina |
| Chile |
| Colombia |
| Peru |
| Rest of South America |
| By Sales Channel | OEM | |
| Aftermarket | ||
| By Installation Type | New Installation | |
| Retrofit Installation | ||
| By Vehicle Type | Passenger Cars | |
| Light Commercial Vehicles | ||
| Heavy Commercial Vehicles | ||
| Two-Wheelers | ||
| By Application | Exterior Lighting | Headlamps |
| Daytime Running Lights | ||
| Taillights | ||
| Fog Lamps | ||
| Turn Signals | ||
| Other Exterior Lightings | ||
| Interior Lighting | Dome and Map Lights | |
| Ambient Lighting | ||
| Instrument Cluster and Infotainment Backlighting | ||
| Others Interior Lightings | ||
| By Country | Brazil | |
| Argentina | ||
| Chile | ||
| Colombia | ||
| Peru | ||
| Rest of South America | ||


Market Definition
- INDOOR LIGHTING - It incorporates all LED based lamps and fixtures/luminaire that are used to illuminate indoor section of residential, commercial, industrial buildings and agricultural lighting. LED offers efficient brightness with higher durability in comparison to other lighting technology.
- OUTDOOR LIGHTING - It incorporates the LED lighting fixtures that is used for illumination for exterior/outdoor illumination. For instance, LED lighting fixtures used to illuminate streets and highways, transport hubs, stadiums and other public places such as parking spaces.
- AUTOMOTIVE LIGHTING - It refers to the lighting fixtures installed for illumination and signaling purposes. It is used in both exterior and interior lighting of the vehicle. Headlamps, fog lamp, daytime running light (DRLs) are examples of exterior light whereas cabin light are interior lights.
- END USER - It refers to the end use application area where the LED fixture will be installed. For instance, in terms of indoor lighting, we have residential, commercial and industrial as end user category. For automotive lighting, primary end user considered are automotive manufacturers and aftermarket sale
| Keyword | Definition |
|---|---|
| Lumen | Lumen is a unit of luminous flux in the International System of Units that is equal to the amount of light given out through a solid angle by a source of one-candela intensity radiating equally in all directions. |
| Footcandle | A foot-candle (or foot-candle, fc, lm/ft2, or ft-c) is a measurement of light intensity. One foot-candle is defined as enough light to saturate a one-foot square with one lumen of light. |
| Colour Rendering Index (CRI) | Color Rendering Index (CRI) is a measurement of how natural colors render under an artificial white light source when compared with sunlight. The index is measured from 0-100, with a perfect 100 indicating that colors of objects under the light source appear the same as they would under natural sunlight. |
| Luminous flux | Luminous flux is a measure of the power of visible light produced by a light source or light fitting. It is measured in lumens (lm). |
| Annual Energy Cost | Annual Energy Cost means the average daily energy consumption multiplied by 365 (days per year), expressed in kilowatt hour per year (kWh/a). |
| Constant voltage drivers | Constant voltage drivers are designed for a single direct current (DC) output voltage. Most common constant voltage drivers (or Power Supplies) are 12VDC or 24VDC. An LED light that is rated for constant voltage usually specifies the amount of input voltage it needs to operate correctly. |
| Constant Current Driver | Constant current LED drivers are designed for a designated range of output voltages and a fixed output current (mA). LEDs that are rated to operate on a constant current driver require a designated supply of current usually specified in milliamps (mA) or amps (A). These drivers vary the voltage along an electronic circuit which allows current to remain constant throughout the LED system. |
| Minimum Energy Performance Standards (MEPS) | Minimum Energy Performance Standards specify the minimum level of energy performance that appliances and equipment must meet or exceed before they can supply or used for commercial purposes. |
| Luminous Efficacy | Luminous efficacy is a measurement commonly used in the lighting industry that indicates the ability of a light source to emit visible light using a given amount of power. |
| Solid State Lighting | Solid-state lighting (SSL) is a type of lighting that uses semiconductor light-emitting diodes (LEDs), organic light-emitting diodes (OLED), or polymer light-emitting diodes (PLED) as sources of illumination rather than electrical filaments, plasma (used in arc lamps such as fluorescent lamps), or gas. |
| Rated Lamp Life | Lamp life, also referred to as rated life, is the time in hours a lamp will last before a percentage of lamps will burn out. |
| Color Temperature | Colour temperature is a scale that measures how ‘warm’ (yellow) or ‘cool’ (blue) the light from a particular source is. It is measured in degrees of the Kelvin scale (abbreviated to K), and the higher the number, the ‘cooler’ the light. The lower the ‘K’ number, the ‘warmer’ the light. |
| Ingress Protection rating (IP rating) | The IP (Ingress Protection) rating of a bulb or light fixture declares the level of protection it has against dirt and water. |
| Fidelity Index | The general colour fidelity index, Rf, represents how closely the colour appearances of the entire sample set are reproduced (rendered) on average by a test light as compared to those under a reference illuminant. |
| Gamut Index | The gamut area is defined as “the area enclosed by a set of test color samples illuminated by a light source, in a two-dimensional chromaticity diagram or a plane of color space.”1 Within a defined color space, a “gamut” describes the subset of colors that can be perceived under specific lighting conditions. |
| Binning | In the lighting industry, the act of "binning" of LEDs is the process of sorting LEDs by certain characteristics, such as color, voltage, and brightness. |
| Accent lighting | Accent lighting, also called highlighting, emphasizes objects by focusing light directly on them. Accent lighting is used inside and outside the home to feature locations such as an entrance or to create dramatic effects. |
| Dimmable driver | A dimming driver has two functions: As a driver, it converts the 230V AC mains input to a low voltage DC output. As a dimmer, it reduces the amount of electrical energy flowing to the LEDs, thereby causing them to dim. |
| Flicker | Flicker is the repeated and frequent variation in the output of a light source over time. |
| Fluorescent | A property of materials defined as the ability to emit light after absorbing electromagnetic radiation such as visible or UV light. |
| Candela | The candela is the unit of luminous intensity in the International System of Units. It measures the light output per unit solid angle emitted from a light source in a specific direction. |
| LUX | Lux is used to measure the amount of light output in a given area - one lux is equal to one lumen per square meter. It enables us to measure the total "amount" of visible light present and the intensity of the illumination on a surface. |
| Uniformity (U0) | The uniformity of lighting has significant effects on visual performance in both indoor and outdoor areas. Uniformity (represented as U0) value can be found by dividing the minimum brightness (Emin) resulting from calculations according to the current lighting order, to the average brightness value (Eavg). |
| Visible Light Spectrum | The visible light spectrum is the segment of the electromagnetic spectrum that the human eye can view. More simply, this range of wavelengths is called visible light. Typically, the human eye can detect wavelengths from 380 to 700 nanometers. |
| Ambient Temperature | Ambient Temperature is the temperature of the air surrounding an electrical enclosure. |
| Current-controlled dimming control | Current-controlled dimming controls LED brightness by varying the applied current using a 0-10V dimmer. Current-controlled dimming is smooth and HD-video friendly. It can only dim to a minimum of 5% of light output. |
| Design Light Consortium | It is a partnership of energy efficiency stakeholders in the United States and Canada to “promote quality, performance and energy efficient lighting solutions for the commercial sector”. |
| Pulse Width Modulation | Pulse-width modulation, or pulse-duration modulation, is a method of controlling the average power delivered by an electrical signal. |
| Surface Mounted Device | A surface mount device (SMD) is an electronic device whose components are mounted or placed directly on the surface of a printed circuit board. |
| Alternating Current | Alternating current is an electric current which periodically reverses direction and changes its magnitude continuously with time, in contrast to direct current, which flows only in one direction. |
| Direct Current | Direct current (DC) is an electric current that is uni-directional, so the flow of charge is always in the same direction. |
| Beam Angle | Beam angle (also called beam spread) is a measure of how light is distributed. On any plane perpendicular to the centerline of the light, the beam angle is the angle between two rays where the light intensity is 50% of the maximum light intensity. |
| LED Based Solar High Mast Lighting Systems | A Solar LED High Mast Light is a raised source of High illumination lights (6~8 lights) and with high intensity on the middle of major junctions (Ring roads, Outer Ring roads), turned on or lit automatically in the absence of light (at specified timings or at periodic times, every night). |
| Surface Mounted Diode (SMD) LEDs | A surface mount diode is a type that emits light and is flat mounted and soldered onto a circuit board. |
| Chip on Board (COB) LEDs | A COB LED is basically multiple LED chips (usually 9 or more) glued directly onto a substrate by the manufacturer to form a single module. |
| Dual In-Line Package (DIP) LEDs | A dual in-line package (DIP or DIL) is an electronic component package with a rectangular case and two parallel rows of electrical connector pins. |
| Graphene LED Lights | A graphene LED light bulb is simply an LED light bulb where the filament has been coated in graphene. A graphene LED bulb is reported to be 10% more efficient than regular LED light bulbs and they are cheaper to manufacture and buy. |
| LED Corn Bulbs | LED Corn lights are designed as an energy efficient alternative to high intensity discharge (HID) and SON lamps. It uses a large number of LEDs on a metal structure to provide sufficient light. This arrangement of LEDs looks a lot like a corn cob, hence the name "corn light". |
| Per Capita Income | Per capita income or total income measures the average income earned per person in a given area in a specified year. It is calculated by dividing the area's total income by its total population. Per capita income is national income divided by population size. |
| Charging Stations | A charging station, also known as a charging station or electric vehicle utility, is a power supply that provides electrical energy for charging plug-in electric vehicles. |
| Headlight | A headlight is a light that is mounted on the front of a car and illuminates the road in front of it. Low beam and high beam LED headlights are additional categories for these LED headlights. |
| Day Time Running Light (DRLs) | A daytime running lamp is a white, yellow, or amber lighting device mounted on the front of a road-going motor vehicle or bicycle. |
| Directional Signal Light | Directional signal lights are the front and rear lights on an automobile that flash to show the direction of a turn. |
| Stop Light | A red light that is mounted to the back of a car and turns on when the brakes are used to show that the car is stopped. |
| Reverse Light | The reverse light is at the back of the vehicle to indicate its backward motion. |
| Tail Light | A red light that can be seen in the dark is mounted on the rear of a road vehicle. Stop, reverse, and directional signal lights are all part of it. |
| Fog Light | Bright lights in automobiles used to increase visibility on the road in foggy conditions or to warn other drivers of the presence of the vehicle. |
| Passenger Vehicle | A passenger vehicle is a road vehicle, other than a moped or a motorcycle, intended for the transportation of people and designed for up to 8 to 9 seats. |
| Commercial Vehicle | A commercial vehicle (Bus, Truck, Van) is any type of motor vehicle used to transport goods or pay passengers. |
| Two Wheelers (2W) | A two-wheeler is a vehicle that runs on two wheels. |
| Streets & Roadways | Both roads and streets refer to hard, flat surfaces on the ground on which vehicles, people, and animals can travel. Since streetways are usually in cities and towns, they often have houses and buildings on both sides. The roadway is in the countryside and sometimes passes through forests and fields |
| Horticulture Lighting | Horticulture is the science and art of sustainably growing, producing, marketing and using high quality, intensively cultivated food and ornamental plants. |


Research Methodology
Mordor Intelligence has followed the following methodology in all our data center reports.
- Step 1: Raw Data Collection: To understand the market, initially, all crtical data points were identified. Critical information about countries and regions of interest including Per-capita Income, Population, Automotive Production, Interest rate on Auto-Loans, Number of Automobiles on Road, Total LED Import, Lighting Electricity Consumption among others were recorded or estimated based on internal calculations.
- Step 2: Identify Key Variables: To build a robust forecasting model, key variables such as Number of Households, Automotive Production, Road Networks among others were identified. Through an iterative process, the variables required for the market forecast were set, and the model was built using these variables.
- Step 3: Build a Market Model: Based on data and critical industry trend data (variables), including LED pricing, LED penetration rate, and project macro and micor economic factors were utilized for building the market forecasting.
- Step 4: Validate and Finalize: In this crucial step, all market numbers and variables derived through an internal mathematical model were validated through an extensive network of primary research experts from all the markets studied. The respondents are selected across levels and functions to generate a holistic picture of the market studied.
- Step 5: Research Outputs: Syndicated Reports, Custom Consulting Assignments, Databases & Subscription Platforms


