Automotive LED Lighting Market Size and Share
Market Overview
| Study Period | 2020 - 2031 |
|---|---|
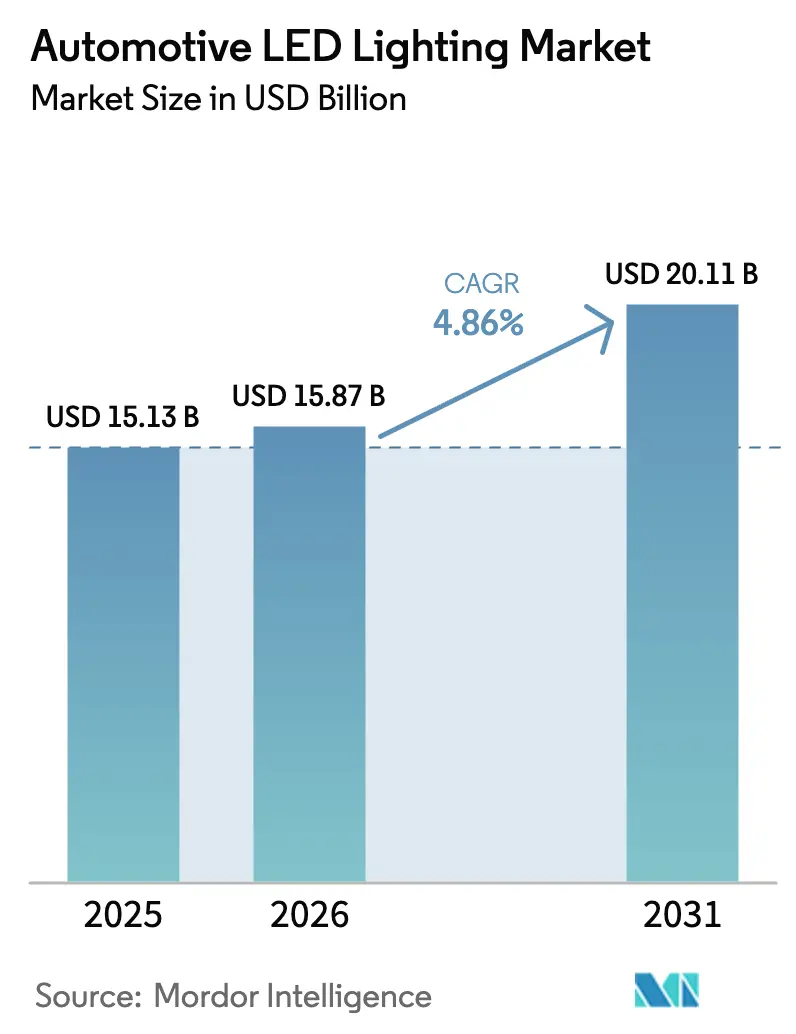
| Market Size (2026) | USD 15.87 Billion |
| Market Size (2031) | USD 20.11 Billion |
| Growth Rate (2026 - 2031) | 4.86% CAGR |
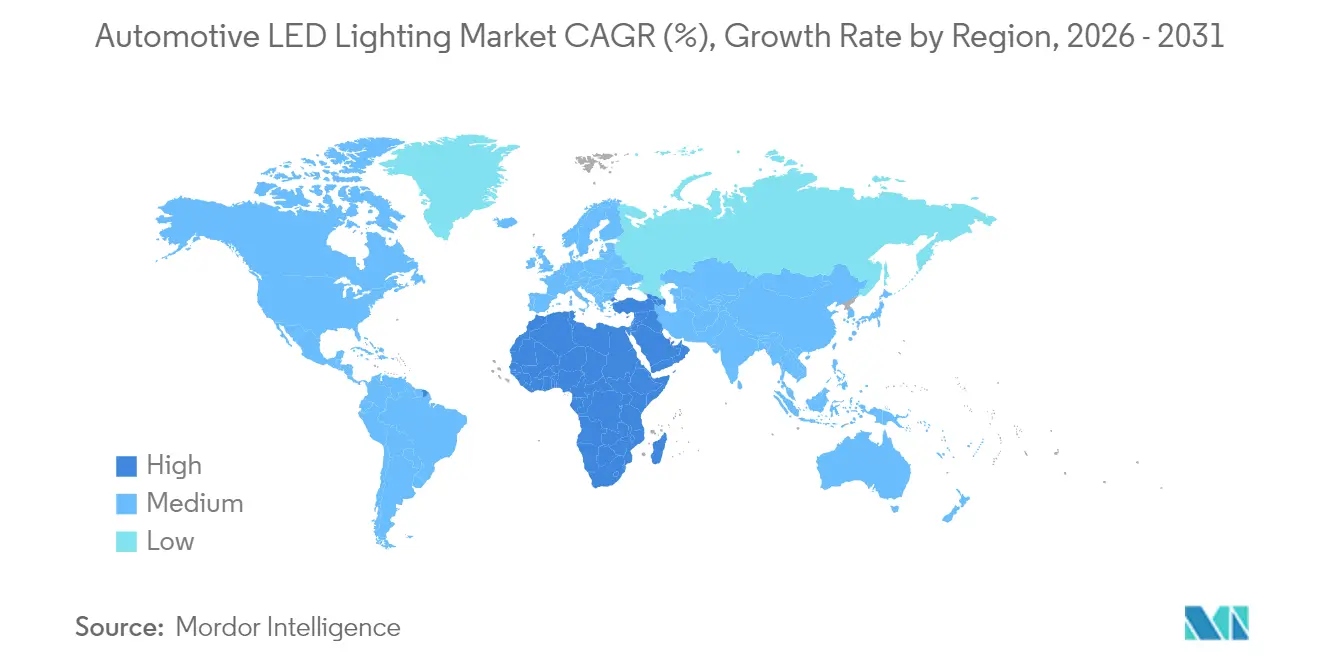
| Fastest Growing Market | Middle East and Africa |
| Largest Market | Asia Pacific |
| Market Concentration | Medium |
Major Players *Disclaimer: Major Players sorted in no particular order Image © Mordor Intelligence. Reuse requires attribution under CC BY 4.0. | |
Automotive LED Lighting Market Analysis by Mordor Intelligence
The automotive LED lighting market size is expected to grow from USD 15.13 billion in 2025 to USD 15.87 billion in 2026 and is forecast to reach USD 20.11 billion by 2031 at 4.86% CAGR over 2026-2031. Sustained gains reflect automakers’ migration from halogen and xenon systems to energy-efficient LEDs that lower electrical loads, simplify styling, and support advanced driver-assistance features. Rapid volume scale-up in the Asia-Pacific, favorable beam-pattern regulations in Europe, and lower cost-per-lumen from advances in gallium-nitride substrate technology underpin demand growth. Electric-vehicle skateboard architectures create fresh design latitude for slim, multifunctional lamps that integrate sensors, while declining LED package prices widen retrofit prospects in the aftermarket. Established suppliers retain an edge by combining optical engineering expertise, thermal management knowledge, and long-standing OEM relationships.
Key Report Takeaways
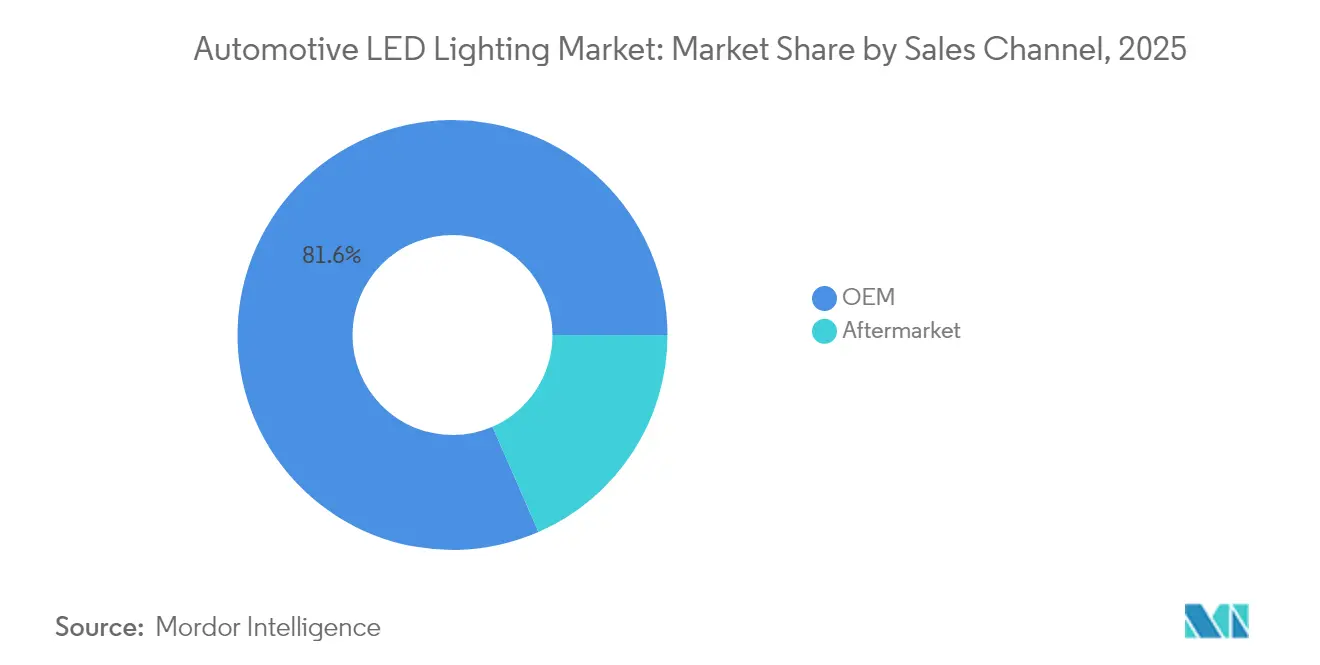
- By sales channel, the OEM segment led with 81.55% revenue share of the automotive LED lighting market in 2025; the aftermarket is forecast to advance at a 5.54% CAGR through 2031.
- By vehicle type, passenger cars accounted for 68.10% of the automotive LED lighting market share in 2025, and this segment is projected to expand at a 8.98% CAGR through 2031.
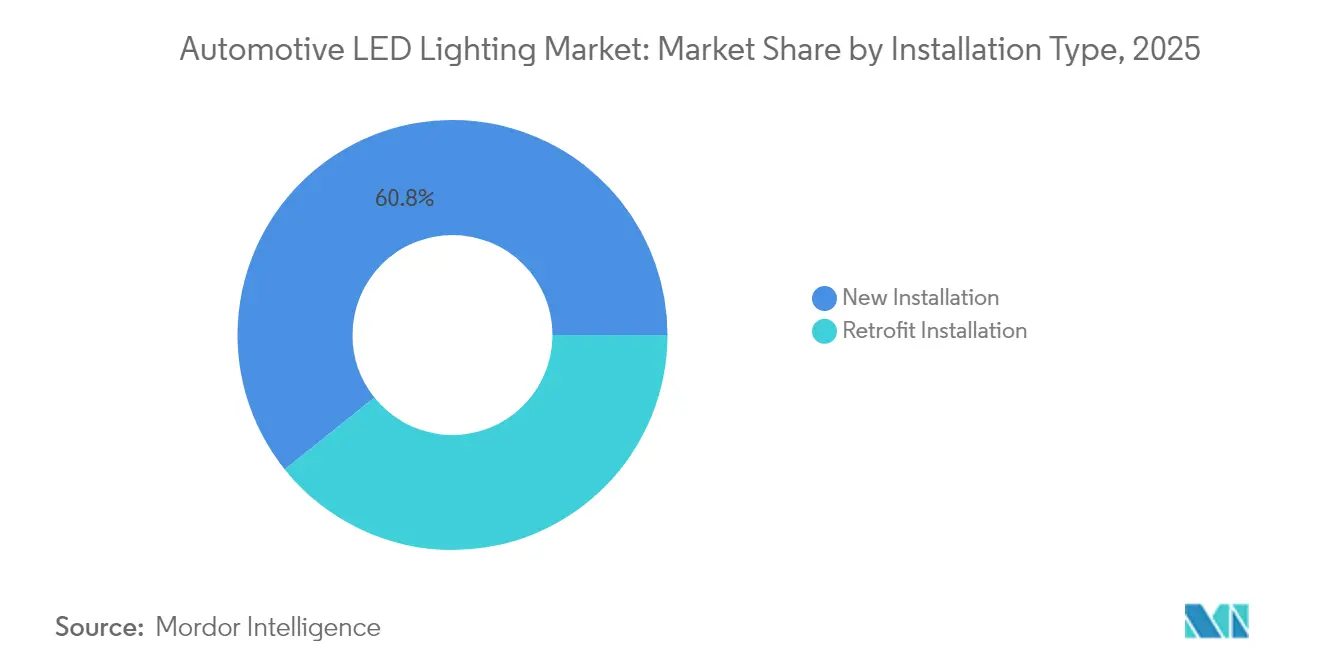
- By installation type, new-install LEDs accounted for 60.75% of the automotive LED lighting market size in 2025, while retrofit solutions are set to grow at a 5.93% CAGR over the forecast period.
- By application, exterior lighting held a 76.85% share of the automotive LED lighting market size in 2025, and interior lighting is expected to advance at a 5.27% CAGR through 2031.
- By geography, the Asia-Pacific region dominated the automotive LED lighting market with a 40.05% share in 2025; the Middle East and Africa region is poised for the fastest growth, with a 7.21% CAGR through 2031.
Note: Market size and forecast figures in this report are generated using Mordor Intelligence’s proprietary estimation framework, updated with the latest available data and insights as of 2026.
Global Automotive LED Lighting Market Trends and Insights
Drivers Impact Analysis*
| Driver | (~) % Impact on CAGR Forecast | Geographic Relevance | Impact Timeline |
|---|---|---|---|
| OEM adoption of adaptive LED headlamps | +1.2% | Europe, North America, Japan | Medium term (2-4 years) |
| EV skateboard platforms | +0.8% | China, Europe, North America | Long term (≥ 4 years) |
| Falling cost per lumen (MOCVD substrates) | +0.7% | Asia-Pacific production hubs | Short term (≤ 2 years) |
| UN ECE R149 beam-pattern regulation | +0.6% | Europe; spillover globally | Medium term (2-4 years) |
| Insurance discounts for adaptive headlights | +0.4% | North America, Europe | Medium term (2-4 years) |
| Municipal bans on halogen bulbs | +0.3% | Europe; select U.S. states; global metro areas | Short term (≤ 2 years) |
| Source: Mordor Intelligence | |||


Acceleration of OEM LED adoption for adaptive headlamps
Automakers now specify matrix or pixel LEDs on mid-range vehicles to satisfy safety regulations and brand styling cues. BMW’s latest matrix system deploys more than 100 individually controlled segments and maintains photometric stability from –40°C to 85°C, meeting stringent glare thresholds.[1]Koito Manufacturing, “Latest Lamp Systems,” koito.co.jp KOITO’s BladeScan technology achieves the resolution of a 300-LED array with only 12 emitters by reflecting beams off rotating blades, extending pedestrian detection from 32 m to 56 m. FORVIA HELLA codesigned digital headlamps for the Audi Q6 e-tron that project warnings onto the road surface and enable vehicle-to-environment signaling.[2]FORVIA HELLA, “FORVIA HELLA and Audi Break New Ground with Digital Headlamp Concept,” hella.com Finer light segmentation supports emerging advanced driver-assistance functions such as traffic-jam pilot and automated lane change. These capabilities directly influence regulatory agendas and accelerate the automotive LED lighting market’s shift toward fully software-defined lamps.
Shift to EV skateboard platforms enabling streamlined lighting architectures
Relocating battery packs to the floor frees up frontal real estate for slim lamp modules that combine illumination, radar, LiDAR, and cameras inside sealed panels. HELLA’s one-meter-wide front panel integrates headlamps, daytime running lights, and multiple sensors, and entered series production with a European OEM in 2024. Such modules run on 48 V power nets common to new EVs, allowing higher-wattage LED arrays without overloading legacy 12 V circuits. The design latitude allows brands to develop animated welcome signatures and homogeneous light bands that double as sensing apertures, thereby increasing the average content per vehicle in the automotive LED lighting market.
Declining LED cost per lumen due to MOCVD substrate innovations
High-throughput reactors from AIXTRON enable uniform gallium-nitride epitaxy, trimming defect rates, and boosting yields. Wolfspeed’s silicon-carbide wafer capacity provides an alternative substrate route that enhances thermal conductivity for high-power emitters. ams OSRAM’s NIGHT BREAKER LED SMART bulbs leverage these advances to deliver 330% greater brightness than halogen while consuming 60% less energy. Lower device costs shorten payback periods for fleet operators, making LED retrofits more attractive in cost-sensitive regions and expanding the automotive LED lighting market base beyond premium tiers.
Stringent UN ECE R149 beam-pattern regulations favoring LED upgrades
ECE R149 requires precise cut-off lines, dynamic leveling, and glare limits that halogen reflectors struggle to meet. Mercedes-Benz DIGITAL LIGHT surpasses 1,000,000 pixels to sculpt beams around oncoming traffic. Research comparing approved LED retrofits with H7 halogen bulbs shows a triple peak intensity while remaining compliant, underscoring the regulatory fit of LEDs. Enforcement actions against illegal retrofits in Massachusetts highlight authorities’ resolve, steering consumers toward certified LED assemblies and reinforcing OEM penetration.
Restraints Impact Analysis*
| Restraint | (~) % Impact on CAGR Forecast | Geographic Relevance | Impact Timeline |
|---|---|---|---|
| Thermal-management complexity | –0.9% | Global; acute in compact vehicles | Long term (≥ 4 years) |
| Counterfeit LED bulb imports | –0.5% | Price-sensitive aftermarket channels | Medium term (2-4 years) |
| Gallium-nitride price volatility | –0.4% | Asia-Pacific wafer supply; European Tier-1 margins | Short term (≤ 2 years) |
| Limited 48 V architectures in legacy fleets | –0.3% | North American and European commercial vehicles | Long term (≥ 4 years) |
| Source: Mordor Intelligence | |||
Thermal-management complexity in high-power LED modules
LED junction temperatures exceeding 150 °C degrade lumen output and shift color. Technical University of Darmstadt test cycles revealed sporadic failures of retrofit LEDs in sealed housings lacking airflow, prompting calls for mandatory thermal diagnostics at inspection centers. Car Mate’s C4500 series counters this with enlarged aluminum heat sinks and micro-fans, but still faces space constraints in compact engine bays. KOITO’s plan to embed medium-range LiDAR close to 16,000-pixel lamps requires liquid-cooling plates to maintain optical alignment across a temperature range of –40 °C to 85 °C. These measures increase system costs and hinder the automotive LED lighting market’s full transition to ultra-high-density arrays.
Persistent counterfeit LED bulb imports depressing aftermarket trust
U.S. Customs continues to seize non-compliant bulbs lacking E-mark or DOT codes, many of which overdrive chips and fail within months. ADAC warns German motorists that illegal retrofits can cause blindness to oncoming drivers and invalidate vehicle registration.[3]ADAC, “LED Retrofit Lamps for Motorcycles and Vintage Cars,” adac.de In response, ams OSRAM restricts NIGHT BREAKER LED SMART sales to certified workshops that verify fitment via an online database, raising consumer confidence but slowing volume in gray channels. Ongoing enforcement costs and education campaigns temper growth in the price-driven end of the automotive LED lighting market.
*Our forecasts treat driver/restraint impacts as directional, not additive. The impact forecasts reflect baseline growth, mix effects, and variable interactions.
Segment Analysis
By Sales Channel: OEM Integration Drives Market Leadership
OEM programs accounted for 81.55% of the automotive LED lighting market in 2025 as brands standardized LEDs across trim levels to secure energy credits and styling signatures. KOITO earned JPY 950.3 billion (USD 6.4 billion) from automotive lamps in fiscal 2024, underscoring OEM volume scale. Integrated designs enable precise beam calibration, embedded diagnostics, and compliance with ECE R149, advantages that are difficult for aftermarket kits to replicate. The aftermarket, which holds 18.45%, is nonetheless poised for a 5.54% CAGR as vehicle owners upgrade halogen stock lamps to OEM-style LEDs. Cross-border e-commerce widens access, but regulatory type-approval vetting remains uneven.
OEM demand will remain robust as electrification continues to proliferate. Automakers are increasingly bundling LED packages with driver-assistance options, which raises the bill of materials. Meanwhile, warranty-backed retrofit kits from tier-one suppliers target fleets seeking lower maintenance costs. Insurance incentives favor adaptive OEM systems, further cementing automaker dominance in the automotive LED lighting market.


By Vehicle Type: Passenger Cars Lead Adoption and Growth
Passenger cars held 68.10% of the automotive LED lighting market share in 2025 and are forecast to have a 8.98% CAGR, propelled by brand differentiation and mid-cycle facelift strategies. Premium marques were the first to introduce matrix LEDs, but volume brands are now installing adaptive beams on higher trims, boosting unit penetration. Light commercial vehicles represent 31.90% of the market and benefit from lifecycle cost savings, especially for urban delivery fleets that operate with long duty cycles at low speeds, where energy efficiency is crucial.
Luxury sedans pioneer pixel projection features that display warning icons ahead of the vehicle, while mass-market compacts adopt simplified reflector-LED hybrids. On highways, LED taillights with rapid response times cut rear-end collisions, supporting regulators’ push for broader uptake. The trend keeps passenger cars at the forefront of the automotive LED lighting market’s technological curve, while commercial segments adopt more mature solutions.
By Installation Type: New Installation Dominance with Retrofit Growth
New installations captured 60.75% of the automotive LED lighting market size in 2025 because OEMs engineer lamps around LEDs from the concept phase. Fully sealed modules utilize liquid-cooling heat spreaders and intelligent drivers to meet rigorous lifetime specifications. Retrofit kits held 39.25% but are growing at 5.93% CAGR as warranty-compliant options expand. ams OSRAM’s NIGHT BREAKER LED SMART bulbs, supported by a six-year warranty, cover more than 800 vehicle models in Germany and meet ECE R149 photometric patterns.
Yet, national road-worthiness rules still ban bulb-only replacements in many regions, unless the optics are re-certified, limiting the addressable volume. Retrofit kits that replace entire projector units circumvent this by carrying their own homologation. Greater clarity in regulations and rising familiarity with LED technology should help retrofits capture an incremental share without displacing OEMs’ primacy within the automotive LED lighting market.
By Application: Exterior Lighting Maintains Dominance
Exterior systems commanded 76.85% of the automotive LED lighting market share in 2025, as headlamps, daytime running lights, and taillights remain safety-critical. High-resolution adaptive beams enhance nighttime visibility, and sequential turn signals elevate brand identity. Interior applications held 23.15% but are the fastest climber at 5.27% CAGR as RGB ambient strips, roof-mounted reading lights, and dynamic welcome sequences proliferate.
Next-generation infotainment synchronizes cabin light color with media content, while health-oriented circadian lighting adjusts the color temperature according to the time of day. Supply chains now deliver miniaturized, high-CRI RGB packs that integrate into trim panels, raising per-car LED counts. This dual momentum sustains broad-based expansion of the automotive LED lighting market, with interior modules set to contribute a higher margin per lumen than their exterior counterparts.
Geography Analysis
Asia-Pacific led with 40.05% revenue share in 2025 on the strength of China’s 30-million-unit annual output, Japan’s longstanding LED expertise, and Korea’s premium EV launches. KOITO, Stanley Electric, and Nichia anchor the regional supply chain, while domestic EV makers such as BYD specify pixelized headlights for higher-trim models. Government energy-efficiency mandates and local substrate fabrication give the region pricing advantages that reinforce scale economies for the automotive LED lighting market.
Europe retains a high value share, thanks in part to UN ECE R149 enforcement and premium OEM technology leadership. Mercedes, BMW, and Audi debuted multi-million-pixel lamps, driving tier-one R&D spend. Suppliers like FORVIA HELLA commercialized large-area integrated panels that replace radiator grilles, fitting Europe’s design language and CO₂ emission targets. End-of-sale dates for halogen bulbs in many EU states boost retrofit demand, while national insurers reward adaptive-beam fitment, adding volume to the automotive LED lighting market.
The Middle East and Africa, although currently small, are expected to log the fastest 7.21% CAGR. Rapid urbanization and rising per-capita income spur vehicle sales, and hot climates amplify the advantages of LED bulbs over filament bulbs in terms of longevity. Provincial incentives to retrofit public transportation fleets further boost volumes. North America maintains a steady adoption pace, driven by safety-rating organizations and EV expansion, with suppliers localizing production to sidestep tariff headwinds. Collectively, geographic diversification ensures resilient growth for the automotive LED lighting market even amid regional economic swings.

Competitive Landscape
Industry concentration is moderate, with the top five players, KOITO, Valeo, FORVIA HELLA, Marelli, and Stanley Electric, collectively holding just above 60% of OEM volumes. KOITO’s 16,000-pixel HD adaptive-beam roadmap underscores its optic-mechanical depth, while Valeo exploits on-board software to blend LiDAR and LED control loops for driver-assistance packages.[4]MarkLines Automotive Industry Portal, “Koito Manufacturing Co., Ltd.,” marklines.com FORVIA HELLA’s one-piece front panels illustrate the pivot from discrete lamps to sensor-laden fascia, cementing the firm’s system integrator status.
Component specialists Nichia and AMS OSRAM supply high-efficiency emitters and RGB packs, positioning themselves upstream of the lamp giants. Start-ups focus on micro-LED projection modules, but capital intensity and regulatory hurdles curtail rapid scaling. Patent portfolios around light-based communication and holographic road markings indicate the next battleground. Overall, technological capability, thermal know-how, and OEM intimacy remain decisive, shaping a competitive arena where product lifecycles shorten yet homologation burdens rise, maintaining disciplined pricing in the automotive LED lighting market.
Automotive LED Lighting Industry Leaders
Koito Manufacturing Co., Ltd.
Valeo SA
HELLA GmbH & Co. KGaA
Marelli Holdings Co., Ltd.
Stanley Electric Co., Ltd.
- *Disclaimer: Major Players sorted in no particular order


Recent Industry Developments
- June 2025: Car Mate launched the GIGA LED position bulb S400T and C4500 headlight series, featuring a stealth design and enhanced aluminum heat sinks.
- May 2025: Car Mate unveiled EC-exclusive E8 and D9 LED headlight ranges offering up to 9,000-lumen output for halogen and HID replacements.
- January 2025: ams OSRAM introduced NIGHT BREAKER LED SMART retrofit lamps delivering 330% higher brightness and 6000 K color temperature, backed by a six-year warranty.
- December 2024: KOITO reported automotive lighting revenue of JPY 950.3 billion (USD 6.4 billion), representing 94.3% of total sales and confirming development of 16,000-LED HD ADB systems for 2025 production.


Global Automotive LED Lighting Market Report Scope
Daytime Running Lights (DRL), Directional Signal Lights, Headlights, Reverse Light, Stop Light, Tail Light, Others are covered as segments by Automotive Utility Lighting. 2 Wheelers, Commercial Vehicles, Passenger Cars are covered as segments by Automotive Vehicle Lighting. Asia-Pacific, Europe, Middle East and Africa, North America, South America are covered as segments by Region.| OEM |
| Aftermarket |
| Passenger Cars |
| Light Commercial Vehicles |
| Heavy Commercial Vehicles |
| Two-Wheelers |
| New Installation |
| Retrofit Installation |
| Exterior Lighting | Headlamps |
| Daytime Running Lights | |
| Taillights | |
| Fog Lamps | |
| Turn Signals | |
| Other Exterior Lightings | |
| Interior Lighting | Dome and Map Lights |
| Ambient Lighting | |
| Instrument Cluster and Infotainment Backlighting | |
| Others Interior Lightings |
| North America | United States | |
| Canada | ||
| Mexico | ||
| South America | Brazil | |
| Argentina | ||
| Rest of South America | ||
| Europe | Germany | |
| France | ||
| United Kingdom | ||
| Italy | ||
| Spain | ||
| Rest of Europe | ||
| Asia-Pacific | China | |
| Japan | ||
| India | ||
| South Korea | ||
| Australia | ||
| Rest of Asia-Pacific | ||
| Middle East and Africa | Middle East | Saudi Arabia |
| United Arab Emirates | ||
| Turkey | ||
| Rest of Middle East | ||
| Africa | South Africa | |
| Egypt | ||
| Nigeria | ||
| Rest of Africa | ||
| By Sales Channel | OEM | ||
| Aftermarket | |||
| By Vehicle Type | Passenger Cars | ||
| Light Commercial Vehicles | |||
| Heavy Commercial Vehicles | |||
| Two-Wheelers | |||
| By Installation Type | New Installation | ||
| Retrofit Installation | |||
| By Application | Exterior Lighting | Headlamps | |
| Daytime Running Lights | |||
| Taillights | |||
| Fog Lamps | |||
| Turn Signals | |||
| Other Exterior Lightings | |||
| Interior Lighting | Dome and Map Lights | ||
| Ambient Lighting | |||
| Instrument Cluster and Infotainment Backlighting | |||
| Others Interior Lightings | |||
| By Geography | North America | United States | |
| Canada | |||
| Mexico | |||
| South America | Brazil | ||
| Argentina | |||
| Rest of South America | |||
| Europe | Germany | ||
| France | |||
| United Kingdom | |||
| Italy | |||
| Spain | |||
| Rest of Europe | |||
| Asia-Pacific | China | ||
| Japan | |||
| India | |||
| South Korea | |||
| Australia | |||
| Rest of Asia-Pacific | |||
| Middle East and Africa | Middle East | Saudi Arabia | |
| United Arab Emirates | |||
| Turkey | |||
| Rest of Middle East | |||
| Africa | South Africa | ||
| Egypt | |||
| Nigeria | |||
| Rest of Africa | |||


Market Definition
- INDOOR LIGHTING - It incorporates all LED based lamps and fixtures/luminaire that are used to illuminate indoor section of residential, commercial, industrial buildings and agricultural lighting. LED offers efficient brightness with higher durability in comparison to other lighting technology.
- OUTDOOR LIGHTING - It incorporates the LED lighting fixtures that is used for illumination for exterior/outdoor illumination. For instance, LED lighting fixtures used to illuminate streets and highways, transport hubs, stadiums and other public places such as parking spaces.
- AUTOMOTIVE LIGHTING - It refers to the lighting fixtures installed for illumination and signaling purposes. It is used in both exterior and interior lighting of the vehicle. Headlamps, fog lamp, daytime running light (DRLs) are examples of exterior light whereas cabin light are interior lights.
- END USER - It refers to the end use application area where the LED fixture will be installed. For instance, in terms of indoor lighting, we have residential, commercial and industrial as end user category. For automotive lighting, primary end user considered are automotive manufacturers and aftermarket sale
| Keyword | Definition |
|---|---|
| Lumen | Lumen is a unit of luminous flux in the International System of Units that is equal to the amount of light given out through a solid angle by a source of one-candela intensity radiating equally in all directions. |
| Footcandle | A foot-candle (or foot-candle, fc, lm/ft2, or ft-c) is a measurement of light intensity. One foot-candle is defined as enough light to saturate a one-foot square with one lumen of light. |
| Colour Rendering Index (CRI) | Color Rendering Index (CRI) is a measurement of how natural colors render under an artificial white light source when compared with sunlight. The index is measured from 0-100, with a perfect 100 indicating that colors of objects under the light source appear the same as they would under natural sunlight. |
| Luminous flux | Luminous flux is a measure of the power of visible light produced by a light source or light fitting. It is measured in lumens (lm). |
| Annual Energy Cost | Annual Energy Cost means the average daily energy consumption multiplied by 365 (days per year), expressed in kilowatt hour per year (kWh/a). |
| Constant voltage drivers | Constant voltage drivers are designed for a single direct current (DC) output voltage. Most common constant voltage drivers (or Power Supplies) are 12VDC or 24VDC. An LED light that is rated for constant voltage usually specifies the amount of input voltage it needs to operate correctly. |
| Constant Current Driver | Constant current LED drivers are designed for a designated range of output voltages and a fixed output current (mA). LEDs that are rated to operate on a constant current driver require a designated supply of current usually specified in milliamps (mA) or amps (A). These drivers vary the voltage along an electronic circuit which allows current to remain constant throughout the LED system. |
| Minimum Energy Performance Standards (MEPS) | Minimum Energy Performance Standards specify the minimum level of energy performance that appliances and equipment must meet or exceed before they can supply or used for commercial purposes. |
| Luminous Efficacy | Luminous efficacy is a measurement commonly used in the lighting industry that indicates the ability of a light source to emit visible light using a given amount of power. |
| Solid State Lighting | Solid-state lighting (SSL) is a type of lighting that uses semiconductor light-emitting diodes (LEDs), organic light-emitting diodes (OLED), or polymer light-emitting diodes (PLED) as sources of illumination rather than electrical filaments, plasma (used in arc lamps such as fluorescent lamps), or gas. |
| Rated Lamp Life | Lamp life, also referred to as rated life, is the time in hours a lamp will last before a percentage of lamps will burn out. |
| Color Temperature | Colour temperature is a scale that measures how ‘warm’ (yellow) or ‘cool’ (blue) the light from a particular source is. It is measured in degrees of the Kelvin scale (abbreviated to K), and the higher the number, the ‘cooler’ the light. The lower the ‘K’ number, the ‘warmer’ the light. |
| Ingress Protection rating (IP rating) | The IP (Ingress Protection) rating of a bulb or light fixture declares the level of protection it has against dirt and water. |
| Fidelity Index | The general colour fidelity index, Rf, represents how closely the colour appearances of the entire sample set are reproduced (rendered) on average by a test light as compared to those under a reference illuminant. |
| Gamut Index | The gamut area is defined as “the area enclosed by a set of test color samples illuminated by a light source, in a two-dimensional chromaticity diagram or a plane of color space.”1 Within a defined color space, a “gamut” describes the subset of colors that can be perceived under specific lighting conditions. |
| Binning | In the lighting industry, the act of "binning" of LEDs is the process of sorting LEDs by certain characteristics, such as color, voltage, and brightness. |
| Accent lighting | Accent lighting, also called highlighting, emphasizes objects by focusing light directly on them. Accent lighting is used inside and outside the home to feature locations such as an entrance or to create dramatic effects. |
| Dimmable driver | A dimming driver has two functions: As a driver, it converts the 230V AC mains input to a low voltage DC output. As a dimmer, it reduces the amount of electrical energy flowing to the LEDs, thereby causing them to dim. |
| Flicker | Flicker is the repeated and frequent variation in the output of a light source over time. |
| Fluorescent | A property of materials defined as the ability to emit light after absorbing electromagnetic radiation such as visible or UV light. |
| Candela | The candela is the unit of luminous intensity in the International System of Units. It measures the light output per unit solid angle emitted from a light source in a specific direction. |
| LUX | Lux is used to measure the amount of light output in a given area - one lux is equal to one lumen per square meter. It enables us to measure the total "amount" of visible light present and the intensity of the illumination on a surface. |
| Uniformity (U0) | The uniformity of lighting has significant effects on visual performance in both indoor and outdoor areas. Uniformity (represented as U0) value can be found by dividing the minimum brightness (Emin) resulting from calculations according to the current lighting order, to the average brightness value (Eavg). |
| Visible Light Spectrum | The visible light spectrum is the segment of the electromagnetic spectrum that the human eye can view. More simply, this range of wavelengths is called visible light. Typically, the human eye can detect wavelengths from 380 to 700 nanometers. |
| Ambient Temperature | Ambient Temperature is the temperature of the air surrounding an electrical enclosure. |
| Current-controlled dimming control | Current-controlled dimming controls LED brightness by varying the applied current using a 0-10V dimmer. Current-controlled dimming is smooth and HD-video friendly. It can only dim to a minimum of 5% of light output. |
| Design Light Consortium | It is a partnership of energy efficiency stakeholders in the United States and Canada to “promote quality, performance and energy efficient lighting solutions for the commercial sector”. |
| Pulse Width Modulation | Pulse-width modulation, or pulse-duration modulation, is a method of controlling the average power delivered by an electrical signal. |
| Surface Mounted Device | A surface mount device (SMD) is an electronic device whose components are mounted or placed directly on the surface of a printed circuit board. |
| Alternating Current | Alternating current is an electric current which periodically reverses direction and changes its magnitude continuously with time, in contrast to direct current, which flows only in one direction. |
| Direct Current | Direct current (DC) is an electric current that is uni-directional, so the flow of charge is always in the same direction. |
| Beam Angle | Beam angle (also called beam spread) is a measure of how light is distributed. On any plane perpendicular to the centerline of the light, the beam angle is the angle between two rays where the light intensity is 50% of the maximum light intensity. |
| LED Based Solar High Mast Lighting Systems | A Solar LED High Mast Light is a raised source of High illumination lights (6~8 lights) and with high intensity on the middle of major junctions (Ring roads, Outer Ring roads), turned on or lit automatically in the absence of light (at specified timings or at periodic times, every night). |
| Surface Mounted Diode (SMD) LEDs | A surface mount diode is a type that emits light and is flat mounted and soldered onto a circuit board. |
| Chip on Board (COB) LEDs | A COB LED is basically multiple LED chips (usually 9 or more) glued directly onto a substrate by the manufacturer to form a single module. |
| Dual In-Line Package (DIP) LEDs | A dual in-line package (DIP or DIL) is an electronic component package with a rectangular case and two parallel rows of electrical connector pins. |
| Graphene LED Lights | A graphene LED light bulb is simply an LED light bulb where the filament has been coated in graphene. A graphene LED bulb is reported to be 10% more efficient than regular LED light bulbs and they are cheaper to manufacture and buy. |
| LED Corn Bulbs | LED Corn lights are designed as an energy efficient alternative to high intensity discharge (HID) and SON lamps. It uses a large number of LEDs on a metal structure to provide sufficient light. This arrangement of LEDs looks a lot like a corn cob, hence the name "corn light". |
| Per Capita Income | Per capita income or total income measures the average income earned per person in a given area in a specified year. It is calculated by dividing the area's total income by its total population. Per capita income is national income divided by population size. |
| Charging Stations | A charging station, also known as a charging station or electric vehicle utility, is a power supply that provides electrical energy for charging plug-in electric vehicles. |
| Headlight | A headlight is a light that is mounted on the front of a car and illuminates the road in front of it. Low beam and high beam LED headlights are additional categories for these LED headlights. |
| Day Time Running Light (DRLs) | A daytime running lamp is a white, yellow, or amber lighting device mounted on the front of a road-going motor vehicle or bicycle. |
| Directional Signal Light | Directional signal lights are the front and rear lights on an automobile that flash to show the direction of a turn. |
| Stop Light | A red light that is mounted to the back of a car and turns on when the brakes are used to show that the car is stopped. |
| Reverse Light | The reverse light is at the back of the vehicle to indicate its backward motion. |
| Tail Light | A red light that can be seen in the dark is mounted on the rear of a road vehicle. Stop, reverse, and directional signal lights are all part of it. |
| Fog Light | Bright lights in automobiles used to increase visibility on the road in foggy conditions or to warn other drivers of the presence of the vehicle. |
| Passenger Vehicle | A passenger vehicle is a road vehicle, other than a moped or a motorcycle, intended for the transportation of people and designed for up to 8 to 9 seats. |
| Commercial Vehicle | A commercial vehicle (Bus, Truck, Van) is any type of motor vehicle used to transport goods or pay passengers. |
| Two Wheelers (2W) | A two-wheeler is a vehicle that runs on two wheels. |
| Streets & Roadways | Both roads and streets refer to hard, flat surfaces on the ground on which vehicles, people, and animals can travel. Since streetways are usually in cities and towns, they often have houses and buildings on both sides. The roadway is in the countryside and sometimes passes through forests and fields |
| Horticulture Lighting | Horticulture is the science and art of sustainably growing, producing, marketing and using high quality, intensively cultivated food and ornamental plants. |


Research Methodology
Mordor Intelligence has followed the following methodology in all our data center reports.
- Step 1: Raw Data Collection: To understand the market, initially, all crtical data points were identified. Critical information about countries and regions of interest including Per-capita Income, Population, Automotive Production, Interest rate on Auto-Loans, Number of Automobiles on Road, Total LED Import, Lighting Electricity Consumption among others were recorded or estimated based on internal calculations.
- Step 2: Identify Key Variables: To build a robust forecasting model, key variables such as Number of Households, Automotive Production, Road Networks among others were identified. Through an iterative process, the variables required for the market forecast were set, and the model was built using these variables.
- Step 3: Build a Market Model: Based on data and critical industry trend data (variables), including LED pricing, LED penetration rate, and project macro and micor economic factors were utilized for building the market forecasting.
- Step 4: Validate and Finalize: In this crucial step, all market numbers and variables derived through an internal mathematical model were validated through an extensive network of primary research experts from all the markets studied. The respondents are selected across levels and functions to generate a holistic picture of the market studied.
- Step 5: Research Outputs: Syndicated Reports, Custom Consulting Assignments, Databases & Subscription Platforms


