North America Automotive LED Lighting Market Size and Share
Market Overview
| Study Period | 2020 - 2031 |
|---|---|
| Forecast Data Period | 2026 - 2031 |
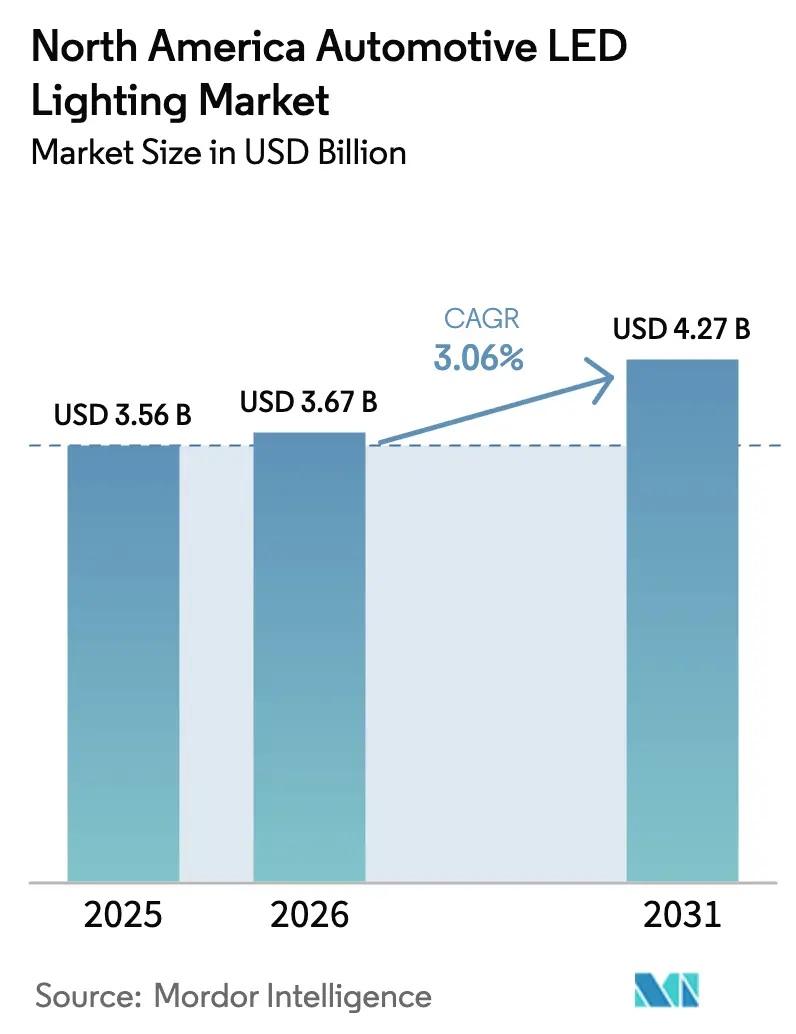
| Base Year Market Size (2025) | USD 3.56 Billion |
| Market Size (2026) | USD 3.67 Billion |
| Market Size (2031) | USD 4.27 Billion |
| Growth Rate (2026 - 2031) | 3.06% CAGR |
| Market Concentration | Medium |
Major Players *Disclaimer: Major Players sorted in no particular order Image © Mordor Intelligence. Reuse requires attribution under CC BY 4.0. | |
North America Automotive LED Lighting Market Analysis by Mordor Intelligence
North America automotive LED lighting market size in 2026 is estimated at USD 3.67 billion, growing from 2025 value of USD 3.56 billion with 2031 projections showing USD 4.27 billion, growing at 3.06% CAGR over 2026-2031. This measured trajectory underscores the region’s steady pivot from mature halogen systems to advanced light-emitting diode solutions that support adaptive driving beams, pixel-level control, and V2X signaling. Regulatory alignment following NHTSA’s 2022 approval of adaptive driving beam technology, coupled with accelerating electrification, positions the North America automotive LED lighting market as a technology-led arena rather than a pure volume expansion play NHTSA.GOV. Wider availability of SiC substrates and thermal management breakthroughs are expected to sustain momentum despite short-term supply constraints.
Key Report Takeaways
- By sales channel, OEMs dominated with 82.74% revenue share in 2025, while the aftermarket is advancing at a 4.18% CAGR through 2031.
- By vehicle type, passenger cars captured 68.95% of North America automotive LED lighting market share in 2025 and are growing at a robust 7.35% CAGR through 2031.
- By installation type, new installations accounted for 61.10% share of the North America automotive LED lighting market size in 2025; retrofits are forecast to expand at a 4.42% CAGR between 2026-2031.
- By application, exterior lighting led with 77.20% revenue share in 2025; interior lighting is projected to advance at a 4.62% CAGR.
- By country, the United States held 71.95% share of the North America automotive LED lighting market size in 2025, while Mexico records the highest projected CAGR at 5.28% through 2031.
Note: Market size and forecast figures in this report are generated using Mordor Intelligence’s proprietary estimation framework, updated with the latest available data and insights as of 2026.
North America Automotive LED Lighting Market Trends and Insights
Drivers Impact Analysis*
| Driver | (~) % Impact on CAGR Forecast | Geographic Relevance | Impact Timeline |
|---|---|---|---|
| Growing adoption of ADAS-ready LED systems | +0.8% | United States & Canada | Medium term (2-4 years) |
| Stricter daytime running-light safety mandates | +0.6% | North America | Short term (≤ 2 years) |
| Demand for energy-efficient lighting to boost fuel economy and EV range | +0.7% | United States & Mexico | Long term (≥ 4 years) |
| OEM styling differentiation through signature lighting | +0.4% | North America | Medium term (2-4 years) |
| Adaptive pixel-LED headlamps with V2X light-signaling | +0.3% | United States core, spill-over to Canada | Long term (≥ 4 years) |
| State-funded retrofit programs for school-bus LED upgrades | +0.2% | United States & Canada | Short term (≤ 2 years) |
| Source: Mordor Intelligence | |||


Growing adoption of ADAS-ready LED systems
Sensor-rich advanced driver-assistance platforms require precise light control so cameras and radar remain unhindered. NHTSA’s 2022 rule change opened the door for adaptive driving beams, removing decades-old restrictions and accelerating OEM roll-outs. Valeo surpassed 20 million front-camera units incorporating Mobileye EyeQ processing, illustrating how lighting and sensing now scale in tandem across regional platforms. Transport Canada’s rapid harmonization with U.S. standards further lowers engineering costs, enabling suppliers to market integrated beam-shaping solutions that highlight pedestrians and dynamically mask glare. As a result, the North America automotive LED lighting market increasingly rewards suppliers that fuse optics, software, and sensors into cohesive modules.
Demand for energy-efficient lighting to boost fuel economy and EV range
Every watt of parasitic draw matters when automakers chase fuel-economy credits and electric-vehicle range. ACEEE studies show that LED systems materially reduce electrical loads compared to legacy bulbs. [1]American Council for an Energy-Efficient Economy, “Vehicle Efficiency and Electrification Research,” aceee.orgFord’s 2025 commercial fleet data indicate its E-Transit vans incur just EUR 3 (USD 3.27) in energy costs per 100 km, compared with EUR 18-20 (USD 19.60-21.80) for diesel counterparts, reflecting efficiency gains that encompass lighting.[2]Ford Motor Company, “The Proof Is in the Power: 2025 Commercial Electrification Trends,” fromtheroad.ford.com Mexico’s output of over 200,000 EVs in 2024 fuels localized sourcing of low-draw LED modules. High-efficacy drivers and improved thermal paths now yield up to 60% power savings, as seen in Ichikoh’s latest module for Toyota Alphard.
OEM styling differentiation through signature lighting
Distinctive light signatures help automakers stand out when grille designs on EVs become increasingly compact. FORVIA HELLA’s digital matrix headlamp on Audi’s Q6 e-tron demonstrates dynamic patterns that double as brand identifiers. Ennostar-Valeo Mini LED fascia displays a preview of external communication surfaces that project icons or branding. Patent filings covering sequential turn functions and programmable arrays underscore a premium-priced feature set that maintains healthy margins in the North America automotive LED lighting market.
State-funded retrofit programs for school-bus LED upgrades
The U.S. EPA’s Clean School Bus Program allocates USD 5 billion through 2027 for electrification and safety enhancements, with LED conversions eligible for reimbursement. Similar provincial programs in Canada are accelerating demand from operators replacing incandescent lamps on their legacy fleets. Retrofit module makers benefit from guaranteed volumes, while installation specialists gain recurring service income as more buses transition to adaptive signals and instant-on tail lamps.
Restraints Impact Analysis*
| Restraint | (~) % Impact on CAGR Forecast | Geographic Relevance | Impact Timeline |
|---|---|---|---|
| High upfront cost of LED modules | -0.5% | North America | Short term (≤ 2 years) |
| Thermal management limits in heavy-duty vehicles | -0.3% | United States & Canada | Medium term (2-4 years) |
| SiC substrate supply constraints for high-power LEDs | -0.4% | North America | Short term (≤ 2 years) |
| Flicker-related human-factor concerns for matrix beams | -0.2% | North America | Long term (≥ 4 years) |
| Source: Mordor Intelligence | |||
High upfront cost of LED modules
Price premiums deter adoption in cost-sensitive segments even when life-cycle savings are clear. SEMA notes that imported electronic components rose 5.9% in landed cost between 2020-2023, eroding affordability for retrofit kits. Trade policy volatility adds uncertainty for suppliers relying on Mexican production. At the same time, insurance and repair costs climbed 14% and 7.3% respectively in 2024, squeezing fleet budgets and delaying discretionary upgrades.
SiC substrate supply constraints for high-power LEDs
High-density matrix beams require SiC substrates with superior thermal conduction. Wolfspeed’s schedule slips at its USD 5 billion North Carolina fab illustrates tight material availability that pinches output. Suppliers holding firm allocations can quote reliably; others face lead-time volatility that caps near-term growth of the North America automotive LED lighting market.
*Our forecasts treat driver/restraint impacts as directional, not additive. The impact forecasts reflect baseline growth, mix effects, and variable interactions.
Segment Analysis
By Sales Channel: Aftermarket Momentum Builds
The North America automotive LED lighting market size for aftermarket channels stood at USD 0.61 billion in 2025 and is projected to grow at a 4.18% CAGR to 2031. Federal and provincial grants aimed at school-bus and transit electrification pump steady volumes into retrofit workshops. Fleet surveys indicate that 90% of operators intend to further electrify their fleets, stimulating demand for LED headlamps and signal upgrades that align with efficiency targets. Younger consumers, who account for over 60% of specialty equipment spending, drive styling-led purchases, such as sequential turn kits and color-selectable ambient strips.
OEM channels still contribute 82.74% of 2025 revenues, benefiting from platform-wide integration and warranty assurances. Automakers gain procurement economies and consolidate electronics through zonal architectures that embed LED control into body domain controllers. SAE technical papers highlight beam-pattern compliance issues that arise when replacement LEDs are installed in halogen housings, underscoring OEM advantages in regulatory conformity.


By Vehicle Type: Electrification Drives Passenger-Car Leadership
Passenger-car applications represented 68.95% of North America automotive LED lighting market share in 2025 and are forecast to grow at 7.35% CAGR. EV platforms amplify the value of low-draw lamps because range metrics directly influence consumer purchase decisions. Mexico’s output nearing 4 million light vehicles annually supports local LED supply lines into U.S. and Canadian showrooms. Valeo’s smart fascia technology illustrates how automakers integrate sensors, heating films, and pixel-LED arrays into consolidated front-end modules.
Commercial vehicles collectively hold 31.05% share. Light vans benefit from total-cost-of-ownership cases proven by Ford’s electrified fleets. Heavy trucks face persistent heat-sink challenges, curbing high-power matrix beam rollout. Motorcycle volumes remain niche; however, premium brands leverage LED signatures for brand identity, opening pockets of profitability within the North America automotive LED lighting market.
By Installation Type: Retrofit Opportunities Accelerate
Retrofit projects comprise 38.90% of 2025 installations and are expected to grow at a 4.42% CAGR as stimulus dollars are allocated to fleet upgrades. Programs such as Canada’s Zero Emission Transit Fund reimburse lighting conversions alongside driveline swaps, making LEDs a quick-win safety enhancement. Specialty shops offer plug-and-play projector modules that meet FMVSS beam-pattern rules, easing adoption barriers.
New installations dominate with 61.10% share because every fresh production vehicle now ships with some form of LED. Automakers push integrated daytime running lamps and animation-capable rear clusters as standard on mid-tier trims. Lower component prices from scale production enable OEMs to cascade features once reserved for luxury nameplates, sustaining lead volumes within the North America automotive LED lighting market.

By Application: Interior Innovation Drives Premium Experiences
Exterior lighting retained 77.20% revenue share in 2025, fueled by headlamp mandates and styling refresh cycles. Adaptive pixel modules command premium prices that offset slowing unit growth. Sequential tail lamps and animated welcome signatures have spread from luxury to mass-market SUVs, signaling the democratization of features.
Interior systems exhibit the fastest trajectory at 4.62% CAGR through 2031. ams OSRAM and Valeo prototype modules that synchronize mood lighting with gesture sensors, creating context-aware cabins. Dome and map lamps swap incandescent bulbs for long-life LEDs, while ambient strips offer 64-color palettes that let occupants personalize the ride's ambiance. Infotainment backlights require tight color fidelity to ensure displays remain legible across day-night cycles, prompting suppliers to refine binning and thermal control.
Geography Analysis
The United States accounted for 71.95% of North America automotive LED lighting market size in 2025 and maintains leadership through 2031. Federal approval of adaptive driving beams unlocked pent-up demand, and EPA’s USD 5 billion Clean School Bus Program underwrites large retrofit orders. Domestic SiC expansion by Wolfspeed in North Carolina strengthens supply resilience and encourages OEMs to specify high-power matrix modules. Despite market maturity in premium segments, ongoing electrification and V2X pilots sustain moderate growth.
Canada closely follows U.S. regulations, enabling platform carry-over and economies of scale. The Zero Emission Transit Fund backs LED retrofits on urban fleets, and cold climates favor instant-on lamps that conserve battery charge in sub-zero starts. Provincial incentives for heated headlamp lenses help mitigate snow buildup, thereby promoting the adoption of embedded carbon-nanotube defroster films.
Mexico posts the fastest CAGR at 5.28% to 2031 as it evolves from a low-cost assembler to an innovation node. More than USD 2.5 billion in 2024 auto-parts investment upgraded local electronics capacity, and EV output surpassed 200,000 units. Continental’s AUMOVIO reconfiguration aligns seven Mexican plants toward advanced architectures that rely on high-brightness LEDs. Supply-chain localization extends northward, with Hyundai’s USD 5.8 billion steel complex in Louisiana supporting shared raw-material streams. Cross-border integration and tax advantages anchor Mexico’s rising profile within the North America automotive LED lighting market.
Competitive Landscape
Established suppliers hold a technology lead through tight OEM programs and broad IP portfolios. Valeo’s 20 million-unit ADAS camera milestone highlights economies achievable when lighting and sensing portfolios merge. ams OSRAM raised EUR 500 million (USD 545 million) in senior notes to fund minor share buybacks and accelerate R&D for automotive LEDs and sensors. Partnerships such as Ennostar-Valeo’s Mini LED matrix display tie optics to communication functions, reinforcing barriers to entry.
OEMs are increasingly patenting lighting inventions themselves, as evidenced by Rivian’s heated lens filings and Ford’s lidar-in-lamp concepts, signaling a shift where automakers directly shape next-generation modules. Smaller vendors are finding opportunities in thermal solutions for heavy-duty trucks and retrofit-grade beam correctors, niches that are not yet fully addressed by Tier-1 giants.
Consolidation trends emerge as suppliers strive to provide end-to-end systems-from LEDs and drivers to sensing and software, aligning with the software-defined vehicle roadmap. Those lacking a sensor or over-the-air update capability risk losing RFQ invitations. Nonetheless, the North America automotive LED lighting market remains moderately concentrated; top five players command an estimated 58% combined share, leaving room for agile specialists.
North America Automotive LED Lighting Industry Leaders
Marelli Holdings Co., Ltd.
Stanley Electric Co., Ltd.
Valeo SA
Hella GmbH & Co. KGaA
ams-OSRAM AG
- *Disclaimer: Major Players sorted in no particular order

Recent Industry Developments
- September 2025: Ennostar Group and Valeo unveiled Mini LED exterior matrix displays at IAA Mobility 2025, the first public demo of integrated lighting-display technology for vehicles.
- July 2025: ams OSRAM placed EUR 500 million (USD 545 million) senior notes to pre-finance OSRAM minority put-options and partly repurchase 2027 convertibles.
- May 2025: Valeo produced its 20 millionth front camera system featuring Mobileye EyeQ processors.
- March 2025: ams OSRAM launched LEDguardian ROAD FLARE Signal V16 IoT warning light with DGT 3.0 certification for connected roadside safety.


North America Automotive LED Lighting Market Report Scope
Daytime Running Lights (DRL), Directional Signal Lights, Headlights, Reverse Light, Stop Light, Tail Light, Others are covered as segments by Automotive Utility Lighting. 2 Wheelers, Commercial Vehicles, Passenger Cars are covered as segments by Automotive Vehicle Lighting. United States are covered as segments by Country.| OEM |
| Aftermarket |
| Passenger Cars |
| Light Commercial Vehicles |
| Heavy Commercial Vehicles |
| Two-Wheelers |
| New Installation |
| Retrofit Installation |
| Exterior Lighting | Headlamps |
| Daytime Running Lights | |
| Taillights | |
| Fog Lamps | |
| Turn Signals | |
| Other Exterior Lightings | |
| Interior Lighting | Dome and Map Lights |
| Ambient Lighting | |
| Instrument Cluster and Infotainment Backlighting | |
| Others Interior Lightings |
| United States |
| Canada |
| Mexico |
| By Sales Channel | OEM | |
| Aftermarket | ||
| By Vehicle Type | Passenger Cars | |
| Light Commercial Vehicles | ||
| Heavy Commercial Vehicles | ||
| Two-Wheelers | ||
| By Installation Type | New Installation | |
| Retrofit Installation | ||
| By Application | Exterior Lighting | Headlamps |
| Daytime Running Lights | ||
| Taillights | ||
| Fog Lamps | ||
| Turn Signals | ||
| Other Exterior Lightings | ||
| Interior Lighting | Dome and Map Lights | |
| Ambient Lighting | ||
| Instrument Cluster and Infotainment Backlighting | ||
| Others Interior Lightings | ||
| By Country | United States | |
| Canada | ||
| Mexico | ||


Market Definition
- INDOOR LIGHTING - It incorporates all LED based lamps and fixtures/luminaire that are used to illuminate indoor section of residential, commercial, industrial buildings and agricultural lighting. LED offers efficient brightness with higher durability in comparison to other lighting technology.
- OUTDOOR LIGHTING - It incorporates the LED lighting fixtures that is used for illumination for exterior/outdoor illumination. For instance, LED lighting fixtures used to illuminate streets and highways, transport hubs, stadiums and other public places such as parking spaces.
- AUTOMOTIVE LIGHTING - It refers to the lighting fixtures installed for illumination and signaling purposes. It is used in both exterior and interior lighting of the vehicle. Headlamps, fog lamp, daytime running light (DRLs) are examples of exterior light whereas cabin light are interior lights.
- END USER - It refers to the end use application area where the LED fixture will be installed. For instance, in terms of indoor lighting, we have residential, commercial and industrial as end user category. For automotive lighting, primary end user considered are automotive manufacturers and aftermarket sale
| Keyword | Definition |
|---|---|
| Lumen | Lumen is a unit of luminous flux in the International System of Units that is equal to the amount of light given out through a solid angle by a source of one-candela intensity radiating equally in all directions. |
| Footcandle | A foot-candle (or foot-candle, fc, lm/ft2, or ft-c) is a measurement of light intensity. One foot-candle is defined as enough light to saturate a one-foot square with one lumen of light. |
| Colour Rendering Index (CRI) | Color Rendering Index (CRI) is a measurement of how natural colors render under an artificial white light source when compared with sunlight. The index is measured from 0-100, with a perfect 100 indicating that colors of objects under the light source appear the same as they would under natural sunlight. |
| Luminous flux | Luminous flux is a measure of the power of visible light produced by a light source or light fitting. It is measured in lumens (lm). |
| Annual Energy Cost | Annual Energy Cost means the average daily energy consumption multiplied by 365 (days per year), expressed in kilowatt hour per year (kWh/a). |
| Constant voltage drivers | Constant voltage drivers are designed for a single direct current (DC) output voltage. Most common constant voltage drivers (or Power Supplies) are 12VDC or 24VDC. An LED light that is rated for constant voltage usually specifies the amount of input voltage it needs to operate correctly. |
| Constant Current Driver | Constant current LED drivers are designed for a designated range of output voltages and a fixed output current (mA). LEDs that are rated to operate on a constant current driver require a designated supply of current usually specified in milliamps (mA) or amps (A). These drivers vary the voltage along an electronic circuit which allows current to remain constant throughout the LED system. |
| Minimum Energy Performance Standards (MEPS) | Minimum Energy Performance Standards specify the minimum level of energy performance that appliances and equipment must meet or exceed before they can supply or used for commercial purposes. |
| Luminous Efficacy | Luminous efficacy is a measurement commonly used in the lighting industry that indicates the ability of a light source to emit visible light using a given amount of power. |
| Solid State Lighting | Solid-state lighting (SSL) is a type of lighting that uses semiconductor light-emitting diodes (LEDs), organic light-emitting diodes (OLED), or polymer light-emitting diodes (PLED) as sources of illumination rather than electrical filaments, plasma (used in arc lamps such as fluorescent lamps), or gas. |
| Rated Lamp Life | Lamp life, also referred to as rated life, is the time in hours a lamp will last before a percentage of lamps will burn out. |
| Color Temperature | Colour temperature is a scale that measures how ‘warm’ (yellow) or ‘cool’ (blue) the light from a particular source is. It is measured in degrees of the Kelvin scale (abbreviated to K), and the higher the number, the ‘cooler’ the light. The lower the ‘K’ number, the ‘warmer’ the light. |
| Ingress Protection rating (IP rating) | The IP (Ingress Protection) rating of a bulb or light fixture declares the level of protection it has against dirt and water. |
| Fidelity Index | The general colour fidelity index, Rf, represents how closely the colour appearances of the entire sample set are reproduced (rendered) on average by a test light as compared to those under a reference illuminant. |
| Gamut Index | The gamut area is defined as “the area enclosed by a set of test color samples illuminated by a light source, in a two-dimensional chromaticity diagram or a plane of color space.”1 Within a defined color space, a “gamut” describes the subset of colors that can be perceived under specific lighting conditions. |
| Binning | In the lighting industry, the act of "binning" of LEDs is the process of sorting LEDs by certain characteristics, such as color, voltage, and brightness. |
| Accent lighting | Accent lighting, also called highlighting, emphasizes objects by focusing light directly on them. Accent lighting is used inside and outside the home to feature locations such as an entrance or to create dramatic effects. |
| Dimmable driver | A dimming driver has two functions: As a driver, it converts the 230V AC mains input to a low voltage DC output. As a dimmer, it reduces the amount of electrical energy flowing to the LEDs, thereby causing them to dim. |
| Flicker | Flicker is the repeated and frequent variation in the output of a light source over time. |
| Fluorescent | A property of materials defined as the ability to emit light after absorbing electromagnetic radiation such as visible or UV light. |
| Candela | The candela is the unit of luminous intensity in the International System of Units. It measures the light output per unit solid angle emitted from a light source in a specific direction. |
| LUX | Lux is used to measure the amount of light output in a given area - one lux is equal to one lumen per square meter. It enables us to measure the total "amount" of visible light present and the intensity of the illumination on a surface. |
| Uniformity (U0) | The uniformity of lighting has significant effects on visual performance in both indoor and outdoor areas. Uniformity (represented as U0) value can be found by dividing the minimum brightness (Emin) resulting from calculations according to the current lighting order, to the average brightness value (Eavg). |
| Visible Light Spectrum | The visible light spectrum is the segment of the electromagnetic spectrum that the human eye can view. More simply, this range of wavelengths is called visible light. Typically, the human eye can detect wavelengths from 380 to 700 nanometers. |
| Ambient Temperature | Ambient Temperature is the temperature of the air surrounding an electrical enclosure. |
| Current-controlled dimming control | Current-controlled dimming controls LED brightness by varying the applied current using a 0-10V dimmer. Current-controlled dimming is smooth and HD-video friendly. It can only dim to a minimum of 5% of light output. |
| Design Light Consortium | It is a partnership of energy efficiency stakeholders in the United States and Canada to “promote quality, performance and energy efficient lighting solutions for the commercial sector”. |
| Pulse Width Modulation | Pulse-width modulation, or pulse-duration modulation, is a method of controlling the average power delivered by an electrical signal. |
| Surface Mounted Device | A surface mount device (SMD) is an electronic device whose components are mounted or placed directly on the surface of a printed circuit board. |
| Alternating Current | Alternating current is an electric current which periodically reverses direction and changes its magnitude continuously with time, in contrast to direct current, which flows only in one direction. |
| Direct Current | Direct current (DC) is an electric current that is uni-directional, so the flow of charge is always in the same direction. |
| Beam Angle | Beam angle (also called beam spread) is a measure of how light is distributed. On any plane perpendicular to the centerline of the light, the beam angle is the angle between two rays where the light intensity is 50% of the maximum light intensity. |
| LED Based Solar High Mast Lighting Systems | A Solar LED High Mast Light is a raised source of High illumination lights (6~8 lights) and with high intensity on the middle of major junctions (Ring roads, Outer Ring roads), turned on or lit automatically in the absence of light (at specified timings or at periodic times, every night). |
| Surface Mounted Diode (SMD) LEDs | A surface mount diode is a type that emits light and is flat mounted and soldered onto a circuit board. |
| Chip on Board (COB) LEDs | A COB LED is basically multiple LED chips (usually 9 or more) glued directly onto a substrate by the manufacturer to form a single module. |
| Dual In-Line Package (DIP) LEDs | A dual in-line package (DIP or DIL) is an electronic component package with a rectangular case and two parallel rows of electrical connector pins. |
| Graphene LED Lights | A graphene LED light bulb is simply an LED light bulb where the filament has been coated in graphene. A graphene LED bulb is reported to be 10% more efficient than regular LED light bulbs and they are cheaper to manufacture and buy. |
| LED Corn Bulbs | LED Corn lights are designed as an energy efficient alternative to high intensity discharge (HID) and SON lamps. It uses a large number of LEDs on a metal structure to provide sufficient light. This arrangement of LEDs looks a lot like a corn cob, hence the name "corn light". |
| Per Capita Income | Per capita income or total income measures the average income earned per person in a given area in a specified year. It is calculated by dividing the area's total income by its total population. Per capita income is national income divided by population size. |
| Charging Stations | A charging station, also known as a charging station or electric vehicle utility, is a power supply that provides electrical energy for charging plug-in electric vehicles. |
| Headlight | A headlight is a light that is mounted on the front of a car and illuminates the road in front of it. Low beam and high beam LED headlights are additional categories for these LED headlights. |
| Day Time Running Light (DRLs) | A daytime running lamp is a white, yellow, or amber lighting device mounted on the front of a road-going motor vehicle or bicycle. |
| Directional Signal Light | Directional signal lights are the front and rear lights on an automobile that flash to show the direction of a turn. |
| Stop Light | A red light that is mounted to the back of a car and turns on when the brakes are used to show that the car is stopped. |
| Reverse Light | The reverse light is at the back of the vehicle to indicate its backward motion. |
| Tail Light | A red light that can be seen in the dark is mounted on the rear of a road vehicle. Stop, reverse, and directional signal lights are all part of it. |
| Fog Light | Bright lights in automobiles used to increase visibility on the road in foggy conditions or to warn other drivers of the presence of the vehicle. |
| Passenger Vehicle | A passenger vehicle is a road vehicle, other than a moped or a motorcycle, intended for the transportation of people and designed for up to 8 to 9 seats. |
| Commercial Vehicle | A commercial vehicle (Bus, Truck, Van) is any type of motor vehicle used to transport goods or pay passengers. |
| Two Wheelers (2W) | A two-wheeler is a vehicle that runs on two wheels. |
| Streets & Roadways | Both roads and streets refer to hard, flat surfaces on the ground on which vehicles, people, and animals can travel. Since streetways are usually in cities and towns, they often have houses and buildings on both sides. The roadway is in the countryside and sometimes passes through forests and fields |
| Horticulture Lighting | Horticulture is the science and art of sustainably growing, producing, marketing and using high quality, intensively cultivated food and ornamental plants. |


Research Methodology
Mordor Intelligence has followed the following methodology in all our data center reports.
- Step 1: Raw Data Collection: To understand the market, initially, all crtical data points were identified. Critical information about countries and regions of interest including Per-capita Income, Population, Automotive Production, Interest rate on Auto-Loans, Number of Automobiles on Road, Total LED Import, Lighting Electricity Consumption among others were recorded or estimated based on internal calculations.
- Step 2: Identify Key Variables: To build a robust forecasting model, key variables such as Number of Households, Automotive Production, Road Networks among others were identified. Through an iterative process, the variables required for the market forecast were set, and the model was built using these variables.
- Step 3: Build a Market Model: Based on data and critical industry trend data (variables), including LED pricing, LED penetration rate, and project macro and micor economic factors were utilized for building the market forecasting.
- Step 4: Validate and Finalize: In this crucial step, all market numbers and variables derived through an internal mathematical model were validated through an extensive network of primary research experts from all the markets studied. The respondents are selected across levels and functions to generate a holistic picture of the market studied.
- Step 5: Research Outputs: Syndicated Reports, Custom Consulting Assignments, Databases & Subscription Platforms


