United States Automotive LED Lighting Market Size and Share
Market Overview
| Study Period | 2020 - 2031 |
|---|---|
| Forecast Data Period | 2026 - 2031 |
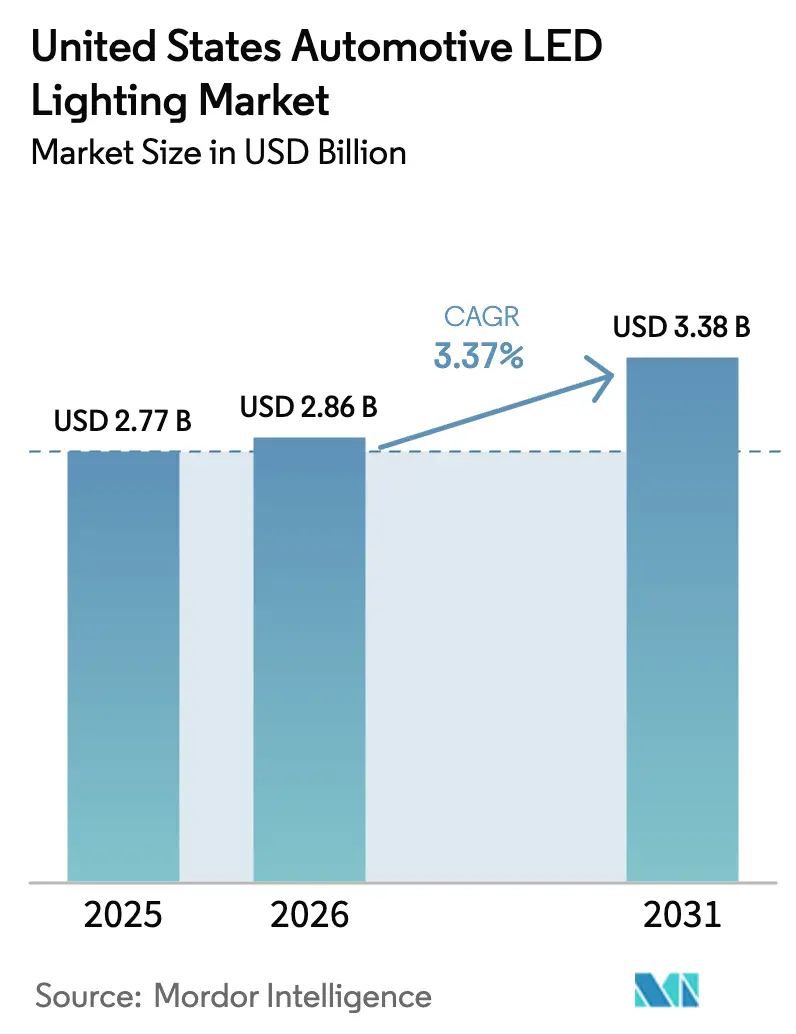
| Base Year Market Size (2025) | USD 2.77 Billion |
| Market Size (2026) | USD 2.86 Billion |
| Market Size (2031) | USD 3.38 Billion |
| Growth Rate (2026 - 2031) | 3.37% CAGR |
| Market Concentration | Low |
Major Players *Disclaimer: Major Players sorted in no particular order Image © Mordor Intelligence. Reuse requires attribution under CC BY 4.0. | |
United States Automotive LED Lighting Market Analysis by Mordor Intelligence
The United States automotive LED lighting market size is expected to grow from USD 2.77 billion in 2025 to USD 2.86 billion in 2026 and is forecast to reach USD 3.38 billion by 2031 at 3.37% CAGR over 2026-2031. The market’s measured growth reflects a transition from volume-led expansion to value creation built on technology upgrades, design integration, and tighter regulatory standards. OEM channels continue to dominate procurement as vertically integrated suppliers secure semiconductor allocations, while online aftermarket platforms expand their geographic reach and accelerate the adoption of retrofits. Passenger-car electrification, adaptive driving beam approval, and rising ambient lighting sophistication collectively strengthen the demand base. At the same time, tariff volatility and counterfeit imports remain headwinds that reward suppliers who are able to localize production and certify its performance.
Key Report Takeaways
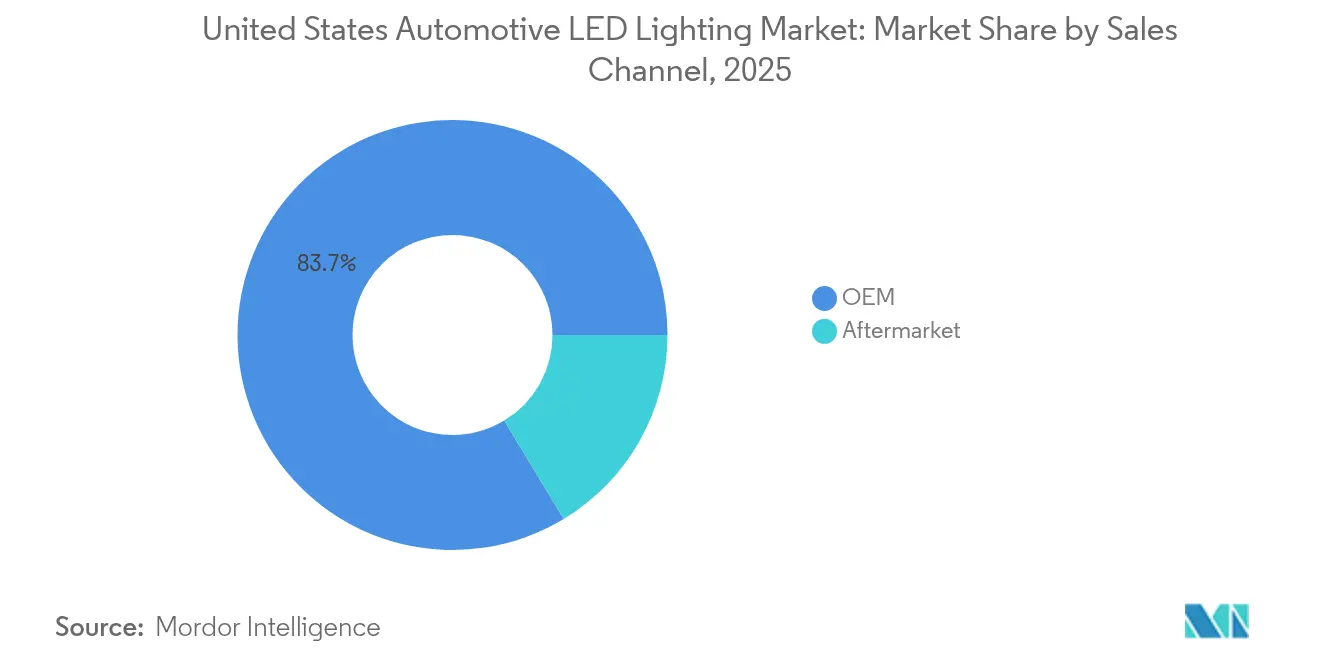
- By sales channel, OEMs commanded 83.65% of the United States automotive LED lighting market share in 2025; aftermarket distribution recorded the fastest CAGR at 4.12% through 2031.
- By vehicle type, passenger cars led with a 69.35% revenue share in 2025, while the same segment is expected to advance at a 6.85% CAGR to 2031.
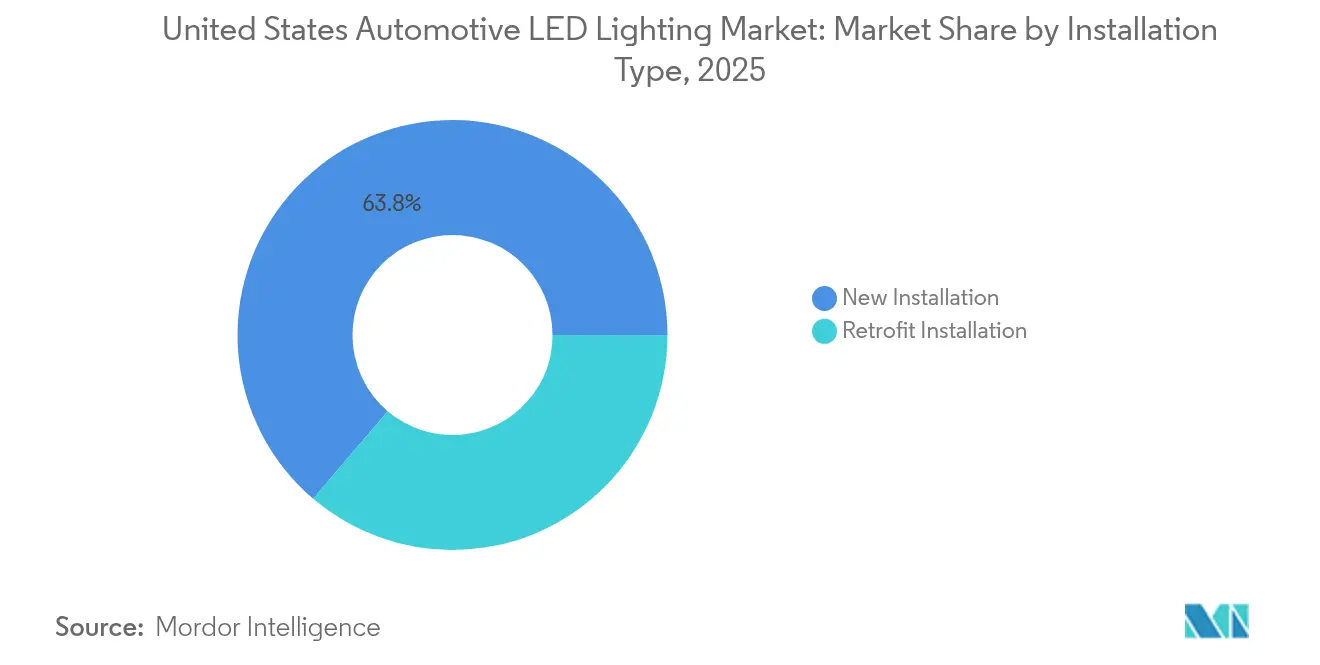
- By installation type, new installations captured 63.78% of the United States automotive LED lighting market size in 2025; retrofit installations grew at a 4.55% CAGR during the forecast period.
- By application, exterior lighting accounted for a 77.95% share of the United States automotive LED lighting market size in 2025, and interior lighting is progressing at a 4.86% CAGR through 2031.
Note: Market size and forecast figures in this report are generated using Mordor Intelligence’s proprietary estimation framework, updated with the latest available data and insights as of 2026.
United States Automotive LED Lighting Market Trends and Insights
Drivers Impact Analysis*
| Driver | (~) % Impact on CAGR Forecast | Geographic Relevance | Impact Timeline |
|---|---|---|---|
| Rapid LED Cost Decline and Performance Improvement | +0.8% | National, with early adoption in premium vehicle segments | Medium term (2-4 years) |
| Stricter U.S. FMVSS / NHTSA Visibility and Safety Mandates | +0.6% | National, enforced through federal vehicle certification | Short term (≤ 2 years) |
| OEM Adoption of Adaptive-Driving-Beam and Matrix Headlamps | +0.5% | National, concentrated in luxury and EV segments | Medium term (2-4 years) |
| Growth of EV and Premium Vehicle Sales Mix in the U.S. | +0.7% | National, with higher penetration in California, Northeast | Long term (≥ 4 years) |
| Surge in E-Commerce-Led LED Aftermarket Sales | +0.4% | National, with rural market penetration advantages | Short term (≤ 2 years) |
| Smart Cabin and Ambient-Lighting Integration with Infotainment | +0.3% | National, premium segment focus expanding to mainstream | Medium term (2-4 years) |
| Source: Mordor Intelligence | |||
Rapid LED cost decline and performance improvement
Automotive-grade LED efficiencies increased to 200 lumens per watt in 2024 from 150 lumens per watt in 2022, reducing total system cost and enabling volume standardization in mid-market vehicle lines. [1]ams OSRAM, “ALIYOS LED-on-foil Technology Redefines Automotive Lighting,” ams-osram.com Cost reductions accelerate as package miniaturization, flexible substrates, and microLED die bonding cut material usage and assembly time. OEMs consequently migrate entire trim portfolios to LED headlamps and signature lighting without raising price points, reinforcing a virtuous cycle that further scales production and compresses unit costs. Suppliers deploying ultra-thin LED-on-foil arrays also unlock styling freedom for new daytime running light motifs, intensifying brand differentiation.
Stricter U.S. FMVSS / NHTSA visibility mandates
Updated FMVSS 108 provisions took effect in 2024, granting legal status to adaptive driving beam technologies and imposing tighter photometric thresholds on replacement bulbs. Federal enforcement elevates demand for compliant light sources that meet glare, intensity, and beam-pattern criteria, relegating non-certified imports to narrower channels. [2]U.S. Immigration and Customs Enforcement, “HSI Los Angeles Special Agents Arrest 8 in Customs Fraud Scheme,” ice.gov OEMs gain a first-mover advantage because their validation infrastructure aligns with NHTSA conformity testing, while aftermarket vendors with full DOT documentation retain market access. Regulatory certainty also accelerates model-year refresh cycles, as automakers emphasize safety compliance in their marketing communications.
OEM adoption of adaptive-driving-beam and matrix headlamps
Pixelated headlamp modules capable of shaping beams around oncoming traffic migrated from European luxury models to U.S. showrooms following NHTSA approval. Tesla activated dormant matrix functionality in existing Model S and Model X vehicles through over-the-air updates, demonstrating how software can monetize pre-installed hardware. Market uptake intensifies as up to 25,600 controllable LEDs per lamp enable glare-free high-beam driving that improves nighttime visibility. Integration with forward cameras and radar enhances adaptive cruise and lane-keeping performance, raising safety rankings and supporting higher vehicle price realization.
Growth of EV and premium-vehicle sales mix in the United States
The Edison Electric Institute projects the national EV fleet will jump from 4.5 million in 2023 to 78.5 million by 2035, lifting the EV share of light-duty sales to 46% by 2030. EV architectures favor LEDs for energy efficiency and design flexibility, resulting in close to 95% LED penetration compared to 60% in internal-combustion models. Premium marques further enhance LED content with animated welcome graphics, dynamic turn signals, and configurable ambient interiors that reinforce its brand identity. The powertrain transition, therefore, sustains LED demand independent of total vehicle output.
Restraints Impact Analysis*
| Restraint | (~) % Impact on CAGR Forecast | Geographic Relevance | Impact Timeline |
|---|---|---|---|
| Semiconductor and Specialty Polymer Supply Volatility | -0.9% | National, with supply chain concentration in Asia-Pacific | Short term (≤ 2 years) |
| High Calibration Cost for ADAS-Compatible Retrofits | -0.4% | National, affecting aftermarket and service segments | Medium term (2-4 years) |
| Counterfeit / Non-Compliant LED Imports | -0.3% | National, concentrated at major port entry points | Short term (≤ 2 years) |
| Tariff Risk on Asian LED Modules and Driver ICs | -0.6% | National, affecting import-dependent manufacturers | Medium term (2-4 years) |
| Source: Mordor Intelligence | |||
Semiconductor and specialty-polymer supply volatility
Foundries are prioritizing high-margin AI accelerators, which constrains the production of automotive-grade driver ICs and power-management chips vital for LED modules. Lead times for mature-node wafers extend beyond 40 weeks, pressuring smaller lighting suppliers who are unable to reserve capacity. At the materials level, epoxy encapsulants and polycarbonate optics experience spot-price swings tied to petrochemical feedstock dynamics, thereby increasing bill-of-materials risk. Wolfspeed’s USD 750 million CHIPS Act grant to build U.S. silicon-carbide capacity partially mitigates bottlenecks for domestic tier-ones that align early with the fab’s allocation roadmap. [3]Wolfspeed, “Wolfspeed Receives $750 M in CHIPS Act Funding,” wolfspeed.com
High calibration cost for ADAS-compatible retrofits
Adaptive headlamp upgrades require camera aiming and software coding that often exceed USD 500 per vehicle and demand specialized equipment. Independent garages struggle to justify capital outlays, forcing consumers toward dealer networks where labor rates are higher, limiting retrofit volumes and elongating payback periods. This restraint mainly affects cost-conscious owners of mid-cycle vehicles who might otherwise migrate to advanced LED systems.
*Our forecasts treat driver/restraint impacts as directional, not additive. The impact forecasts reflect baseline growth, mix effects, and variable interactions.
Segment Analysis
By Sales Channel: OEM dominance drives aftermarket innovation
OEM channels held 83.65% of United States automotive LED lighting market share in 2025 as automakers embedded factory-calibrated modules that align with vehicle electrical architectures and ADAS sensors. The segment anchors overall shipment volumes because every new passenger-car build includes LED daytime-running lights and a rising share of full LED headlamps. Meanwhile, the aftermarket grows at a faster 4.12% CAGR, fueled by e-commerce convenience and owners desire to refresh legacy fleets with brighter, energy-efficient solutions. Retrofit kits for halogen replacement account for a significant portion of the upside, although regulation is pushing buyers toward DOT-approved SKUs. Over-the-air enablement of matrix features in pre-installed hardware exemplifies how OEM sales can generate post-purchase revenue, thereby blurring the strict boundaries of traditional channels.


By Vehicle Type: Passenger-car electrification accelerates LED adoption
Passenger cars supplied 69.35% of revenue in 2025 and expand at 6.85% CAGR, highlighting how the leading segment remains the growth engine. EV models, such as compact crossovers, incorporate signature light bars, sequential turn signals, and parametric daytime running lights, raising the per-vehicle diode count and driving the United States automotive LED lighting market size ahead of the overall car-production curve. Light commercial vehicles adopt LEDs for duty-cycle efficiency, yet the upgrade pace is steadier due to fleet budget cycles. Heavy commercial categories lag because the lifespan advantages of conventional sealed-beam units offset the energy savings of LEDs in long-haul duty.
By Installation Type: Retrofit growth challenges new-installation dominance
New installation kits secured a 63.78% share in 2025, as factory fitments satisfy warranty and ADAS integration requirements. Retrofit kits, however, post 4.55% CAGR as consumers seek the look and safety of modern illumination without buying new cars. Retailers bundle professional installation with beam-aim checks to overcome regulatory scrutiny, and subscription-based calibration tools help local garages manage complex alignments. The result is a two-tier market, where premium adaptive systems remain mostly factory-installed, while static, high-output retrofits expand the enthusiast base.
By Application: Interior lighting innovation challenges exterior dominance
Exterior lamp systems—headlamps, taillights, and daytime lights- retained 77.95% share in 2025 because they are mandatory safety elements. Yet interior applications, paced by ambient strips synchronized with infotainment, show 4.86% CAGR as carmakers monetize personalization. Dome, map, and footwell lamps progressively migrate to addressable RGB modules, controlled through apps that allow owners to select themes. In smart cabins, mini LED backlights for curved displays and VCSEL arrays for driver monitoring widen diode demand, redirecting value emphasis from lumen output to sensor fusion and user experience.
Geography Analysis
California, New York, and other Northeast states drive outsized LED penetration on account of zero-emission mandates and higher disposable income. California’s Advanced Clean Cars II regulation mandates 100% ZEV sales by 2035, embedding LED lighting as a default specification on new electric platforms. Silicon Valley OEMs concentrate product development there, pulling a parallel supply ecosystem of lens molders and PCB assemblers. Southern states, in contrast, gain from foreign direct investment; HELLA expanded its NAFTA manufacturing footprint to serve U.S. assembly plants efficiently. The Midwest benefits from logistics centrality, with tier-two optic houses near Detroit supporting just-in-sequence deliveries to domestic OEMs. Rural regions, which once lagged technology adoption, now leverage e-commerce for upgrade kits delivered directly to owners, democratizing LED benefits.
Port-of-entry enforcement at Los Angeles and Long Beach constrains illicit shipments, resulting in tighter coastal supply but improved product quality. States such as Massachusetts follow with roadside compliance checks, influencing local installer behavior even without federal statute mirror. Federal CHIPS funding unlocks silicon-carbide and GaN device production in North Carolina and Arizona, reducing reliance on Pacific Rim imports and buffering tariff risk. The geographic mosaic suggests that while coastal regulation and income profiles set the initial pace, emerging domestic semiconductor nodes and online retail networks will diffuse LED lighting across all regions.
Competitive Landscape
The market shows moderate fragmentation. Tier-one companies such as FORVIA HELLA, AMS OSRAM, and Stanley benefit from deep OEM program pipelines, proprietary reliability testing, and vertically integrated diode-to-module capabilities. Technology roadmaps now emphasize pixel density, thermal management, and software controls that create defensible differentiation. ams OSRAM’s ALIYOS LED-on-foil platform layers printed conductors on flexible substrates to place lighting under complex surfaces, while HELLA’s Digital Light SSL HD doubles pixel counts relative to prior matrix generations.
Niche entrants leverage microLED or VCSEL specialization to carve a share in premium dashboards and driver-monitoring units. Power-device producers, such as Wolfspeed, vertically integrate to pair silicon-carbide MOSFETs with LED driver reference designs, courting OEMs concerned about supply resilience. Patent positioning intensifies: pixel-level current control, multi-optic beam shaping, and in-cabin color-sync algorithms emerge as contested fields. Supply-chain security has become a significant requirement, prompting leading suppliers to map the provenance of raw materials and maintain buffer stock in continental warehouses.
United States Automotive LED Lighting Industry Leaders
Marelli Holdings Co., Ltd.
Stanley Electric Co., Ltd.
ams OSRAM AG
Valeo SE
Hella GmbH & Co. KGaA
- *Disclaimer: Major Players sorted in no particular order


Recent Industry Developments
- January 2025: ams OSRAM introduced ALIYOS LED-on-foil technology enabling ultra-thin arrays behind diverse surface materials, adding styling flexibility for interior and exterior applications.
- January 2025: HARMAN unveiled Ready Display products using Samsung Neo QLED and Blue Mini LED for HDR10+ automotive cabins, expanding LED backlight demand in premium models.
- January 2025: Homeland Security Investigations Los Angeles disrupted a USD 1.3 billion counterfeit-goods scheme that included automotive LED components, highlighting the need for traceable supply chains.
- December 2024: Wolfspeed secured USD 750 million CHIPS Act funding to enlarge domestic silicon-carbide capacity for automotive power electronics.


United States Automotive LED Lighting Market Report Scope
Daytime Running Lights (DRL), Directional Signal Lights, Headlights, Reverse Light, Stop Light, Tail Light, Others are covered as segments by Automotive Utility Lighting. 2 Wheelers, Commercial Vehicles, Passenger Cars are covered as segments by Automotive Vehicle Lighting.| OEM |
| Aftermarket |
| Passenger Cars |
| Light Commercial Vehicles |
| Heavy Commercial Vehicles |
| Two-Wheelers |
| New Installation |
| Retrofit Installation |
| Exterior Lighting | Headlamps |
| Daytime Running Lights | |
| Taillights | |
| Fog Lamps | |
| Turn Signals | |
| Other Exterior Lightings | |
| Interior Lighting | Dome and Map Lights |
| Ambient Lighting | |
| Instrument Cluster and Infotainment Backlighting | |
| Others Interior Lightings |
| By Sales Channel | OEM | |
| Aftermarket | ||
| By Vehicle Type | Passenger Cars | |
| Light Commercial Vehicles | ||
| Heavy Commercial Vehicles | ||
| Two-Wheelers | ||
| By Installation Type | New Installation | |
| Retrofit Installation | ||
| By Application | Exterior Lighting | Headlamps |
| Daytime Running Lights | ||
| Taillights | ||
| Fog Lamps | ||
| Turn Signals | ||
| Other Exterior Lightings | ||
| Interior Lighting | Dome and Map Lights | |
| Ambient Lighting | ||
| Instrument Cluster and Infotainment Backlighting | ||
| Others Interior Lightings | ||


Market Definition
- INDOOR LIGHTING - It incorporates all LED based lamps and fixtures/luminaire that are used to illuminate indoor section of residential, commercial, industrial buildings and agricultural lighting. LED offers efficient brightness with higher durability in comparison to other lighting technology.
- OUTDOOR LIGHTING - It incorporates the LED lighting fixtures that is used for illumination for exterior/outdoor illumination. For instance, LED lighting fixtures used to illuminate streets and highways, transport hubs, stadiums and other public places such as parking spaces.
- AUTOMOTIVE LIGHTING - It refers to the lighting fixtures installed for illumination and signaling purposes. It is used in both exterior and interior lighting of the vehicle. Headlamps, fog lamp, daytime running light (DRLs) are examples of exterior light whereas cabin light are interior lights.
- END USER - It refers to the end use application area where the LED fixture will be installed. For instance, in terms of indoor lighting, we have residential, commercial and industrial as end user category. For automotive lighting, primary end user considered are automotive manufacturers and aftermarket sale
| Keyword | Definition |
|---|---|
| Lumen | Lumen is a unit of luminous flux in the International System of Units that is equal to the amount of light given out through a solid angle by a source of one-candela intensity radiating equally in all directions. |
| Footcandle | A foot-candle (or foot-candle, fc, lm/ft2, or ft-c) is a measurement of light intensity. One foot-candle is defined as enough light to saturate a one-foot square with one lumen of light. |
| Colour Rendering Index (CRI) | Color Rendering Index (CRI) is a measurement of how natural colors render under an artificial white light source when compared with sunlight. The index is measured from 0-100, with a perfect 100 indicating that colors of objects under the light source appear the same as they would under natural sunlight. |
| Luminous flux | Luminous flux is a measure of the power of visible light produced by a light source or light fitting. It is measured in lumens (lm). |
| Annual Energy Cost | Annual Energy Cost means the average daily energy consumption multiplied by 365 (days per year), expressed in kilowatt hour per year (kWh/a). |
| Constant voltage drivers | Constant voltage drivers are designed for a single direct current (DC) output voltage. Most common constant voltage drivers (or Power Supplies) are 12VDC or 24VDC. An LED light that is rated for constant voltage usually specifies the amount of input voltage it needs to operate correctly. |
| Constant Current Driver | Constant current LED drivers are designed for a designated range of output voltages and a fixed output current (mA). LEDs that are rated to operate on a constant current driver require a designated supply of current usually specified in milliamps (mA) or amps (A). These drivers vary the voltage along an electronic circuit which allows current to remain constant throughout the LED system. |
| Minimum Energy Performance Standards (MEPS) | Minimum Energy Performance Standards specify the minimum level of energy performance that appliances and equipment must meet or exceed before they can supply or used for commercial purposes. |
| Luminous Efficacy | Luminous efficacy is a measurement commonly used in the lighting industry that indicates the ability of a light source to emit visible light using a given amount of power. |
| Solid State Lighting | Solid-state lighting (SSL) is a type of lighting that uses semiconductor light-emitting diodes (LEDs), organic light-emitting diodes (OLED), or polymer light-emitting diodes (PLED) as sources of illumination rather than electrical filaments, plasma (used in arc lamps such as fluorescent lamps), or gas. |
| Rated Lamp Life | Lamp life, also referred to as rated life, is the time in hours a lamp will last before a percentage of lamps will burn out. |
| Color Temperature | Colour temperature is a scale that measures how ‘warm’ (yellow) or ‘cool’ (blue) the light from a particular source is. It is measured in degrees of the Kelvin scale (abbreviated to K), and the higher the number, the ‘cooler’ the light. The lower the ‘K’ number, the ‘warmer’ the light. |
| Ingress Protection rating (IP rating) | The IP (Ingress Protection) rating of a bulb or light fixture declares the level of protection it has against dirt and water. |
| Fidelity Index | The general colour fidelity index, Rf, represents how closely the colour appearances of the entire sample set are reproduced (rendered) on average by a test light as compared to those under a reference illuminant. |
| Gamut Index | The gamut area is defined as “the area enclosed by a set of test color samples illuminated by a light source, in a two-dimensional chromaticity diagram or a plane of color space.”1 Within a defined color space, a “gamut” describes the subset of colors that can be perceived under specific lighting conditions. |
| Binning | In the lighting industry, the act of "binning" of LEDs is the process of sorting LEDs by certain characteristics, such as color, voltage, and brightness. |
| Accent lighting | Accent lighting, also called highlighting, emphasizes objects by focusing light directly on them. Accent lighting is used inside and outside the home to feature locations such as an entrance or to create dramatic effects. |
| Dimmable driver | A dimming driver has two functions: As a driver, it converts the 230V AC mains input to a low voltage DC output. As a dimmer, it reduces the amount of electrical energy flowing to the LEDs, thereby causing them to dim. |
| Flicker | Flicker is the repeated and frequent variation in the output of a light source over time. |
| Fluorescent | A property of materials defined as the ability to emit light after absorbing electromagnetic radiation such as visible or UV light. |
| Candela | The candela is the unit of luminous intensity in the International System of Units. It measures the light output per unit solid angle emitted from a light source in a specific direction. |
| LUX | Lux is used to measure the amount of light output in a given area - one lux is equal to one lumen per square meter. It enables us to measure the total "amount" of visible light present and the intensity of the illumination on a surface. |
| Uniformity (U0) | The uniformity of lighting has significant effects on visual performance in both indoor and outdoor areas. Uniformity (represented as U0) value can be found by dividing the minimum brightness (Emin) resulting from calculations according to the current lighting order, to the average brightness value (Eavg). |
| Visible Light Spectrum | The visible light spectrum is the segment of the electromagnetic spectrum that the human eye can view. More simply, this range of wavelengths is called visible light. Typically, the human eye can detect wavelengths from 380 to 700 nanometers. |
| Ambient Temperature | Ambient Temperature is the temperature of the air surrounding an electrical enclosure. |
| Current-controlled dimming control | Current-controlled dimming controls LED brightness by varying the applied current using a 0-10V dimmer. Current-controlled dimming is smooth and HD-video friendly. It can only dim to a minimum of 5% of light output. |
| Design Light Consortium | It is a partnership of energy efficiency stakeholders in the United States and Canada to “promote quality, performance and energy efficient lighting solutions for the commercial sector”. |
| Pulse Width Modulation | Pulse-width modulation, or pulse-duration modulation, is a method of controlling the average power delivered by an electrical signal. |
| Surface Mounted Device | A surface mount device (SMD) is an electronic device whose components are mounted or placed directly on the surface of a printed circuit board. |
| Alternating Current | Alternating current is an electric current which periodically reverses direction and changes its magnitude continuously with time, in contrast to direct current, which flows only in one direction. |
| Direct Current | Direct current (DC) is an electric current that is uni-directional, so the flow of charge is always in the same direction. |
| Beam Angle | Beam angle (also called beam spread) is a measure of how light is distributed. On any plane perpendicular to the centerline of the light, the beam angle is the angle between two rays where the light intensity is 50% of the maximum light intensity. |
| LED Based Solar High Mast Lighting Systems | A Solar LED High Mast Light is a raised source of High illumination lights (6~8 lights) and with high intensity on the middle of major junctions (Ring roads, Outer Ring roads), turned on or lit automatically in the absence of light (at specified timings or at periodic times, every night). |
| Surface Mounted Diode (SMD) LEDs | A surface mount diode is a type that emits light and is flat mounted and soldered onto a circuit board. |
| Chip on Board (COB) LEDs | A COB LED is basically multiple LED chips (usually 9 or more) glued directly onto a substrate by the manufacturer to form a single module. |
| Dual In-Line Package (DIP) LEDs | A dual in-line package (DIP or DIL) is an electronic component package with a rectangular case and two parallel rows of electrical connector pins. |
| Graphene LED Lights | A graphene LED light bulb is simply an LED light bulb where the filament has been coated in graphene. A graphene LED bulb is reported to be 10% more efficient than regular LED light bulbs and they are cheaper to manufacture and buy. |
| LED Corn Bulbs | LED Corn lights are designed as an energy efficient alternative to high intensity discharge (HID) and SON lamps. It uses a large number of LEDs on a metal structure to provide sufficient light. This arrangement of LEDs looks a lot like a corn cob, hence the name "corn light". |
| Per Capita Income | Per capita income or total income measures the average income earned per person in a given area in a specified year. It is calculated by dividing the area's total income by its total population. Per capita income is national income divided by population size. |
| Charging Stations | A charging station, also known as a charging station or electric vehicle utility, is a power supply that provides electrical energy for charging plug-in electric vehicles. |
| Headlight | A headlight is a light that is mounted on the front of a car and illuminates the road in front of it. Low beam and high beam LED headlights are additional categories for these LED headlights. |
| Day Time Running Light (DRLs) | A daytime running lamp is a white, yellow, or amber lighting device mounted on the front of a road-going motor vehicle or bicycle. |
| Directional Signal Light | Directional signal lights are the front and rear lights on an automobile that flash to show the direction of a turn. |
| Stop Light | A red light that is mounted to the back of a car and turns on when the brakes are used to show that the car is stopped. |
| Reverse Light | The reverse light is at the back of the vehicle to indicate its backward motion. |
| Tail Light | A red light that can be seen in the dark is mounted on the rear of a road vehicle. Stop, reverse, and directional signal lights are all part of it. |
| Fog Light | Bright lights in automobiles used to increase visibility on the road in foggy conditions or to warn other drivers of the presence of the vehicle. |
| Passenger Vehicle | A passenger vehicle is a road vehicle, other than a moped or a motorcycle, intended for the transportation of people and designed for up to 8 to 9 seats. |
| Commercial Vehicle | A commercial vehicle (Bus, Truck, Van) is any type of motor vehicle used to transport goods or pay passengers. |
| Two Wheelers (2W) | A two-wheeler is a vehicle that runs on two wheels. |
| Streets & Roadways | Both roads and streets refer to hard, flat surfaces on the ground on which vehicles, people, and animals can travel. Since streetways are usually in cities and towns, they often have houses and buildings on both sides. The roadway is in the countryside and sometimes passes through forests and fields |
| Horticulture Lighting | Horticulture is the science and art of sustainably growing, producing, marketing and using high quality, intensively cultivated food and ornamental plants. |


Research Methodology
Mordor Intelligence has followed the following methodology in all our data center reports.
- Step 1: Raw Data Collection: To understand the market, initially, all crtical data points were identified. Critical information about countries and regions of interest including Per-capita Income, Population, Automotive Production, Interest rate on Auto-Loans, Number of Automobiles on Road, Total LED Import, Lighting Electricity Consumption among others were recorded or estimated based on internal calculations.
- Step 2: Identify Key Variables: To build a robust forecasting model, key variables such as Number of Households, Automotive Production, Road Networks among others were identified. Through an iterative process, the variables required for the market forecast were set, and the model was built using these variables.
- Step 3: Build a Market Model: Based on data and critical industry trend data (variables), including LED pricing, LED penetration rate, and project macro and micor economic factors were utilized for building the market forecasting.
- Step 4: Validate and Finalize: In this crucial step, all market numbers and variables derived through an internal mathematical model were validated through an extensive network of primary research experts from all the markets studied. The respondents are selected across levels and functions to generate a holistic picture of the market studied.
- Step 5: Research Outputs: Syndicated Reports, Custom Consulting Assignments, Databases & Subscription Platforms


