South America LED Lighting Market Size and Share
Market Overview
| Study Period | 2020 - 2031 |
|---|---|
| Forecast Data Period | 2026 - 2031 |
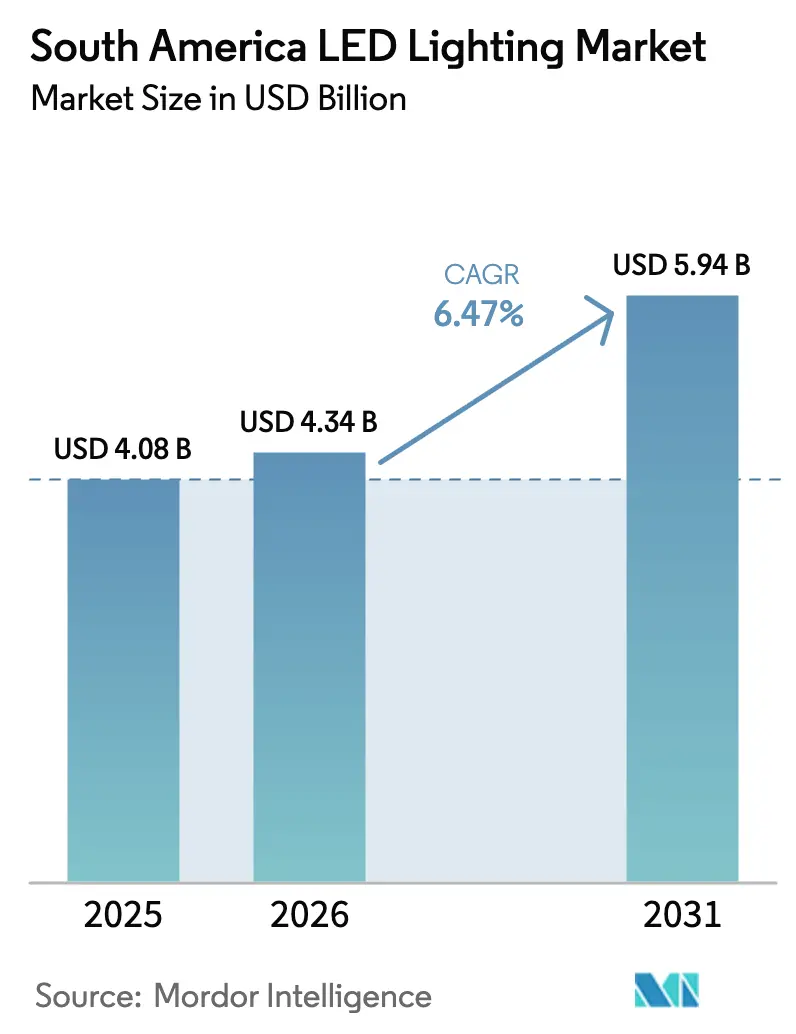
| Base Year Market Size (2025) | USD 4.08 Billion |
| Market Size (2026) | USD 4.34 Billion |
| Market Size (2031) | USD 5.94 Billion |
| Growth Rate (2026 - 2031) | 6.47% CAGR |
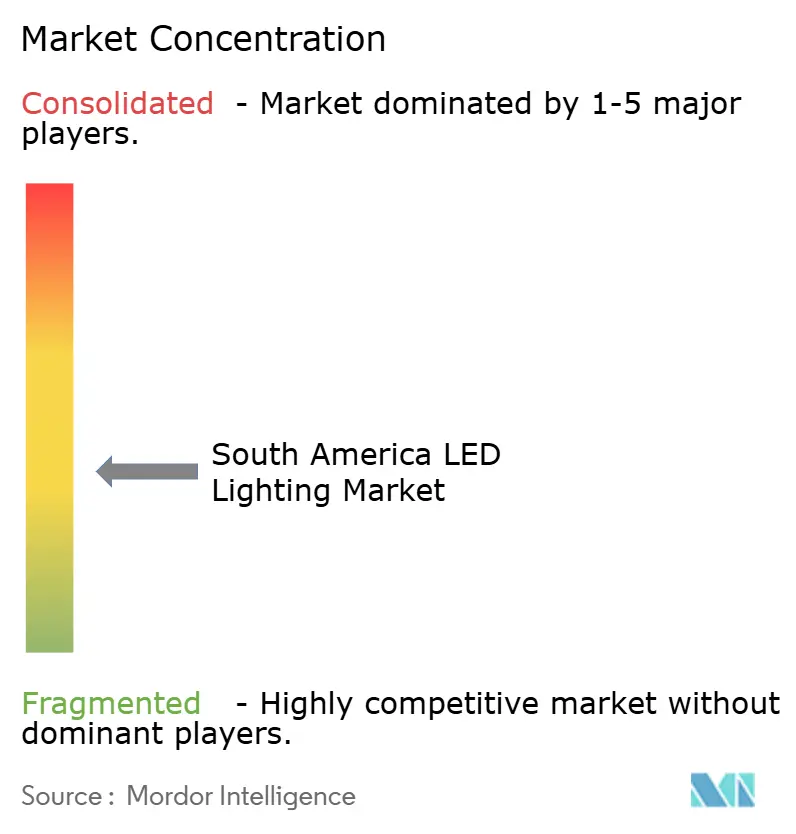
| Market Concentration | Medium |
Major Players *Disclaimer: Major Players sorted in no particular order Image © Mordor Intelligence. Reuse requires attribution under CC BY 4.0. | |
South America LED Lighting Market Analysis by Mordor Intelligence
The South America LED lighting market size is expected to grow from USD 4.08 billion in 2025 to USD 4.34 billion in 2026 and is forecast to reach USD 5.94 billion by 2031 at 6.47% CAGR over 2026-2031. Accelerated phase-outs of incandescent and halogen products, rising electricity tariffs, and steady price declines in solid-state components underpin this growth. Tariff adjustments by Brazil’s ANEEL lifted average power prices by 32.4% in 2025, sharply improving retrofit economics for commercial and municipal customers.[1]Agência Nacional de Energia Elétrica, “Orçamento da CDE 2025,” gov.br Mining-led infrastructure spending in Peru, coupled with smart-city roadway tenders in Brazil and Colombia, expands the opportunity pool for manufacturers offering connected luminaires. Currency volatility and grey imports continue to weigh on margins; however, duty exemptions under Brazil’s ex-tarifário program partially mitigate cost shocks for capital-intensive projects. Competitive intensity rises as international brands pivot toward integrated lighting and control ecosystems, while local firms defend value segments through proximity and agile distribution.
Key Report Takeaways
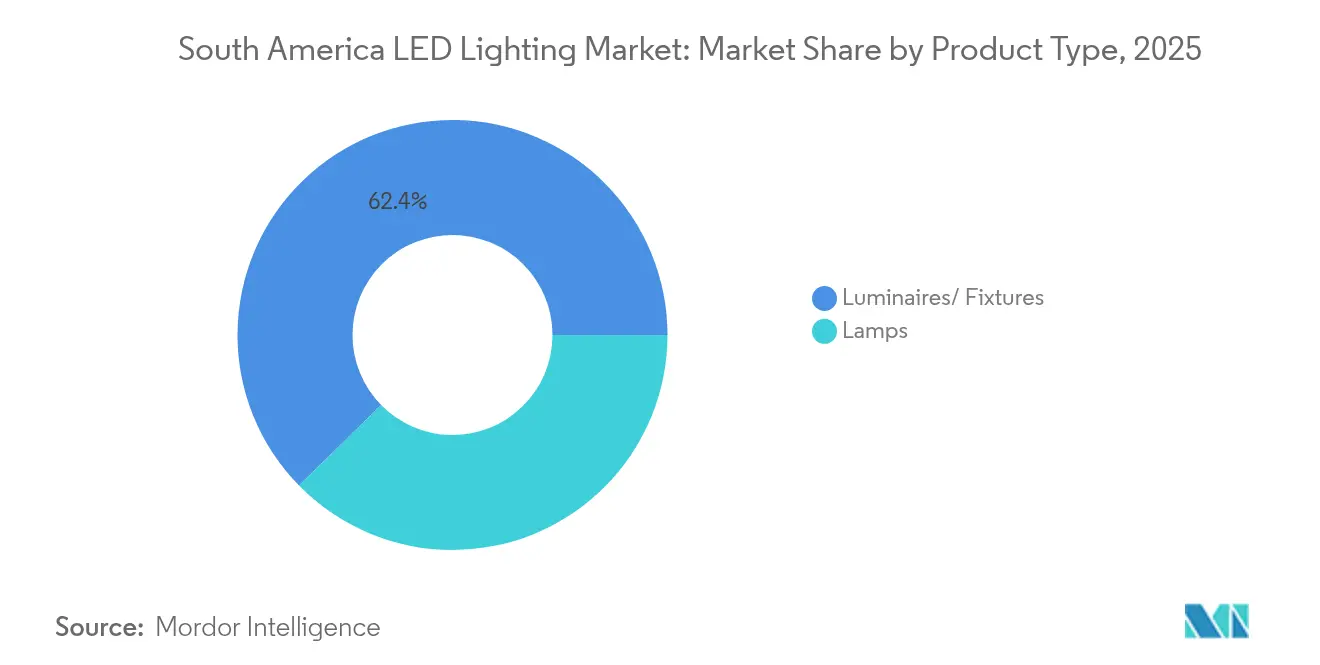
- By product type, luminaires and fixtures led with 62.35% revenue share in 2025; lamps recorded the fastest CAGR at 7.99% through 2031.
- By distribution channel, wholesale and retail accounted for 54.35% of the South America LED lighting market share in 2025, whereas e-commerce posted the highest 6.41% CAGR from 2026 to 2031.
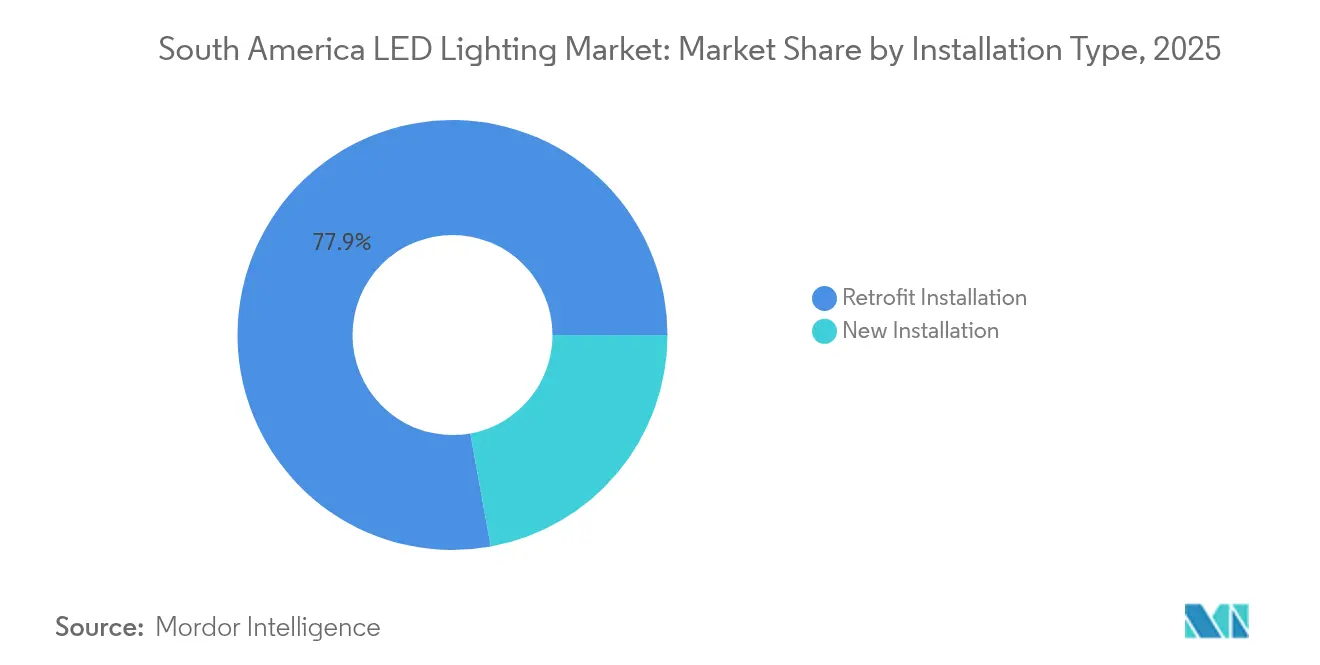
- By installation type, retrofit projects accounted for 77.85% of the South America LED lighting market size in 2025, while new installations are projected to expand at a 6.94% CAGR between 2026 and 2031.
- By application, residential accounted for 19.85% of the South America LED lighting market size in 2025, while highway and roadway posted the highest 8.74% CAGR to 2031.
- By end user, indoor accounted for 62.95% of the South America LED lighting market size in 2025, while outdoor is projected to expand at an 8.45% CAGR between 2026 and 2031.
- By country, Brazil maintained a 52.90% share in 2025, and Peru is forecast to post the highest 7.41% CAGR to 2031.
Note: Market size and forecast figures in this report are generated using Mordor Intelligence’s proprietary estimation framework, updated with the latest available data and insights as of 2026.
South America LED Lighting Market Trends and Insights
Drivers Impact Analysis*
| Driver | (~) % Impact on CAGR Forecast | Geographic Relevance | Impact Timeline |
|---|---|---|---|
| Government-mandated phase-out of incandescent and halogen bulbs | +1.8% | Brazil, Colombia, Chile, with spillover to Argentina | Medium term (2-4 years) |
| Declining average selling price of LEDs | +1.2% | Global, with the strongest impact in Brazil and Argentina | Short term (≤ 2 years) |
| Rapid build-out of commercial real estate post-COVID | +0.9% | Brazil, Chile, and Colombia urban centers | Medium term (2-4 years) |
| Utility rebate programs for industrial retrofits | +0.7% | Brazil, Argentina, with selective programs in Chile | Short term (≤ 2 years) |
| Smart-city roadway tenders across Brazil and Colombia | +0.6% | Brazil, Colombia, with pilot programs in Peru | Long term (≥ 4 years) |
| Agritech boom driving controlled-environment horticulture lighting | +0.5% | Chile, Brazil, Argentina greenhouse clusters | Long term (≥ 4 years) |
| Source: Mordor Intelligence | |||


Government-Mandated Phase-Out of Incandescent and Halogen Bulbs
Mandatory efficiency standards in Brazil and Chile remove outdated lamps from the supply chain, ensuring a sustained demand for LED alternatives. Enforcement has strengthened since 2024, thanks to CLASP's technical assistance and UNDP's capacity-building programs, which have delivered replicable retrofit pilots for municipalities.[2]CLASP, “Americas – CLASP,” clasp.ngo Predictability in demand enables manufacturers to scale local assembly lines, optimize their bill of materials, and negotiate better component pricing. Markets with limited enforcement capacity, such as Paraguay and Bolivia, lag in compliance; yet, cross-border commerce eventually funnels compliant stock there, raising the regional baseline efficiency.
Declining Average Selling Price of LEDs
Global semiconductor oversupply, productivity gains, and yield improvements have driven packaged LED prices down by more than 15% year-over-year in currency-adjusted terms. When paired with Brazil’s 32.4% tariff‐driven surge in end-user power costs for 2025, payback periods for commercial retrofits compress below two years. Price erosion, however, squeezes manufacturer margins and intensifies consolidation, prompting players to bundle controls and services to defend profitability.
Rapid Build-Out of Commercial Real Estate Post-COVID
Foreign direct investment inflows and nearshoring trends stimulate office, logistics, and hospitality construction in Brazil, Chile, and Colombia. New buildings specify smart-ready luminaires that integrate daylight and occupancy sensors, capitalizing on tenant appetite for human-centric lighting and energy dashboards. Vendors that offer turnkey lighting and control platforms seize specification advantages, especially in mixed-use developments targeting LEED Gold or higher certification levels.
Utility Rebate Programs for Industrial Retrofits
Brazilian distribution utilities, including Enel and CPFL, earmarked R$4.7 billion (USD 887 million) for grid upgrades in 2024, carving out sizable budgets to co-fund high-load facility retrofits. Rebates frequently cover up to half of project costs and bundle performance verification, accelerating uptake among metal processing, food, and plastics plants that operate around the clock.
Restraints Impact Analysis*
| Restraint | (~) % Impact on CAGR Forecast | Geographic Relevance | Impact Timeline |
|---|---|---|---|
| Volatile FX rates are inflating import costs | -1.4% | Argentina, Brazil, with a secondary impact on Chile, Colombia | Short term (≤ 2 years) |
| Informal/grey imports flooding retail channels | -0.8% | Brazil, Argentina, with spillover to Paraguay, Uruguay | Medium term (2-4 years) |
| Slow municipal budget cycles are delaying public projects | -0.6% | Chile, Peru, Colombia, with a selective impact on Argentina | Medium term (2-4 years) |
| Limited local component supply chain for high-end luminaires | -0.4% | Regional impact across all countries, strongest in smaller markets | Long term (≥ 4 years) |
| Source: Mordor Intelligence | |||
Volatile FX Rates Inflating Import Costs
Sharp fluctuations in the peso and real magnify the cost of Asian-sourced drivers and chips. Argentina’s 18%-35% fixture tariffs compound the burden, pushing up shelf prices by more than 20% within a single quarter. Brazilian distributors turn to the ex-tarifário waiver system, yet its procedural complexity curbs the volume of approved exemptions, especially for smaller importers.[3]International Trade Administration, “Brazil Customs Tariff Exception,” trade.gov Currency hedging remains out of reach for many mid-tier firms, amplifying project budgeting risk.
Informal and Grey Imports Flooding Retail Channels
Uncertified, low-cost lamps infiltrate e-commerce marketplaces and local bazaars, undercutting compliant products by up to 40%. These units often fail to meet luminance or safety benchmarks, eroding consumer confidence and increasing warranty costs for reputable brands. Customs agencies struggle with inspection backlogs, while sub-regional trade corridors through Paraguay and Bolivia provide porous entry points. Reputable vendors respond by intensifying brand education campaigns and lobbying for stricter port-of-entry testing regimes.
*Our forecasts treat driver/restraint impacts as directional, not additive. The impact forecasts reflect baseline growth, mix effects, and variable interactions.
Segment Analysis
By Product Type: Luminaires Anchor Value Growth
Luminaires commanded 62.35% of 2025 revenue, reflecting higher per-unit pricing and the shift toward fully integrated systems that bundle sensors and wireless drivers. The South America LED lighting market share for luminaires stays dominant as facility managers prefer turnkey upgrades that synchronize with building management platforms. Lamps, while still essential for piecemeal retrofits, grow fastest at an 7.99% CAGR, supported by a vast stock of legacy sockets across residential and small commercial premises. Manufacturers with on-shore assembly lines shorten lead times and tailor optic designs to local mounting heights, reinforcing competitive moats. The South America LED lighting market size contribution from lamps gradually tapers beyond 2028 as the bulk of first-wave replacements concludes, yet emergency stock and specialty form factors sustain residual demand.
Second-generation luminaire purchases now emphasize DLC Premium or equivalent certifications, ensuring higher efficacy and longer warranties. Suppliers able to integrate Bluetooth mesh and low-power wide-area connectivity, such as the LoRa-based pilots in São Paulo, secure a specification advantage for public tenders. Retrofitting interests in logistics centers also boosts sales of high-bay luminaire, with owners prioritizing visual comfort and reduced maintenance. Local brands differentiate through extended service packages, though global leaders continue to lead premium sub-segments by leveraging patent portfolios and global supply contracts.


By Distribution Channel: Wholesale Dominance Faces Digital Upswing
Established electrical wholesalers retained 54.35% share of the South America LED lighting market in 2025, anchored by robust contractor networks and credit facilities that ease project cash-flow constraints. Wholesalers curate comprehensive SKU ranges and provide in-house lighting design advice, features crucial for industrial and municipal bids. E-commerce, however, posts a 6.41% CAGR, propelled by smartphone penetration and a younger installer cohort comfortable with online procurement. Residential DIYers are increasingly bypassing brick-and-mortar stores for delivered stock, particularly in Argentina, where high fuel costs inflate travel times.
Digital migration pushes wholesalers to integrate configurable BOM tools and real-time inventory APIs, narrowing the convenience gap with pure-play platforms. Direct sales teams continue to focus on mega-projects, such as airport expansions and state-run highway concessions, offering engineering, financing, and performance verification services. For cross-border distributors, harmonizing product codes under Mercosur standards remains crucial to streamline customs clearance and manage inventory for shipments with transit times of fewer than 14 days.
By Installation Type: Retrofit Prevails Amid Aging Stock
Retrofits accounted for 77.85% of 2025 revenue, underscoring the region’s substantial backlog of outdated fluorescent and HID fittings. Payback horizons of three years or less make energy service company (ESCO)- financed retrofits attractive to cash-constrained municipalities. The South America LED lighting market size, driven by new installations, is expected to increase at a 6.94% CAGR, primarily paced by commercial real estate and vertical farm construction. Longer-life diodes and improved thermal designs open second-wave retrofit cycles where early LED adopters upgrade to higher efficacy SKUs, further cushioning demand volatility.
Governments mandate minimum efficacy thresholds in public works, ensuring LED specification in virtually all new civic facilities. In Brazil, line-item funding within the CDE budget allocates incentives for distribution utilities that partner with municipalities on bulk streetlight swaps, trimming transaction costs and shortening project approval cycles. New installations benefit from builders standardizing low-voltage DC infrastructures that simplify subsequent IoT sensor deployment, positioning LED luminaires as digital nodes rather than static light sources.
By Application: Highway Projects Outpace Residential Base
Households still accounted for 19.85% of the 2025 value, thanks to bulk lamp purchases and modest upgrades to luminaire. However, highway and roadway lighting posts are the fastest-growing segment, with an 8.74% CAGR, driven by federal smart-city mandates in Brazil and congestion mitigation schemes in Bogotá and Lima. Connected roadway luminaires utilize adaptive dimming algorithms, delivering up to 60% additional savings —a feature particularly compelling to cash-strapped municipalities subject to annual budget constraints.
Commercial offices, retail malls, and hospitality venues are rebounding as tourism and consumer foot traffic return to normal post-pandemic. Building owners are pursuing circadian-tuned, white-tunable fixtures that enhance occupant comfort scores, enabling them to command premium lease rates. Horticulture lighting remains a niche market but is accelerating in Chile’s greenhouse valleys and Brazil’s vertical farms, where controlled-spectrum LEDs boost yields and reduce pesticide use. Suppliers targeting this vertical tailor spectral recipes for specific crops such as strawberries and cannabis, unlocking differentiated pricing power.
By End User: Indoor Demand Leads as Outdoor Gains Momentum
Indoor environments accounted for 62.95% of the 2025 spend, reflecting concentrated needs in office, industrial, and residential sectors. Facility managers are pivoting toward sensor-rich troffers and high-bays that interface with cloud-based dashboards, thereby melding lighting control with HVAC optimization. Outdoor installations, forecasted to grow at an 8.45% CAGR, benefit from municipally backed streetlight concessions and utility resilience programs following high-profile grid outages in São Paulo.
Automotive plants and showrooms utilize CRI-enhanced fixtures to enhance surface inspection accuracy and improve the aesthetics of their showrooms. Stadiums and public plazas integrate dynamic color-tuning capabilities for event branding, opening ancillary revenue streams for lighting service providers. Rural electrification campaigns in Peru and Bolivia extend grid reach, introducing first-time outdoor lighting demand in previously dark zones.
Geography Analysis
Brazil anchored 52.90% of 2025 regional sales, fueled by a supportive regulatory framework, a sizable manufacturing base, and utility infrastructure investments exceeding R$4.7 billion (USD 887 million) in 2024. ANEEL’s decision to fund a R$49.2 billion (USD 8.7 billion) budget for 2025, which includes CDE, widened tariff differentials that favor solid-state retrofits. Pilot smart-city deployments in Campinas and Fortaleza showcase fully networked street-lighting systems that integrate environmental sensors and EV charging kiosks, setting specification precedents for other states.
Argentina remains the second-largest opportunity but battles FX turbulence and high import duties that complicate CAPEX planning. The Milei administration’s market-oriented reforms, alongside prospective IMF facilities, may stabilize capital flows and unlock dormant lighting tenders. Chile leverages copper export windfalls to finance municipal lighting swaps and public-private partnerships, replicating UNDP’s earlier retrofit templates to ensure transparent procurement practices.
Peru’s South America LED lighting market expansion of 7.41% CAGR through 2031 rides on mega-mine expansions and the Pan-American highway corridor upgrades. Mining operators deploy high-CRI, vibration-resistant luminaires in pits and processing plants, while regional governments link lighting upgrades to broader social license initiatives. Colombia’s smart-corridor programs along the Medellín-Bogotá route integrate adaptive roadway lighting and camera analytics, although fiscal austerity may delay full rollouts until macroeconomic conditions improve. Uruguay and Paraguay exhibit steady, smaller-scale demand, supported by cross-border distributors that minimize inventory risk through harmonized SKU listings under Mercosur codes.
Competitive Landscape
The vendor matrix is moderately fragmented. Global majors such as Signify, OSRAM, and Acuity Brands leverage global R&D and patent depth to dominate premium segments, particularly where integrated controls and stringent warranty terms are must-haves. Signify’s connected and specialty segment generated EUR 2 billion (USD 2.13 billion) worldwide in 2025, underscoring scale advantages. Acuity Brands, following its USD 1.215 billion acquisition of QSC, now bundles QSC’s audio-visual control stack with its own nLight platform, positioning itself for holistic smart-building bids.
Regional players-Brilia LED, Ibrapi, Alcon Iluminação-retain strong traction in value-driven residential and SMB sectors, benefiting from proximity, shorter lead times, and local after-sales teams. Some assemble imported boards and drivers locally to circumvent tariffs, though component dependence on Asian suppliers remains high. M&A interest intensifies as firms aim to broaden channel reach; Inari-Amertron’s planned purchase of Lumileds illustrates upstream consolidation that could stabilize chip supply for South American lamp makers.[4]Inari-Amertron, “Proposed Acquisition of Lumileds,” inari-amertron.com
Technological differentiation centers on software and analytics. Vendors integrating open API layers and BACnet gateways secure preference in new commercial builds. Horticulture lighting forms a frontier niche where spectrum recipes and thermal management dictate performance. International brands currently hold an edge, yet local firms partnering with agritech institutes in Chile are beginning to tailor luminaires to meet the specific needs of endemic crops. Supply-chain agility will shape competitive outcomes as volatility in freight rates and FX persists through 2026.
South America LED Lighting Industry Leaders
Signify Holding B.V.
OSRAM GmbH
Nichia Corporation
Cree LED (IDEAL Industries)
Acuity Brands Lighting, Inc.
- *Disclaimer: Major Players sorted in no particular order

Recent Industry Developments
- August 2025: Inari-Amertron announced a joint move to acquire 100% equity in Lumileds Holding B.V., aiming to deepen LED component supply across automotive and general illumination verticals.
- July 2025: ANEEL approved a R$49.2 billion (USD 8.7 billion) CDE budget for 2025, raising electricity tariffs that reinforce LED retrofit paybacks.
- April 2025: ANEEL activated the yellow tariff flag for May 2025, adding R$1.885 per 100 kWh consumed.
- January 2025: Acuity Brands closed its USD 1.215 billion purchase of QSC, broadening its intelligent-building toolkit.


South America LED Lighting Market Report Scope
Agricultural Lighting, Commercial, Industrial and Warehouse, Residential are covered as segments by Indoor Lighting. Public Places, Streets and Roadways, Others are covered as segments by Outdoor Lighting. Daytime Running Lights (DRL), Directional Signal Lights, Headlights, Reverse Light, Stop Light, Tail Light, Others are covered as segments by Automotive Utility Lighting. 2 Wheelers, Commercial Vehicles, Passenger Cars are covered as segments by Automotive Vehicle Lighting.| Lamps |
| Luminaires / Fixtures |
| Direct Sales |
| Wholesale Retail |
| E-commerce |
| New Installation |
| Retrofit Installation |
| Commercial Offices |
| Retail Stores |
| Hospitality |
| Industrial |
| Highway and Roadway |
| Architectural |
| Public Places |
| Hospitals |
| Horticulture Gardens |
| Residential |
| Automotive |
| Others (Chemicals, Oil and Gas, Agriculture) |
| Indoor |
| Outdoor |
| Automotive |
| Brazil |
| Argentina |
| Chile |
| Colombia |
| Peru |
| Rest of South America |
| By Product Type | Lamps |
| Luminaires / Fixtures | |
| By Distribution Channel | Direct Sales |
| Wholesale Retail | |
| E-commerce | |
| By Installation Type | New Installation |
| Retrofit Installation | |
| By Application | Commercial Offices |
| Retail Stores | |
| Hospitality | |
| Industrial | |
| Highway and Roadway | |
| Architectural | |
| Public Places | |
| Hospitals | |
| Horticulture Gardens | |
| Residential | |
| Automotive | |
| Others (Chemicals, Oil and Gas, Agriculture) | |
| By End User | Indoor |
| Outdoor | |
| Automotive | |
| By Country | Brazil |
| Argentina | |
| Chile | |
| Colombia | |
| Peru | |
| Rest of South America |


Market Definition
- INDOOR LIGHTING - It incorporates all LED based lamps and fixtures/luminaire that are used to illuminate indoor section of residential, commercial, industrial buildings and agricultural lighting. LED offers efficient brightness with higher durability in comparison to other lighting technology.
- OUTDOOR LIGHTING - It incorporates the LED lighting fixtures that is used for illumination for exterior/outdoor illumination. For instance, LED lighting fixtures used to illuminate streets and highways, transport hubs, stadiums and other public places such as parking spaces.
- AUTOMOTIVE LIGHTING - It refers to the lighting fixtures installed for illumination and signaling purposes. It is used in both exterior and interior lighting of the vehicle. Headlamps, fog lamp, daytime running light (DRLs) are examples of exterior light whereas cabin light are interior lights.
- END USER - It refers to the end use application area where the LED fixture will be installed. For instance, in terms of indoor lighting, we have residential, commercial and industrial as end user category. For automotive lighting, primary end user considered are automotive manufacturers and aftermarket sale
| Keyword | Definition |
|---|---|
| Lumen | Lumen is a unit of luminous flux in the International System of Units that is equal to the amount of light given out through a solid angle by a source of one-candela intensity radiating equally in all directions. |
| Footcandle | A foot-candle (or foot-candle, fc, lm/ft2, or ft-c) is a measurement of light intensity. One foot-candle is defined as enough light to saturate a one-foot square with one lumen of light. |
| Colour Rendering Index (CRI) | Color Rendering Index (CRI) is a measurement of how natural colors render under an artificial white light source when compared with sunlight. The index is measured from 0-100, with a perfect 100 indicating that colors of objects under the light source appear the same as they would under natural sunlight. |
| Luminous flux | Luminous flux is a measure of the power of visible light produced by a light source or light fitting. It is measured in lumens (lm). |
| Annual Energy Cost | Annual Energy Cost means the average daily energy consumption multiplied by 365 (days per year), expressed in kilowatt hour per year (kWh/a). |
| Constant voltage drivers | Constant voltage drivers are designed for a single direct current (DC) output voltage. Most common constant voltage drivers (or Power Supplies) are 12VDC or 24VDC. An LED light that is rated for constant voltage usually specifies the amount of input voltage it needs to operate correctly. |
| Constant Current Driver | Constant current LED drivers are designed for a designated range of output voltages and a fixed output current (mA). LEDs that are rated to operate on a constant current driver require a designated supply of current usually specified in milliamps (mA) or amps (A). These drivers vary the voltage along an electronic circuit which allows current to remain constant throughout the LED system. |
| Minimum Energy Performance Standards (MEPS) | Minimum Energy Performance Standards specify the minimum level of energy performance that appliances and equipment must meet or exceed before they can supply or used for commercial purposes. |
| Luminous Efficacy | Luminous efficacy is a measurement commonly used in the lighting industry that indicates the ability of a light source to emit visible light using a given amount of power. |
| Solid State Lighting | Solid-state lighting (SSL) is a type of lighting that uses semiconductor light-emitting diodes (LEDs), organic light-emitting diodes (OLED), or polymer light-emitting diodes (PLED) as sources of illumination rather than electrical filaments, plasma (used in arc lamps such as fluorescent lamps), or gas. |
| Rated Lamp Life | Lamp life, also referred to as rated life, is the time in hours a lamp will last before a percentage of lamps will burn out. |
| Color Temperature | Colour temperature is a scale that measures how ‘warm’ (yellow) or ‘cool’ (blue) the light from a particular source is. It is measured in degrees of the Kelvin scale (abbreviated to K), and the higher the number, the ‘cooler’ the light. The lower the ‘K’ number, the ‘warmer’ the light. |
| Ingress Protection rating (IP rating) | The IP (Ingress Protection) rating of a bulb or light fixture declares the level of protection it has against dirt and water. |
| Fidelity Index | The general colour fidelity index, Rf, represents how closely the colour appearances of the entire sample set are reproduced (rendered) on average by a test light as compared to those under a reference illuminant. |
| Gamut Index | The gamut area is defined as “the area enclosed by a set of test color samples illuminated by a light source, in a two-dimensional chromaticity diagram or a plane of color space.”1 Within a defined color space, a “gamut” describes the subset of colors that can be perceived under specific lighting conditions. |
| Binning | In the lighting industry, the act of "binning" of LEDs is the process of sorting LEDs by certain characteristics, such as color, voltage, and brightness. |
| Accent lighting | Accent lighting, also called highlighting, emphasizes objects by focusing light directly on them. Accent lighting is used inside and outside the home to feature locations such as an entrance or to create dramatic effects. |
| Dimmable driver | A dimming driver has two functions: As a driver, it converts the 230V AC mains input to a low voltage DC output. As a dimmer, it reduces the amount of electrical energy flowing to the LEDs, thereby causing them to dim. |
| Flicker | Flicker is the repeated and frequent variation in the output of a light source over time. |
| Fluorescent | A property of materials defined as the ability to emit light after absorbing electromagnetic radiation such as visible or UV light. |
| Candela | The candela is the unit of luminous intensity in the International System of Units. It measures the light output per unit solid angle emitted from a light source in a specific direction. |
| LUX | Lux is used to measure the amount of light output in a given area - one lux is equal to one lumen per square meter. It enables us to measure the total "amount" of visible light present and the intensity of the illumination on a surface. |
| Uniformity (U0) | The uniformity of lighting has significant effects on visual performance in both indoor and outdoor areas. Uniformity (represented as U0) value can be found by dividing the minimum brightness (Emin) resulting from calculations according to the current lighting order, to the average brightness value (Eavg). |
| Visible Light Spectrum | The visible light spectrum is the segment of the electromagnetic spectrum that the human eye can view. More simply, this range of wavelengths is called visible light. Typically, the human eye can detect wavelengths from 380 to 700 nanometers. |
| Ambient Temperature | Ambient Temperature is the temperature of the air surrounding an electrical enclosure. |
| Current-controlled dimming control | Current-controlled dimming controls LED brightness by varying the applied current using a 0-10V dimmer. Current-controlled dimming is smooth and HD-video friendly. It can only dim to a minimum of 5% of light output. |
| Design Light Consortium | It is a partnership of energy efficiency stakeholders in the United States and Canada to “promote quality, performance and energy efficient lighting solutions for the commercial sector”. |
| Pulse Width Modulation | Pulse-width modulation, or pulse-duration modulation, is a method of controlling the average power delivered by an electrical signal. |
| Surface Mounted Device | A surface mount device (SMD) is an electronic device whose components are mounted or placed directly on the surface of a printed circuit board. |
| Alternating Current | Alternating current is an electric current which periodically reverses direction and changes its magnitude continuously with time, in contrast to direct current, which flows only in one direction. |
| Direct Current | Direct current (DC) is an electric current that is uni-directional, so the flow of charge is always in the same direction. |
| Beam Angle | Beam angle (also called beam spread) is a measure of how light is distributed. On any plane perpendicular to the centerline of the light, the beam angle is the angle between two rays where the light intensity is 50% of the maximum light intensity. |
| LED Based Solar High Mast Lighting Systems | A Solar LED High Mast Light is a raised source of High illumination lights (6~8 lights) and with high intensity on the middle of major junctions (Ring roads, Outer Ring roads), turned on or lit automatically in the absence of light (at specified timings or at periodic times, every night). |
| Surface Mounted Diode (SMD) LEDs | A surface mount diode is a type that emits light and is flat mounted and soldered onto a circuit board. |
| Chip on Board (COB) LEDs | A COB LED is basically multiple LED chips (usually 9 or more) glued directly onto a substrate by the manufacturer to form a single module. |
| Dual In-Line Package (DIP) LEDs | A dual in-line package (DIP or DIL) is an electronic component package with a rectangular case and two parallel rows of electrical connector pins. |
| Graphene LED Lights | A graphene LED light bulb is simply an LED light bulb where the filament has been coated in graphene. A graphene LED bulb is reported to be 10% more efficient than regular LED light bulbs and they are cheaper to manufacture and buy. |
| LED Corn Bulbs | LED Corn lights are designed as an energy efficient alternative to high intensity discharge (HID) and SON lamps. It uses a large number of LEDs on a metal structure to provide sufficient light. This arrangement of LEDs looks a lot like a corn cob, hence the name "corn light". |
| Per Capita Income | Per capita income or total income measures the average income earned per person in a given area in a specified year. It is calculated by dividing the area's total income by its total population. Per capita income is national income divided by population size. |
| Charging Stations | A charging station, also known as a charging station or electric vehicle utility, is a power supply that provides electrical energy for charging plug-in electric vehicles. |
| Headlight | A headlight is a light that is mounted on the front of a car and illuminates the road in front of it. Low beam and high beam LED headlights are additional categories for these LED headlights. |
| Day Time Running Light (DRLs) | A daytime running lamp is a white, yellow, or amber lighting device mounted on the front of a road-going motor vehicle or bicycle. |
| Directional Signal Light | Directional signal lights are the front and rear lights on an automobile that flash to show the direction of a turn. |
| Stop Light | A red light that is mounted to the back of a car and turns on when the brakes are used to show that the car is stopped. |
| Reverse Light | The reverse light is at the back of the vehicle to indicate its backward motion. |
| Tail Light | A red light that can be seen in the dark is mounted on the rear of a road vehicle. Stop, reverse, and directional signal lights are all part of it. |
| Fog Light | Bright lights in automobiles used to increase visibility on the road in foggy conditions or to warn other drivers of the presence of the vehicle. |
| Passenger Vehicle | A passenger vehicle is a road vehicle, other than a moped or a motorcycle, intended for the transportation of people and designed for up to 8 to 9 seats. |
| Commercial Vehicle | A commercial vehicle (Bus, Truck, Van) is any type of motor vehicle used to transport goods or pay passengers. |
| Two Wheelers (2W) | A two-wheeler is a vehicle that runs on two wheels. |
| Streets & Roadways | Both roads and streets refer to hard, flat surfaces on the ground on which vehicles, people, and animals can travel. Since streetways are usually in cities and towns, they often have houses and buildings on both sides. The roadway is in the countryside and sometimes passes through forests and fields |
| Horticulture Lighting | Horticulture is the science and art of sustainably growing, producing, marketing and using high quality, intensively cultivated food and ornamental plants. |


Research Methodology
Mordor Intelligence has followed the following methodology in all our data center reports.
- Step 1: Raw Data Collection: To understand the market, initially, all crtical data points were identified. Critical information about countries and regions of interest including Per-capita Income, Population, Automotive Production, Interest rate on Auto-Loans, Number of Automobiles on Road, Total LED Import, Lighting Electricity Consumption among others were recorded or estimated based on internal calculations.
- Step 2: Identify Key Variables: To build a robust forecasting model, key variables such as Number of Households, Automotive Production, Road Networks among others were identified. Through an iterative process, the variables required for the market forecast were set, and the model was built using these variables.
- Step 3: Build a Market Model: Based on data and critical industry trend data (variables), including LED pricing, LED penetration rate, and project macro and micor economic factors were utilized for building the market forecasting.
- Step 4: Validate and Finalize: In this crucial step, all market numbers and variables derived through an internal mathematical model were validated through an extensive network of primary research experts from all the markets studied. The respondents are selected across levels and functions to generate a holistic picture of the market studied.
- Step 5: Research Outputs: Syndicated Reports, Custom Consulting Assignments, Databases & Subscription Platforms


