Market Overview
| Study Period | 2021 - 2031 |
|---|---|
| Forecast Data Period | 2026 - 2031 |
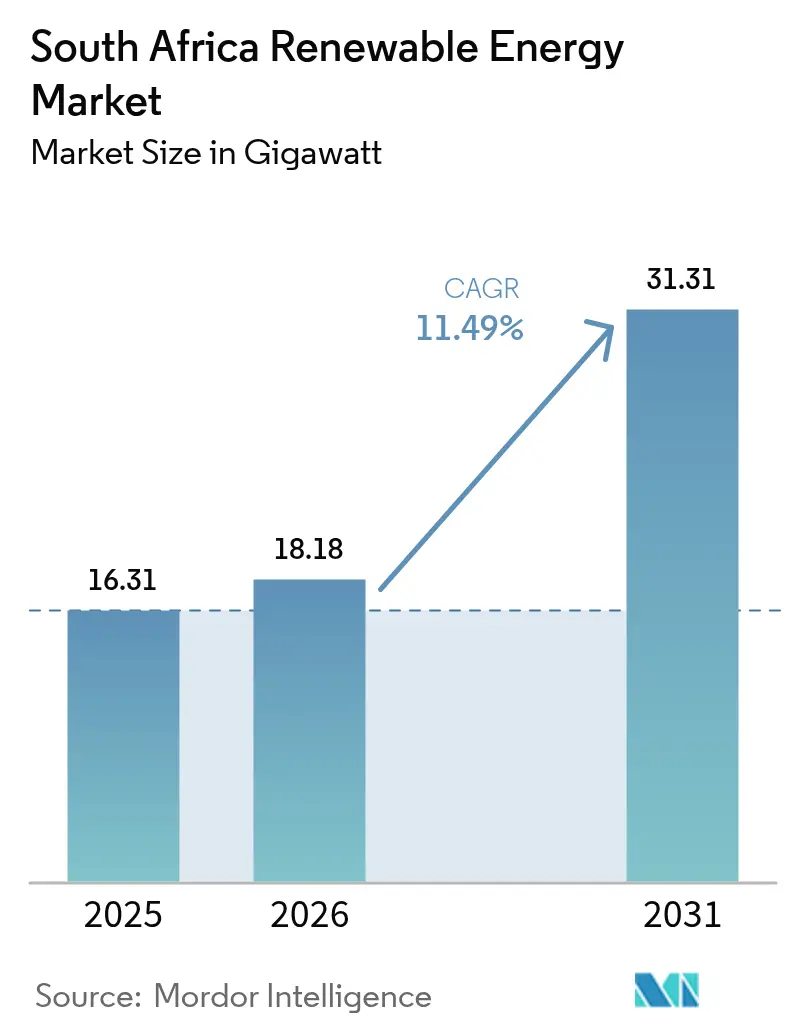
| Base Year Market Size (2025) | 16.31 gigawatt |
| Market Volume (2026) | 18.18 gigawatt |
| Market Volume (2031) | 31.31 gigawatt |
| Growth Rate (2026 - 2031) | 11.49% CAGR |
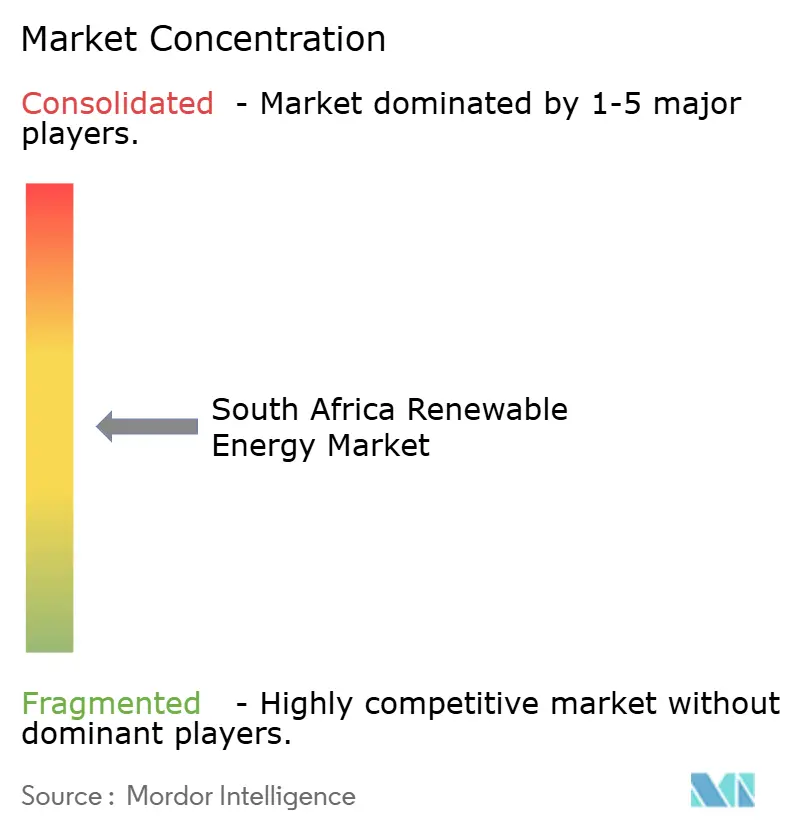
| Market Concentration | Medium |
Major Players
*Disclaimer: Major Players sorted in no particular order Image © Mordor Intelligence. Reuse requires attribution under CC BY 4.0. |
|
South Africa Renewable Energy Market Analysis by Mordor Intelligence
South Africa Renewable Energy Market size in 2026 is estimated at 18.18 gigawatt, growing from 2025 value of 16.31 gigawatt with 2031 projections showing 31.31 gigawatt, growing at 11.49% CAGR over 2026-2031.
This trajectory reflects the country’s systematic shift from coal-reliant generation to a diversified mix, led by utility-scale solar photovoltaic (PV) and onshore wind projects. Tariffs for grid power have increased by 190% since 2014, making renewable contracts priced at R0.50-0.60 per kWh more attractive to mines, municipalities, and manufacturers. The Integrated Resource Plan (IRP) 2023 guides the addition of 3 to 5 GW of new clean capacity each year, while the removal of licensing caps for private plants under 100 MW in 2024 has unlocked a new class of distributed assets. Energy wheeling and day-ahead trading now provide fresh revenue channels, deepening competition and drawing foreign capital into the South African renewable energy market.
Key Report Takeaways
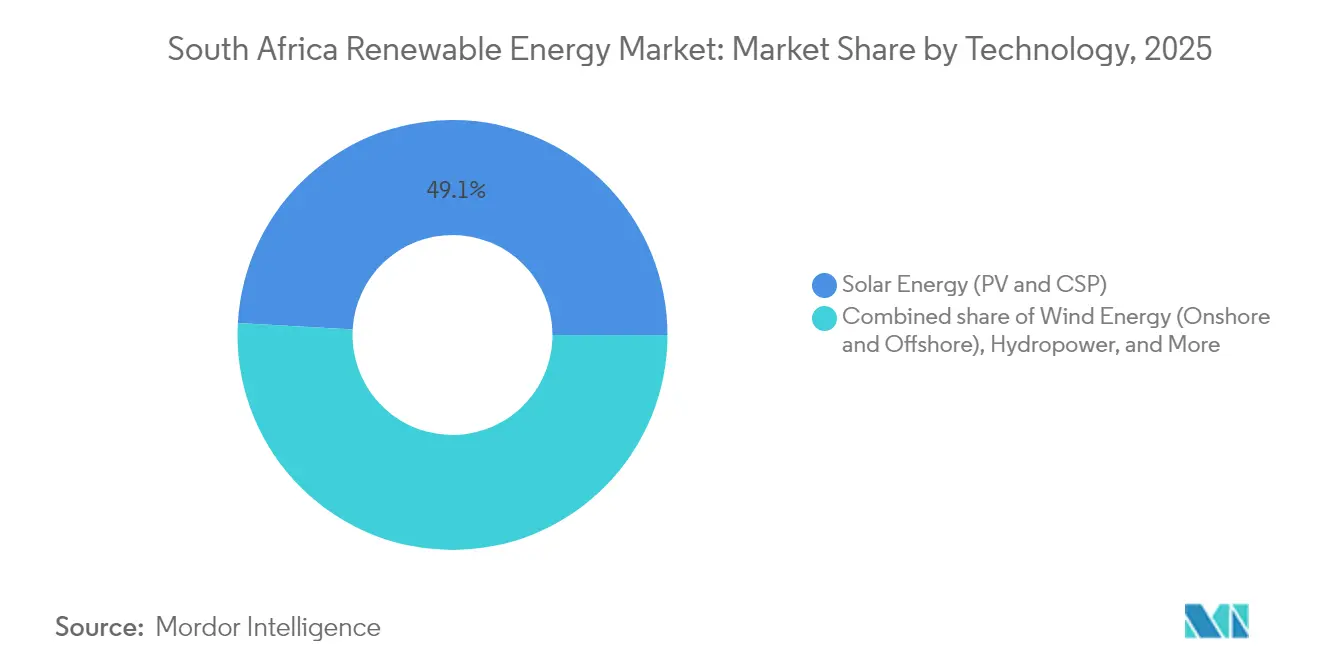
- By technology, solar PV retained the largest 49.12% share of the South Africa renewable energy market in 2025, whereas wind is on course for the fastest 17.83% CAGR to 2031.
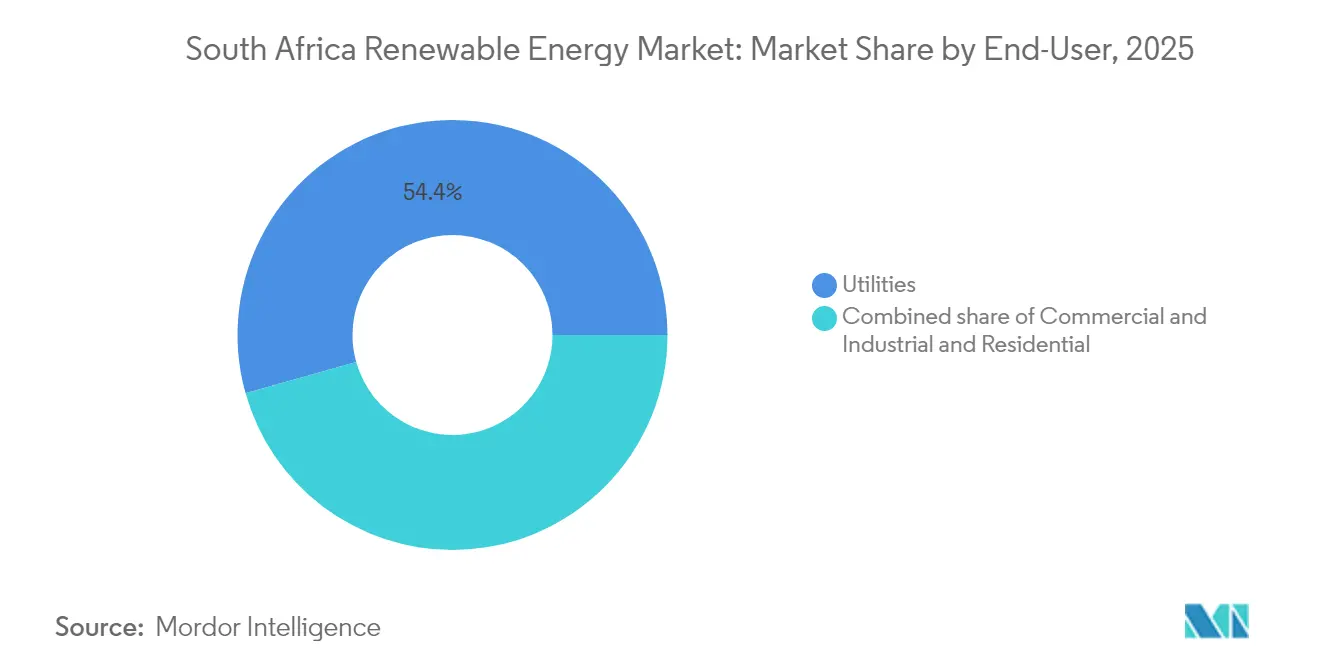
- By end-user, utilities controlled 54.37% of the South African renewable energy market size in 2025, and this segment is poised to grow the quickest at a 12.55% CAGR through 2031.
Note: Market size and forecast figures in this report are generated using Mordor Intelligence’s proprietary estimation framework, updated with the latest available data and insights as of 2026.
South Africa Renewable Energy Market Trends and Insights
Drivers Impact Analysis*
| Driver | (~) % Impact on CAGR Forecast | Geographic Relevance | Impact Timeline |
|---|---|---|---|
| Escalating electricity tariffs accelerating C&I solar uptake | 2.8% | National, with early gains in Western Cape, Gauteng industrial corridors | Short term (≤ 2 years) |
| Government IRP target of 3–5 GW new renewables per year | 3.2% | National, concentrated in Northern Cape, Western Cape wind corridors | Medium term (2-4 years) |
| Rapid fall in solar-PV & battery storage LCOE | 2.1% | Global impact, amplified in high-irradiation regions (Northern Cape, Free State) | Long term (≥ 4 years) |
| Licensing-cap removal for <100 MW private projects | 1.9% | National, with spillover to industrial mining regions (Limpopo, North West) | Short term (≤ 2 years) |
| Emergence of energy-wheeling & day-ahead trading platforms | 1.4% | APAC core, spill-over to industrial hubs (Gauteng, KwaZulu-Natal) | Medium term (2-4 years) |
| Renewable-manufacturing master-plan & 10% import-tariff incentive | 1.1% | National, with manufacturing focus in Eastern Cape (Coega SEZ), Gauteng | Long term (≥ 4 years) |
| Source: Mordor Intelligence | |||


Escalating Electricity Tariffs Drive Commercial Solar Adoption
Average grid tariffs rose to R1.96 per kWh in 2024, while new utility-scale solar projects came in at nearly R0.55 per kWh, widening the savings gap. Registrations for private generation jumped from 7,454 MW in June 2024 to 9,662 MW in September 2024 as mining houses, led by Exxaro’s 68 MW Lephalale Solar project, opted for self-supply. Corporate power-purchase agreements now sidestep Eskom via trader portals, reinforcing the South Africa renewable energy market.[1]South African Photovoltaic Industry Association, “National Embedded Generation Statistics September 2024,” SAPVIA, sapvia.co.za
Government IRP Targets Accelerate Utility-Scale Deployment
The IRP 2023 sets a rolling commitment for 3 to 5 GW of annual renewable builds and 7,220 MW of gas-to-power for flexibility. National Energy Regulator of South Africa (NERSA) cleared 1.1 GW of projects in Q3 2024 alone, showing faster permitting under the Electricity Regulation Amendment Act. A 10% import-tariff incentive on locally produced components underpins domestic content goals and cements regional leadership, with South Africa forecast to account for 40% of Sub-Saharan Africa’s 90 GW renewable additions by 2030.[2]International Energy Agency, “Africa Energy Outlook 2024,” IEA, iea.org
Technology Cost Convergence Reshapes Project Economics
Ground-mounted solar now achieves €0.041–0.050 per kWh in top irradiation zones, matching onshore wind at €0.043 to 0.092 per kWh. Battery storage prices have decreased by 82% since 2013, propelling hybrids such as Scatec’s 540 MW Kenhardt PV plant, which includes a 225 MW/1,140 MWh battery. Stand-alone storage, such as Red Sands’ 153 MW/612 MWh unit, is increasingly offsetting diesel peakers, which averaged a 6.2% capacity factor in 2024.
Private Project Licensing Reforms Unlock Distributed Generation
Scrapping licenses for sub-100 MW plants reduces lead times to one year, spurring 500 MW of systems with a capacity of ≤ 1 MW in 2024. Mines in Limpopo and the North West gain immediate tariff relief, although 133 GW of queued projects still await grid allocation, spotlighting the need for accelerated transmission upgrades.
Restraints Impact Analysis*
| Restraint | (~) % Impact on CAGR Forecast | Geographic Relevance | Impact Timeline |
|---|---|---|---|
| Transmission-grid congestion in Northern Cape corridors | -1.8% | Northern Cape renewable energy development zones | Medium term (2-4 years) |
| High cost of capital & financing bottlenecks | -1.4% | National, particularly affecting smaller developers | Short term (≤ 2 years) |
| New 10% solar-panel import tariff raises near-term capex | -0.9% | National, with higher impact on utility-scale projects | Short term (≤ 2 years) |
| Rooftop-solar saturation dampening residential demand in 2024 | -0.6% | Urban centers (Cape Town, Johannesburg, Durban) | Short term (≤ 2 years) |
| Source: Mordor Intelligence | |||
Transmission Grid Bottlenecks Constrain Northern Cape Development
Awarded wind volumes dipped when corridor capacity filled, leaving 133 GW in limbo. Kimberley-Upington’s 400 kV backbone was built for coal exports, not high-density renewables, so the Just Energy Transition Partnership’s USD 8.5 billion pledge focuses on new 765 kV lines. Slow disbursement delays unlock the Northern Cape’s top-tier solar and wind resources.
Financing Costs Impede Project Bankability
Weighted average cost of capital (WACC) for South African projects sits 300-500 basis points above global benchmarks. A USD 200 million European Investment Bank facility, in conjunction with the Development Bank of Southern Africa, offers relief, while JICA provides concessional loans; however, smaller developers lack comparable access. The Phase-Two carbon-tax escalation, set for January 2026, could improve margins, but policy uncertainty sustains investor risk premiums.[3]International Monetary Fund, “Financing Clean Energy in Emerging Markets,” IMF, imf.org
*Our forecasts treat driver/restraint impacts as directional, not additive. The impact forecasts reflect baseline growth, mix effects, and variable interactions.
Segment Analysis
By Technology: Wind Acceleration Challenges Solar Dominance
Solar PV controlled 49.12% of the South Africa renewable energy market in 2025 and delivered 6 GW of registered capacity by September 2024. However, wind enjoys a 17.83% forecast CAGR thanks to 3,000+ full-load hours along coastal belts. For projects exceeding 100 MW, the technology share now stands at 54.4% solar and 45.6% wind, marking a rapid convergence. Concentrated solar power remains a niche market of approximately 500 MW, providing grid inertia, while hydro, bioenergy, and emerging ocean technologies offer limited incremental capacity. Strict IEC 61215 and IEC 61400 compliance underpins reliability, and turbine assembly at the Coega SEZ lends local depth.
Solar’s lower daytime capacity factor versus wind’s round-the-clock profile sparks hybrid proposals aimed at smoothing output and hitting dispatchable bids in future tenders. As battery prices fall, solar-plus-storage hybrids are expected to claim a growing slice of the South Africa renewable energy market for new utility awards.


By End-User: Utilities Drive Market Expansion
Utilities held 54.37% of the South Africa renewable energy market share in 2025 and are forecast to post the fastest 12.55% CAGR to 2031. Eskom improved energy availability to 60% in 2024, opening space for renewables to offset diesel peakers. Cities such as Cape Town and Johannesburg now procure directly, with Cape Town’s 200 MW tender serving as a model for peers.
Commercial and industrial (C&I) buyers follow, accounting for most of the 9,662 MW private-registration pipeline, led by mining majors that integrate PV behind the meter. Residential adoption nears saturation in high-income suburbs, though rural electrification keeps volume upside down alive. NERSA’s 2024 Amendment Act streamlines approvals, while SANS 10142-1 installation standards secure grid safety for distributed projects.
Geography Analysis
The Northern Cape hosts 65% of South Africa's utility solar and 45% of its wind capacity, thanks to over 2,000 kWh/m² of irradiation and robust Karoo winds. Transmission limits, however, place a ceiling on near-term additions until new 765 kV corridors arrive. The Western Cape ranks next, with 25% of the national wind stock and the only domestic turbine-assembly line at Coega in the Eastern Cape.
Eastern Cape and Free State contribute 20% combined through coastal wind farms and inland PV arrays. KwaZulu-Natal's grid constraints limit large-scale projects, but Durban's commercial and industrial (C&I) market drives the adoption of rooftop PV. Gauteng leads the way in distributed generation, boasting a registered capacity of 1,200 MW, despite weaker resources, as industrial users seek tariff relief. Limpopo and North West see traction in mining self-generation, while Mpumalanga's coal sector hinders the expansion of renewable build, leaving a structurally heterogeneous landscape for the South African renewable energy market.
Competitive Landscape
International developers lead a moderately concentrated field. Scatec ASA operates the 540 MW Kenhardt solar-plus-storage flagship, while EDF Renewables controls a 1.2 GW pipeline across multiple provinces. Enel Green Power and Mainstream Renewable Power develop hybrid systems with advanced energy management. Local firms such as Mulilo and SolarAfrica gain ground through BBBEE partnerships and distributed solutions.
M&A activity accelerated: Aggreko acquired RenEnergy in July 2024 to expand its C&I reach, and Greenstreet acquired select Scatec assets for portfolio diversification. Swedfund and IFU placed USD 44 million into Sturdee Energy, underscoring investor appetite even amid grid bottlenecks. Competitive edges center on financing strength, hybrid design skills, and compliance with local-content thresholds that reach 45% in some bid windows.
White-space opportunities span rural mini-grids, green hydrogen exports, and heavy-industry heat electrification, but all hinge on incoming regulation. Combined, the top five developers controlled roughly 45% of installed capacity in 2024, supporting the moderate profile of the South Africa renewable energy market.
South Africa Renewable Energy Industry Leaders
-
Mainstream Renewable Power Ltd
-
EDF Renewables
-
Scatec ASA
-
Enel Green Power
-
ENGIE SA
- *Disclaimer: Major Players sorted in no particular order

Recent Industry Developments
- December 2024: Swedfund and IFU committed USD 44 million to Sturdee Energy for commercial and industrial (C&I) solar and storage expansion.
- October 2024: The Parliament enacted the Electricity Regulation Amendment Act, which widened private-sector access to generation licenses.
- August 2024: AIKO Energy and VEERS Group have formed a joint venture for domestic solar panel manufacturing.
- January 2024: Aggreko finalized the acquisition of RenEnergy to boost its distributed-generation offerings.


South Africa Renewable Energy Market Report Scope
Renewable energy refers to the utilization of resources replenished by nature on a human timescale, including sunlight, wind, the movement of water, and geothermal heat. The South African renewable energy market considers the total installed capacity of renewable energy sources in South Africa, which includes new renewable energy projects such as wind, solar, etc.
The renewable energy market is segmented by type into wind, solar, hydropower, and other types. For each segment, the market sizing and forecasts have been done based on installed capacity (MW).
By Technology
| Solar Energy (PV and CSP) |
| Wind Energy (Onshore and Offshore) |
| Hydropower (Small, Large, PSH) |
| Bioenergy |
| Geothermal |
| Ocean Energy (Tidal and Wave) |
By End-User
| Utilities |
| Commercial and Industrial |
| Residential |
| By Technology | Solar Energy (PV and CSP) |
| Wind Energy (Onshore and Offshore) | |
| Hydropower (Small, Large, PSH) | |
| Bioenergy | |
| Geothermal | |
| Ocean Energy (Tidal and Wave) | |
| By End-User | Utilities |
| Commercial and Industrial | |
| Residential |


Key Questions Answered in the Report
What is the projected capacity of the South Africa renewable energy market in 2031?
The market is forecast to reach 31.31 GW by 2031, up from 18.18 GW in 2026.
Which segment holds the largest South Africa renewable energy market share?
Solar PV leads with 49.12% share in 2025, while wind is the fastest-growing technology segment.
How fast is the utilities segment growing?
Utilities are expected to expand at a 12.55% CAGR through 2031, the quickest among end-users.
Why are electricity tariffs driving renewable uptake?
Grid tariffs rose 190% since 2014, while new solar contracts price near a third of Eskom rates, spurring C&I uptake.
What are the main obstacles for new projects?
Transmission congestion in the Northern Cape and elevated financing costs remain the leading constraints on new capacity.
Page last updated on:


