
Solid Waste Management Market Size and Share
Market Overview
| Study Period | 2020 - 2031 |
|---|---|
| Market Size (2026) | USD 1.44 Trillion |
| Market Size (2031) | USD 1.93 Trillion |
| Growth Rate (2026 - 2031) | 6.13 % |
| Fastest Growing Market | Asia-Pacific |
| Largest Market | Asia-Pacific |
| Market Concentration | Low |
Major Players *Disclaimer: Major Players sorted in no particular order Image © Mordor Intelligence. Reuse requires attribution under CC BY 4.0. | |
Solid Waste Management Market Analysis by Mordor Intelligence
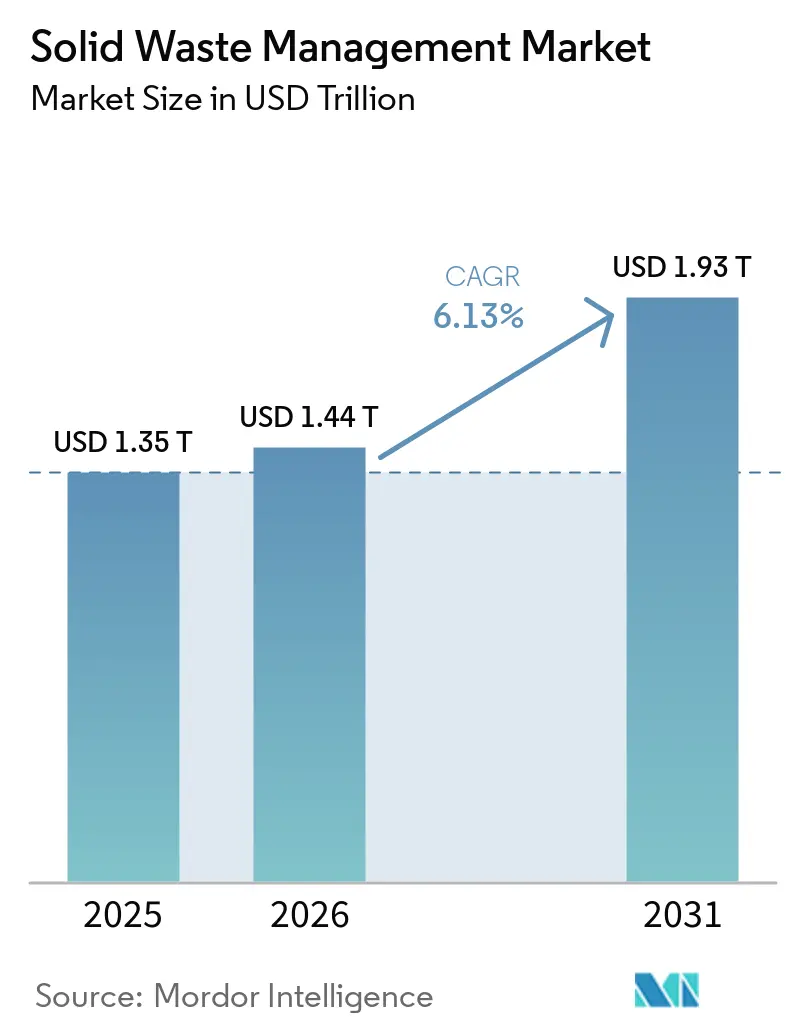
The Solid Waste Management Market size is expected to grow from USD 1.35 trillion in 2025 to USD 1.44 trillion in 2026 and is forecast to reach USD 1.93 trillion by 2031 at 6.13% CAGR over 2026-2031.
Extended producer responsibility rules are shifting part of the financial burden for packaging collection and recycling from municipal budgets to producers, thereby supporting more predictable operator revenue. The European Union Packaging and Packaging Waste Regulation requires producer-funded systems across its member states and links financial contributions to packaging design, increasing demand for sorting and recovery capacity. Large operators are directing capital toward recycling automation, renewable natural gas, and specialty waste assets, while lower segregation rates, commodity-price movements, scarce land, and siting opposition limit returns in several regions. The solid waste management market, therefore, favors operators that combine collection networks, processing assets, compliance capabilities, and long-term contracts.
Key Report Takeaways
- By service type, collection services held 39.3% of the solid waste management market share in 2025, while waste-to-energy is forecast to expand at an 11.3% CAGR through 2031.
- By waste type, municipal solid waste accounted for 49.6% of the solid waste management market size in 2025, while medical waste recorded the highest projected CAGR at 7.5% through 2031.
- By source, residential waste held 54.2% of the solid waste management market share in 2025, while Industrial waste is forecast to grow at a 7.0% CAGR through 2031.
Note: Market size and forecast figures in this report are generated using Mordor Intelligence’s proprietary estimation framework, updated with the latest available data and insights as of January 2026.
Global Solid Waste Management Market Trends and Insights
Drivers Impact Analysis*
| Driver | (~) % Impact on CAGR Forecast | Geographic Relevance | Impact Timeline |
|---|---|---|---|
| Adoption of Extended Producer Responsibility (EPR) Frameworks | +1.2% | Global, with early gains in Europe, North America, and Australia | Medium term (2-4 years) |
| Investments in Waste-to-Energy (WtE) Technologies | +1.0% | Asia-Pacific, with spillover to the Middle East, Africa, and Europe | Long term (≥ 4 years) |
| Corporate ESG Commitments | +0.8% | Global, concentrated in North America and Europe | Medium term (2-4 years) |
| Circular Economy Initiatives | +0.7% | Europe, China, South Korea, and Japan | Long term (≥ 4 years) |
| AI, Optical Sensors & Smart Waste Systems | +0.6% | North America and Western Europe | Medium term (2-4 years) |
| Public-Private Partnerships for Waste Infrastructure | +0.5% | Asia-Pacific, the Middle East, Africa, and South America | Long term (≥ 4 years) |
| Source: Mordor Intelligence | |||
Adoption of Extended Producer Responsibility Frameworks
Extended Producer Responsibility (EPR) frameworks are transforming the financing structure of the solid waste management market by shifting the responsibility for collection, sorting, recycling, and end-of-life management from municipal authorities to producers and brand owners. This transition reduces the financial burden on local governments while creating a stable, long-term funding mechanism for waste collection and recycling infrastructure. The European Union Regulation (EU) 2025/40 mandates producer-funded packaging EPR systems across all 27 member states and introduces recyclability performance grades, enabling eco-modulated fees based on the sustainability and recyclability of packaging materials.[1]European Union, “Packaging and Packaging Waste Regulation,” EUR-Lex, eur-lex.europa.eu As a result, manufacturers are increasingly adopting circular packaging designs and investing in recyclable materials. These regulations are accelerating investments in advanced sorting technologies, material recovery facilities (MRFs), and recycling plants to meet higher recovery targets. Similar momentum has emerged in North America, where Oregon launched its packaging EPR program in July 2025, and Maryland opened producer registration in May 2026, signaling broader adoption of producer-funded waste management models.[2]Maryland Department of the Environment, “PPP EPR Compliance Guide for COMAR 26.04.14,” Maryland Department of the Environment, mde.maryland.gov
Investments in Waste-to-Energy Technologies
Waste-to-energy (WtE) investment is increasingly integrated into broader energy infrastructure planning, positioning municipal solid waste as a valuable resource for electricity and heat generation while reducing reliance on landfills. In Europe, stringent landfill diversion regulations and circular economy targets continue to drive investment in thermal waste recovery facilities, while several Southeast Asian countries are expanding public procurement programs and public-private partnerships to develop modern WtE infrastructure. Many new facilities are also incorporating carbon capture, utilization, and storage (CCUS) technologies to reduce emissions and improve access to green financing where supportive policy frameworks exist. These projects typically benefit from multiple revenue streams, including municipal gate fees, electricity and heat sales, renewable energy incentives, and, in some markets, carbon-related revenues. This diversified income model strengthens project economics, improves financial resilience, and enhances investor confidence.
Corporate ESG Commitments
Corporate sustainability commitments are increasing demand for verified diversion, zero-landfill services, and traceable material flows in the solid waste management market. Corporate reporting requirements make waste generation, treatment, and diversion records more important in procurement. Collection and certification contracts can therefore support a customer’s reporting requirements and operating needs. The Science Based Targets initiative had enrolled more than 9,000 companies by 2025 and includes value-chain emissions requirements that bring supplier waste practices into procurement decisions.[3]Science Based Targets Initiative, “Corporate Resources,” Science Based Targets Initiative, sciencebasedtargets.org Industrial and commercial customers increasingly need documentation that verifies treatment and diversion. As a result, operators with strong compliance records and reliable reporting systems gain a competitive advantage in securing contracts.
Circular Economy Initiatives
Circular economy policies are changing the role of discarded materials in the solid waste management market, shifting them from disposal liabilities to valuable manufacturing inputs. The European Union Circular Economy Action Plan and Regulation (EU) 2025/40 strengthen requirements for recycled content, packaging circularity, reuse, and improved material management across industries. These measures are increasing investment in advanced material recovery facilities (MRFs), AI-enabled sorting technologies, chemical recycling plants, and closed-loop recycling systems to improve resource efficiency. At the same time, manufacturers are increasingly incorporating recycled raw materials into production to meet regulatory obligations and sustainability targets, creating stable demand for recovered materials. South Korea and Japan have achieved municipal waste landfill diversion rates exceeding 95% through decades of investment in source segregation, high-efficiency collection systems, advanced sorting infrastructure, waste-to-energy integration, and well-developed secondary material markets supported by extended producer responsibility (EPR) programs. Their experience demonstrates that circular economy policies deliver the greatest impact when collection, sorting, recycling infrastructure, and end-use markets for recovered materials are developed simultaneously.
Restraints Impact Analysis*
| Restraint | (~) % Impact on CAGR Forecast | Geographic Relevance | Impact Timeline |
|---|---|---|---|
| Low Waste Segregation Rates | -0.6% | Asia-Pacific, the Middle East, Africa, South America, and some lower-income European countries | Medium term (2-4 years) |
| Informal Waste Sector Competition | -0.5% | Asia-Pacific, the Middle East, Africa, and South America, especially urban centers | Long term (≥ 4 years) |
| Volatility in Recyclate Prices | -0.4% | Global | Short term (≤ 2 years) |
| Land Scarcity and Public Opposition | -0.3% | North America, Europe, and Asia-Pacific urban corridors | Long term (≥ 4 years) |
| Source: Mordor Intelligence | |||
Low Waste Segregation Rates
Low levels of waste segregation at the source continue to undermine the efficiency and profitability of the solid waste management market by reducing the quality and recoverability of recyclable materials. According to the United Nations Environment Programme (UNEP), only 61–62% of municipal waste globally is managed through formal and controlled waste management systems, while the remaining waste is often disposed of through uncontrolled dumping, open burning, or mixed collection without adequate sorting. Even in developed regions with established regulatory frameworks, segregation challenges persist. Eurostat reports that recycling rates remain below 20% in Romania, Cyprus, and Bulgaria, highlighting that regulatory mandates alone are insufficient to achieve high recycling performance. Poor source segregation results in contamination of recyclable materials with food waste and other mixed refuse, increasing sorting and processing costs while reducing the quality, market value, and recyclability of recovered materials. Although EU Regulation 2025/40 is expected to improve packaging design, recyclability standards, and producer responsibility, the effectiveness of these measures ultimately depends on household participation, public awareness, and the availability of efficient local collection and separate waste segregation systems. Continued investment in source segregation programs, public education campaigns, and modern collection infrastructure will therefore remain essential for improving recycling rates, reducing processing costs, and strengthening the overall economics of the solid waste management market.
Informal Waste Sector Competition
The widespread presence of informal waste collection remains a major challenge to the growth and financial sustainability of the formal solid waste management market, particularly across Asia, Africa, and Latin America. According to the World Economic Forum, informal waste pickers recover approximately 88 million tons of recyclables annually, playing a vital role in resource recovery and reducing the volume of waste sent to landfills. In addition, WIEGO (Women in Informal Employment: Globalizing and Organizing) estimates that informal waste pickers help avoid 0.17–0.39 billion tons of carbon dioxide equivalent (CO₂e) emissions each year by diverting recyclable materials from disposal sites. Despite these significant environmental contributions, informal workers typically collect high-value recyclable materials such as plastics, metals, paper, and cardboard before municipal or private waste collection services arrive. This reduces the availability of valuable recyclables that formal operators rely on to offset the high costs of collecting and processing low-value mixed waste, thereby weakening the economic viability of formal collection systems. Although countries such as Brazil and India have demonstrated the benefits of integrating waste picker cooperatives into municipal waste management through formal recognition, service contracts, and social inclusion programs, these models continue to depend on sustained government support, adequate funding, and effective coordination with local authorities.
*Our forecasts treat driver/restraint impacts as directional, not additive. The impact forecasts reflect baseline growth, mix effects, and variable interactions.
Segment Analysis
By Service Type: Collection Holds the Largest Base While Waste-to-Energy Expands Faster
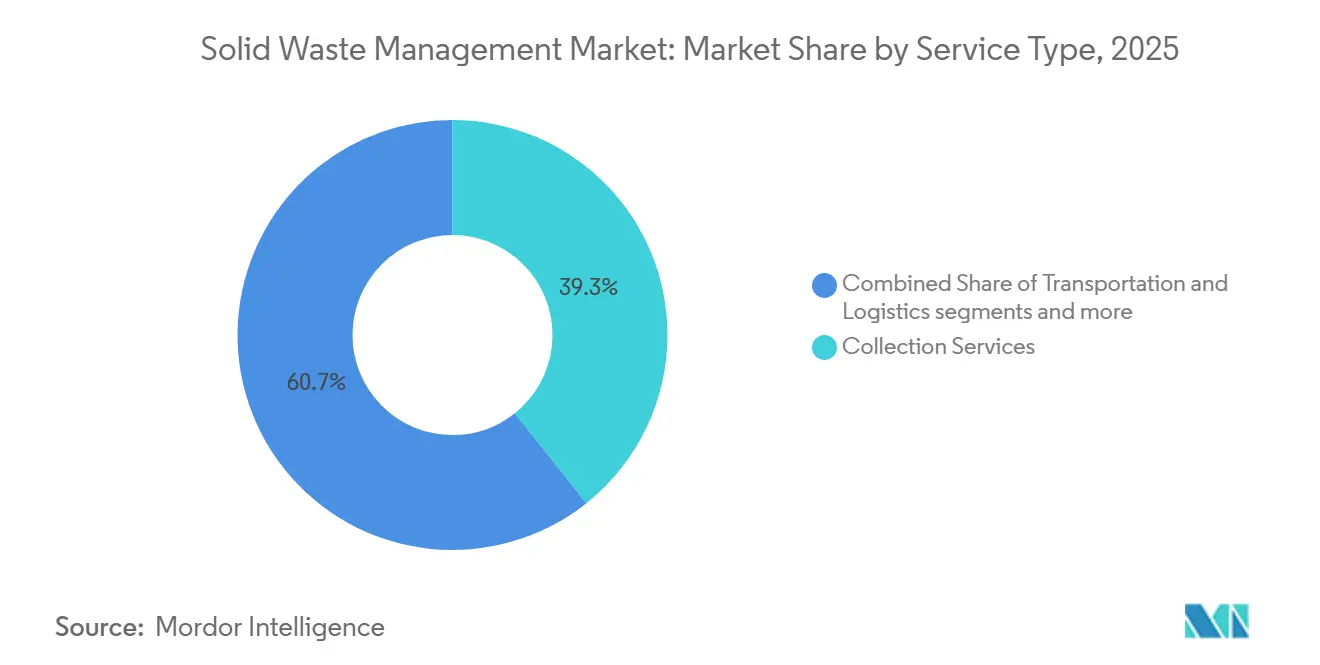
Collection Services held 39.3% of global revenue in 2025. The segment remains essential because material recovery, treatment, and energy recovery need reliable feedstock from collection networks. Multi-year municipal contracts can give operators revenue visibility and support infrastructure financing. Waste-to-Energy is the fastest-growing service type, with the solid waste management market for this activity projected to grow at a 11.3% CAGR from 2026 to 2031. European landfill diversion rules and public procurement programs in Southeast Asia are moving capital toward thermal recovery. Paprec Group secured a 26-year public service delegation in November 2025 to build and operate a waste-to-energy facility in Seine-et-Marne, France, with a contract value of EUR 1.3 billion (USD 1.5 billion).
Recycling and material recovery can improve margins when operators deploy automation and integrate outlets for recovered materials. WM reported that its recycling business delivered more than 22% operating EBITDA growth in 2025 despite lower commodity prices, supported by automation projects. This result indicates that equipment investment can reduce exposure to commodity price swings that affect more labor-intensive operations. Automation can also improve consistency when facilities receive mixed material streams. Transportation and logistics services remain exposed to fuel costs and route efficiency. Smart bins and connected collection systems can reduce unnecessary trips and improve asset use. Treatment and disposal services remain supported by compliance needs, especially for hazardous and clinical waste. Those services retain importance because many regulated streams cannot enter standard municipal processing systems. Other services, including biogas upgrading and carbon-related offerings, are becoming more relevant as operators seek income beyond collection and disposal.



By Waste Type: Municipal Waste Provides Volume, While Medical Waste Grows Faster
Municipal Solid Waste accounted for 49.6% of the solid waste management market size in 2025. Household and urban commercial waste form the basic volume base for most operators. Municipal waste is also the central target of packaging EPR systems in Europe, North America, and Australia. Those rules can improve the recovery value of materials that were previously treated solely as disposal costs. Industrial Waste and Construction and Demolition Waste also support significant operating volumes. Construction and demolition waste remains suited to integrated models that combine collection, recovery, and disposal capacity.
Medical Waste is forecast to expand at a 7.5% CAGR from 2026 to 2031. Regulatory enforcement in Southeast Asia, South Asia, and Latin America is bringing biomedical waste into formal treatment systems. This changes the handling requirements for streams that were previously combined with general municipal waste. Veolia completed its acquisition of Clean Earth, doubling its hazardous waste capacity in the United States. Agricultural waste is smaller in formal service terms, but organic residues can support anaerobic digestion and biomethane production. The growth of specialty treatment reflects the premium fees and compliance requirements attached to regulated waste streams. These characteristics favor providers with licensed facilities, trained staff, and documented handling procedures.
By Source: Residential Waste Anchors Volumes While Industrial Waste Adds Growth
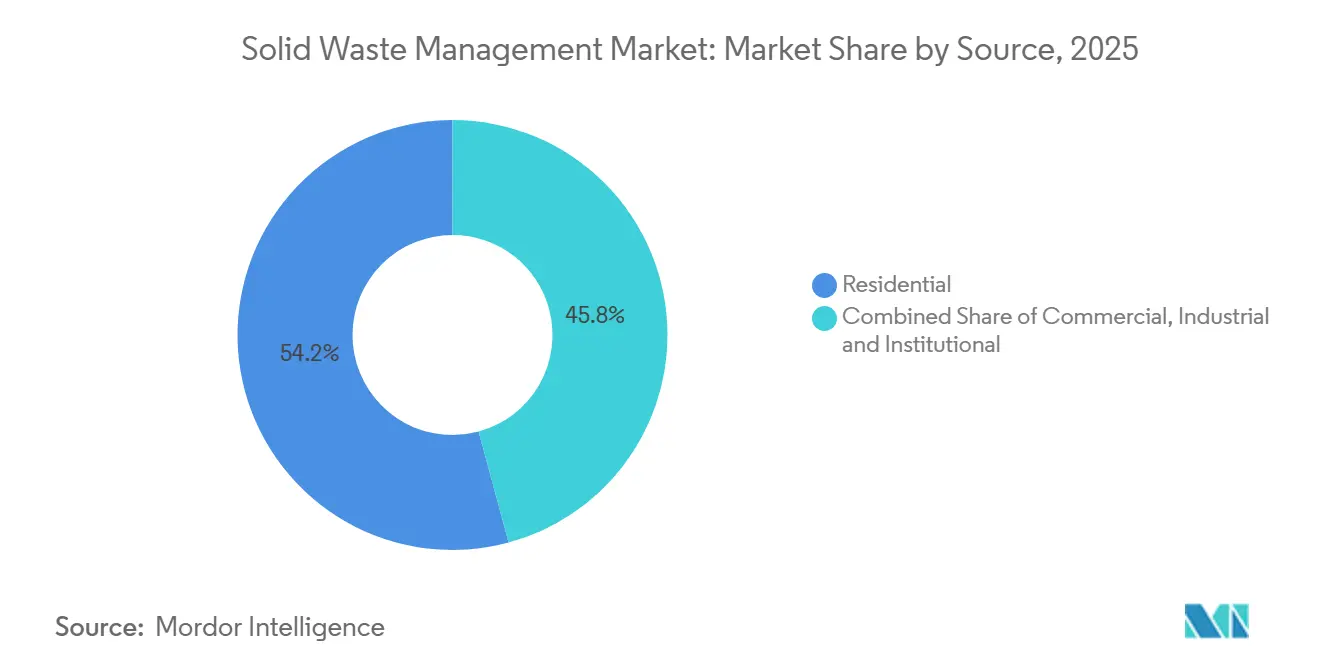
Residential waste held 54.2% of revenue in 2025. Household consumption and mandatory municipal collection create steady volumes across economic cycles. Residential collection also gives operators a route base that can support recycling and organics recovery programs. Industrial waste is projected to grow at a 7.0% CAGR from 2026 to 2031. Manufacturing activity in North America and capacity additions in Southeast Asian pharmaceutical, semiconductor, and food-processing sectors support this demand. These facilities produce regulated non-household waste that often requires specialized services.
Commercial and institutional customers are seeking better diversion records and traceability. Science-Based Targets initiative guidance on value-chain emissions is increasing interest in service providers that can document waste outcomes. This documentation can help reduce customer switching when procurement standards are strict. It also makes service quality more visible than in contracts based only on collection frequency. ISO 14001 is recognized in more than 170 countries and is widely used in environmental management systems. It can function as an entry requirement for institutional and public contracts. Operators that combine compliance documentation with collection and processing capabilities are better placed to serve these sources.
Geography Analysis
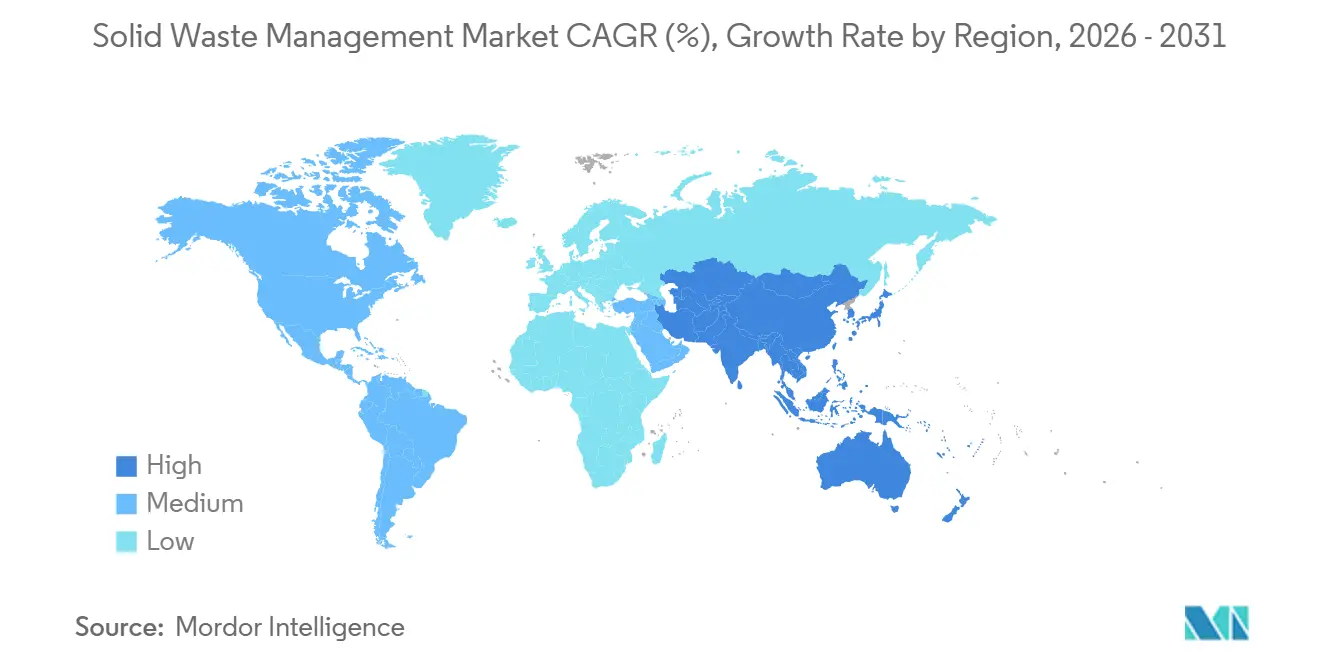
Asia-Pacific held 42% of global revenue in 2025 and is forecast to grow at a 6.4% CAGR through 2031. Urbanization in China, India, Indonesia, Vietnam, and the Philippines is increasing municipal waste volumes as household incomes rise. National waste plans, public procurement, and energy policies are supporting private infrastructure investment across the region. South Korea’s waste planning and India’s Swachh Bharat Mission 2.0 support this investment. The World Bank expects South Asian waste generation to nearly double from 2022 levels by 2050. The region combines rapid demand growth with uneven capacity for collection, separation, and treatment. Its opportunity is therefore strongest where public authorities pair waste targets with practical financing and reliable operating frameworks.
North America and Europe are mature markets for solid waste management, where regulatory updates, technological advancements, and consolidation are driving demand. WM committed USD 3 billion to recycling and renewable natural gas infrastructure from 2022 to 2026. Republic Services stated in February 2026 that it planned to invest USD 1 billion in acquisitions during 2026. Europe’s landfill rules and packaging requirements are directing investment toward sorting, recycling, and energy recovery. The European Union recorded a 43.3% municipal waste recycling rate in 2023, but national results remained uneven. Lower recycling rates in Romania, Cyprus, and Bulgaria indicate remaining needs for collection and processing infrastructure.
South America, the Middle East, and Africa are at earlier stages of formal service development. Informal collection networks and constrained municipal budgets limit the use of advanced treatment systems. Brazil is increasing private-sector activity in landfill, biomethane, and material recovery assets. Gulf Cooperation Council countries are using Vision 2030 and net-zero programs to support the procurement of waste-to-energy and advanced recycling technologies. These programs can create opportunities for multinational operators and local infrastructure partners. Formalization requires collection systems that can reach dense urban areas and underserved communities. It also requires viable treatment facilities for collected materials. According to the World Bank around 2 billion people still lack adequate waste collection services, largely in Sub-Saharan Africa and South Asia. This service gap supports long-term demand for collection and treatment capacity. Projects must still account for local affordability, collection coverage, and the role of existing informal service networks. The solid waste management market can grow in these regions when infrastructure plans include both service access and workable payment models.

Competitive Landscape
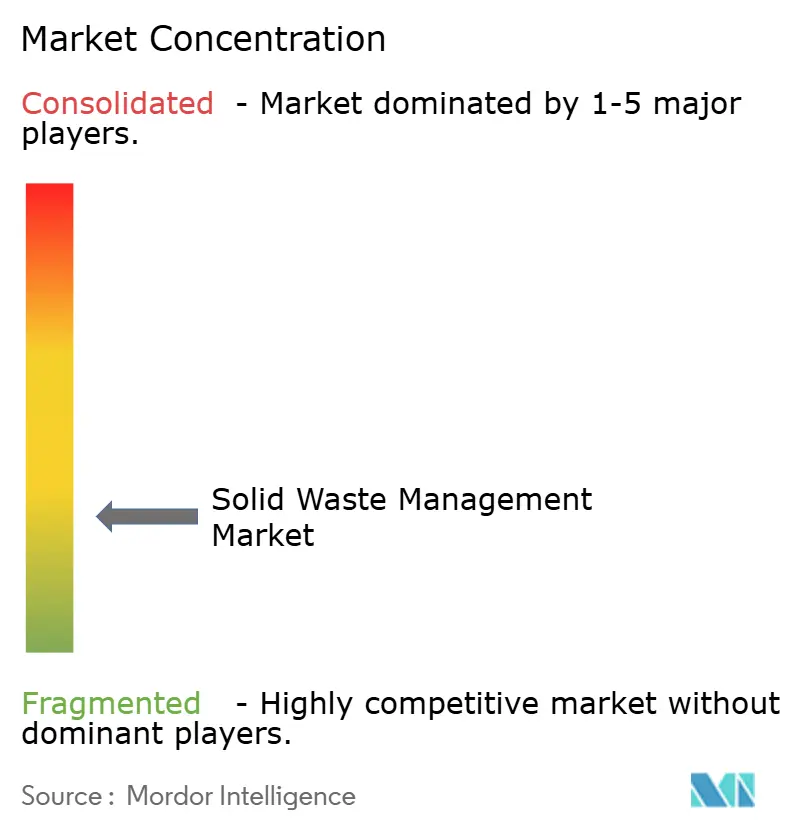
The global solid waste management market exhibits low market concentration. WM and Republic Services are leading operators in North America, while Veolia and REMONDIS have broad positions across Europe, and Cleanaway is a leading player in Australia. Their competitive strengths include extensive access to landfills, recycling, and energy recovery infrastructure, and long-term municipal and industrial contracts. WM’s recycling EBITDA growth of more than 22% in 2025, despite lower recyclate prices, demonstrates the value of automation at scale. Republic Services is expanding its polymer processing centers to strengthen its participation in recycled-plastics value chains.
Strategic acquisitions are reshaping the competitive landscape ahead of the full impact of new waste regulations. In April 2026, GFL Environmental completed the acquisition of SECURE Waste Infrastructure for CAD 6.4 billion (USD 4.6 billion), expanding its treatment and processing network in Western Canada. Veolia completed its USD 3 billion acquisition of Clean Earth, doubling its hazardous waste treatment capacity in the United States. These transactions highlight the increasing importance of specialty waste management and regional network expansion. Medical waste formalization in Asia and Latin America is expected to create additional growth opportunities for established operators.
Digital technologies are improving route optimization, operational monitoring, and compliance reporting while helping operators identify service gaps, contamination, and collection inefficiencies. However, municipal and industrial customers continue to favor providers with proven operational capabilities and environmental certifications such as ISO 14001. Waste-to-energy, recycling automation, renewable natural gas, and specialty treatment facilities enable leading companies to recover more value from collected waste and improve operational efficiency.
Regional and niche providers remain competitive in local collection and specialized services, but large-scale infrastructure, regulatory approvals, and financial requirements create significant barriers to entry. As a result, smaller companies often rely on larger operators for disposal or advanced treatment and recycling facilities. Long-term contracts and established customer relationships further strengthen incumbent positions, supporting continued consolidation as companies expand geographic coverage and specialized waste capabilities while improving resilience to changing material prices and environmental regulations.
Solid Waste Management Industry Leaders
Waste Management, Inc.
Republic Services, Inc.
Veolia Environnement SA
Waste Connections, Inc.
Renewi plc
- *Disclaimer: Major Players sorted in no particular order

Recent Industry Developments
- April 2026: GFL Environmental has completed the acquisition of SECURE Waste Infrastructure Corp. for CAD 6.4 billion (USD 4.6 billion), expanding its Western Canadian collection, treatment, and processing network. The acquisition has broadened GFL's industrial waste and energy infrastructure portfolio, increased route density, and vertically integrated waste collection with treatment and disposal assets across Western Canada.
- June 2026: Veolia has completed its USD 3 billion acquisition of Clean Earth, doubling its United States hazardous waste treatment capacity. The transaction has significantly strengthened Veolia's position in the North American hazardous waste market and enhanced its ability to serve industrial, healthcare, and environmental remediation customers through an expanded nationwide treatment network.
- January 2026: WM has reported completing 7 renewable natural gas (RNG) facilities and 9 recycling automation projects in 2025, with additional projects planned for 2026. These investments are expected to support WM's strategy to increase renewable energy production, improve material recovery efficiency through automation, and generate higher-margin revenue from sustainability-focused infrastructure.
- November 2025: Paprec Group secured a EUR 1.3 billion (USD 1.5 billion) public service delegation to build and operate a waste-to-energy facility in Seine-et-Marne, France, for 26 years. The long-term concession is expected to provide stable, recurring revenues while reinforcing Paprec's expansion in energy recovery, supporting France's landfill diversion and circular economy objectives, and advancing Paprec's growth.


Global Solid Waste Management Market Report Scope
The Solid Waste Management Market is Segmented by Service Type (Collection Services, Transportation & Logistics, and more), By Waste Type (Municipal Solid Waste, Industrial Waste, and more), by Source (Residential, Commercial, Industrial, and Institutional), and Geography (North America, South America, Europe, Asia Pacific, and Middle East and Africa). The Market Forecasts are Provided in Terms of Value (USD).
| Collection Services |
| Transportation & Logistics |
| Recycling & Material Recovery |
| Treatment & Disposal |
| Waste-to-Energy |
| Others |
| Municipal Solid Waste |
| Industrial Waste |
| Hazardous Waste |
| Construction & Demolition Waste |
| Agricultural Waste |
| Medical Waste |
| Others |
| Residential |
| Commercial |
| Industrial |
| Institutional |
| North America | United States |
| Canada | |
| Mexico | |
| South America | Brazil |
| Argentina | |
| Rest of South America | |
| Europe | Germany |
| United Kingdom | |
| France | |
| Italy | |
| Spain | |
| Russia | |
| Rest of Europe | |
| Asia-Pacific | China |
| India | |
| Japan | |
| South Korea | |
| Australia | |
| Southeast Asia (Indonesia, Vietnam, Thailand, Malaysia, Philippines) | |
| Rest of Asia-Pacific | |
| Middle East & Africa | GCC |
| South Africa | |
| Egypt | |
| Rest of Middle East & Africa |
| By Service Type | Collection Services | |
| Transportation & Logistics | ||
| Recycling & Material Recovery | ||
| Treatment & Disposal | ||
| Waste-to-Energy | ||
| Others | ||
| By Waste Type | Municipal Solid Waste | |
| Industrial Waste | ||
| Hazardous Waste | ||
| Construction & Demolition Waste | ||
| Agricultural Waste | ||
| Medical Waste | ||
| Others | ||
| By Source | Residential | |
| Commercial | ||
| Industrial | ||
| Institutional | ||
| By Geography | North America | United States |
| Canada | ||
| Mexico | ||
| South America | Brazil | |
| Argentina | ||
| Rest of South America | ||
| Europe | Germany | |
| United Kingdom | ||
| France | ||
| Italy | ||
| Spain | ||
| Russia | ||
| Rest of Europe | ||
| Asia-Pacific | China | |
| India | ||
| Japan | ||
| South Korea | ||
| Australia | ||
| Southeast Asia (Indonesia, Vietnam, Thailand, Malaysia, Philippines) | ||
| Rest of Asia-Pacific | ||
| Middle East & Africa | GCC | |
| South Africa | ||
| Egypt | ||
| Rest of Middle East & Africa | ||


Key Questions Answered in the Report
What is the projected value of the solid waste management market by 2031?
The solid waste management market is projected to reach USD 1.9 trillion by 2031, following a 6.13% CAGR from 2026. The forecast reflects rising waste volumes and continued investment in formal collection, recovery, and treatment capacity.
Which service type is growing fastest in solid waste management?
Waste-to-Energy is the fastest-growing service type, with an expected 11.30% CAGR through 2031. Landfill diversion policies and the need for long-term treatment capacity support its growth.
Which waste type has the largest share of revenue?
Municipal Solid Waste held 49.60% of revenue in 2025, making it the largest waste type. Household and urban commercial waste form the basis for collection, recovery, and disposal services.
Why is medical waste expanding faster than other waste types?
Medical Waste is projected to grow at a 7.45% CAGR as more countries enforce formal collection and treatment of biomedical waste. Regulated handling and treatment requirements support specialized service demand.
Which region leads global solid waste management revenue?
Asia-Pacific accounted for 42% of global revenue in 2025 and is the fastest-growing regional segment, with a 6.4% CAGR. Urbanization and gaps in formal infrastructure support demand across several major economies.
What are the main barriers to expanding formal waste services?
Low source segregation and informal collection can reduce material quality and limit revenues available to formal operators. Land availability, local permitting, and public acceptance can also slow new infrastructure projects.
Page last updated on:


 Your data is secure and never sold or shared.


