Smart Pumps Market Size and Share
Market Overview
| Study Period | 2020 - 2031 |
|---|---|
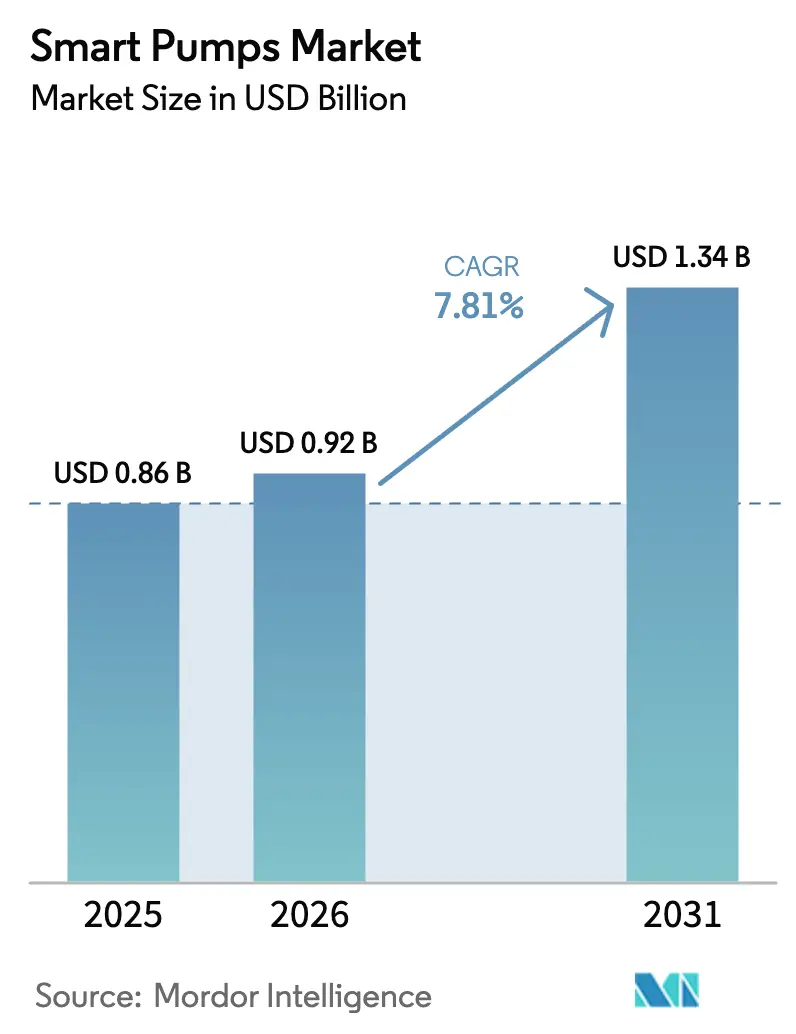
| Market Size (2026) | USD 0.92 Billion |
| Market Size (2031) | USD 1.34 Billion |
| Growth Rate (2026 - 2031) | 7.81% CAGR |
| Fastest Growing Market | Middle East |
| Largest Market | Asia Pacific |
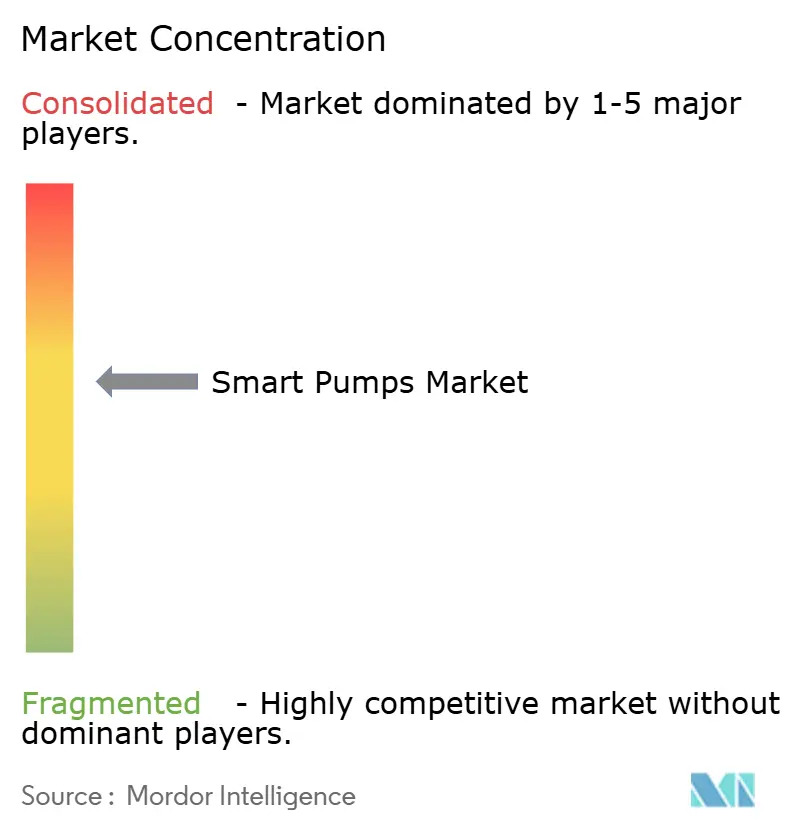
| Market Concentration | Medium |
Major Players *Disclaimer: Major Players sorted in no particular order Image © Mordor Intelligence. Reuse requires attribution under CC BY 4.0. | |
Smart Pumps Market Analysis by Mordor Intelligence
The smart pumps market size was valued at USD 0.86 billion in 2025 and estimated to grow from USD 0.92 billion in 2026 to reach USD 1.34 billion by 2031, at a CAGR of 7.81% during the forecast period (2026-2031). Tightening energy-efficiency rules, rapid adoption of the industrial Internet of Things, and steady improvements in edge analytics are expanding the addressable market for connected pumping solutions. Utilities across North America are spending Infrastructure Investment and Jobs Act grants on variable-frequency drive retrofits that trim electricity use by 30%-50%, while Asian manufacturers are integrating predictive-maintenance functions to meet ISO 50001 certification targets. Competitive intensity is rising as legacy equipment vendors embed digital twin models and machine-learning fault codes to defend their installed bases against software-centric newcomers. At the same time, protocol fragmentation among Modbus, BACnet, and proprietary fieldbus standards is inflating integration costs in many brownfield plants, underscoring the need for open-architecture approaches as the smart pumps market moves toward platform-led differentiation.
Key Report Takeaways
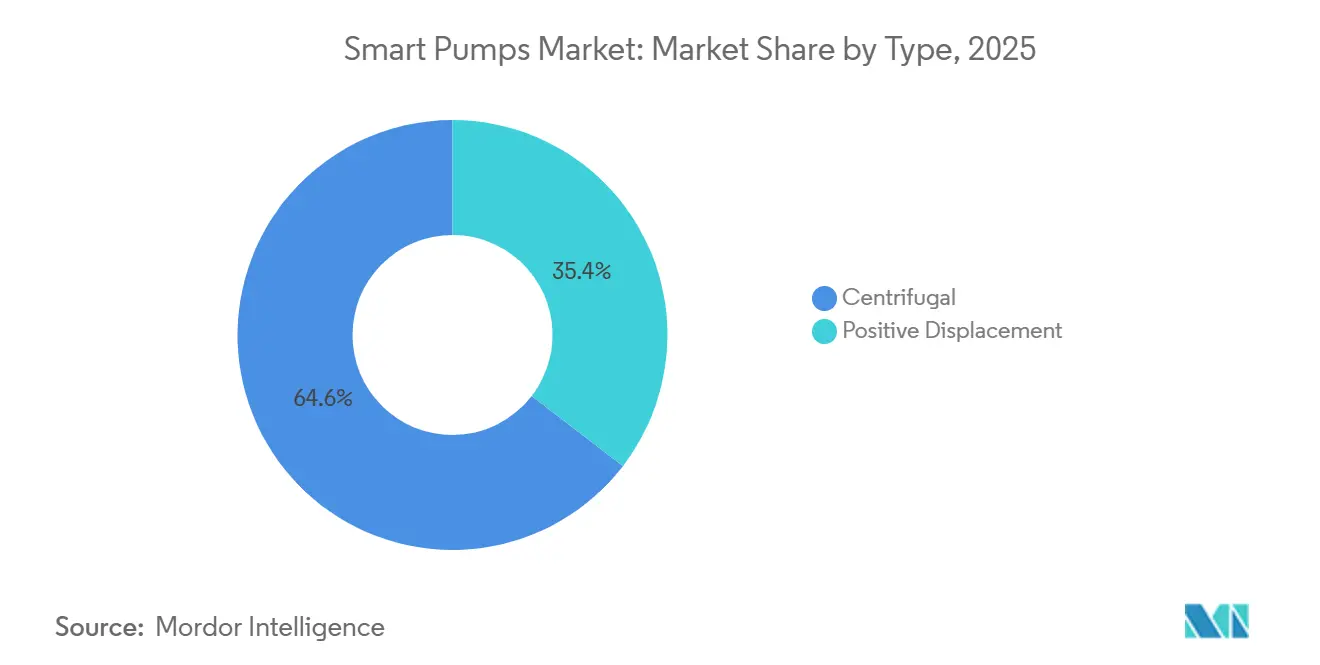
- By type, centrifugal configurations led with 64.56% revenue share in 2025, whereas positive displacement variants are projected to expand at an 8.07% CAGR through 2031.
- By connectivity, wired architectures accounted for 53.82% of the smart pumps market size in 2025, while wireless solutions are forecast to grow at an 8.03% CAGR over 2026-2031.
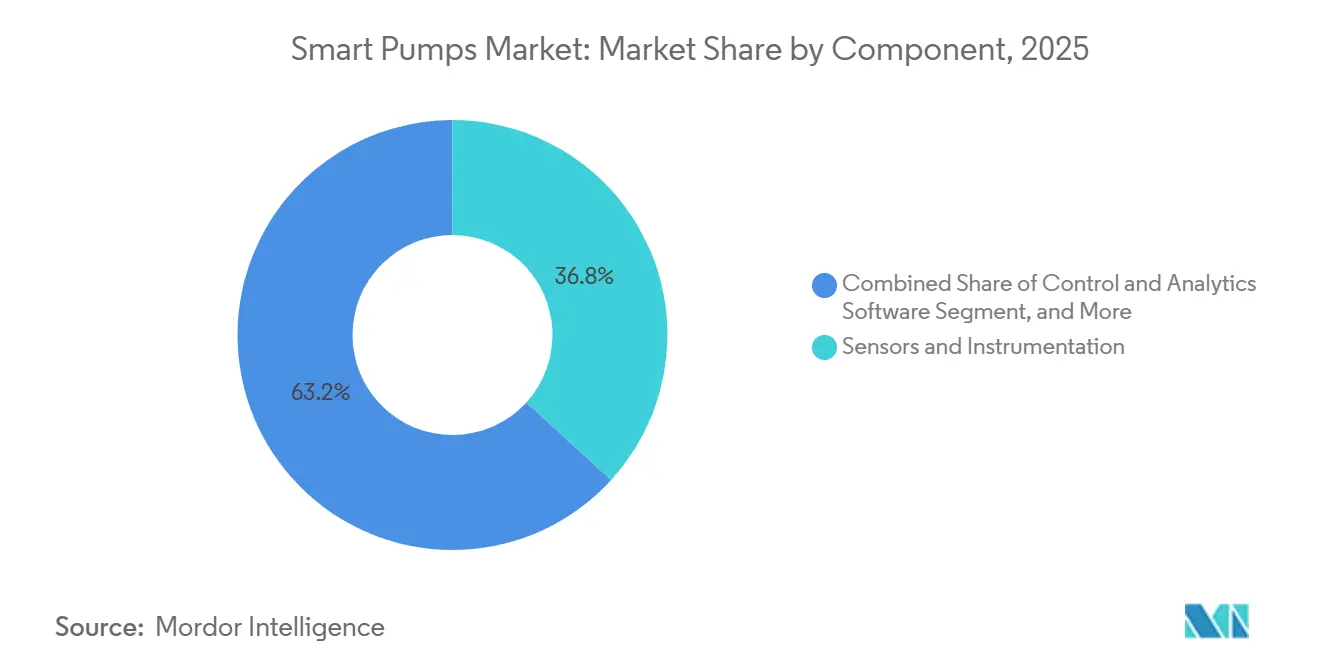
- By component, sensors and instrumentation accounted for 36.77% of the smart pumps market size in 2025, yet control and analytics software is expected to accelerate at an 8.67% CAGR through 2031.
- By end user, water and wastewater applications accounted for 28.91% of 2025 demand, and pharmaceutical installations are set to grow at a 9.44% CAGR through 2031.
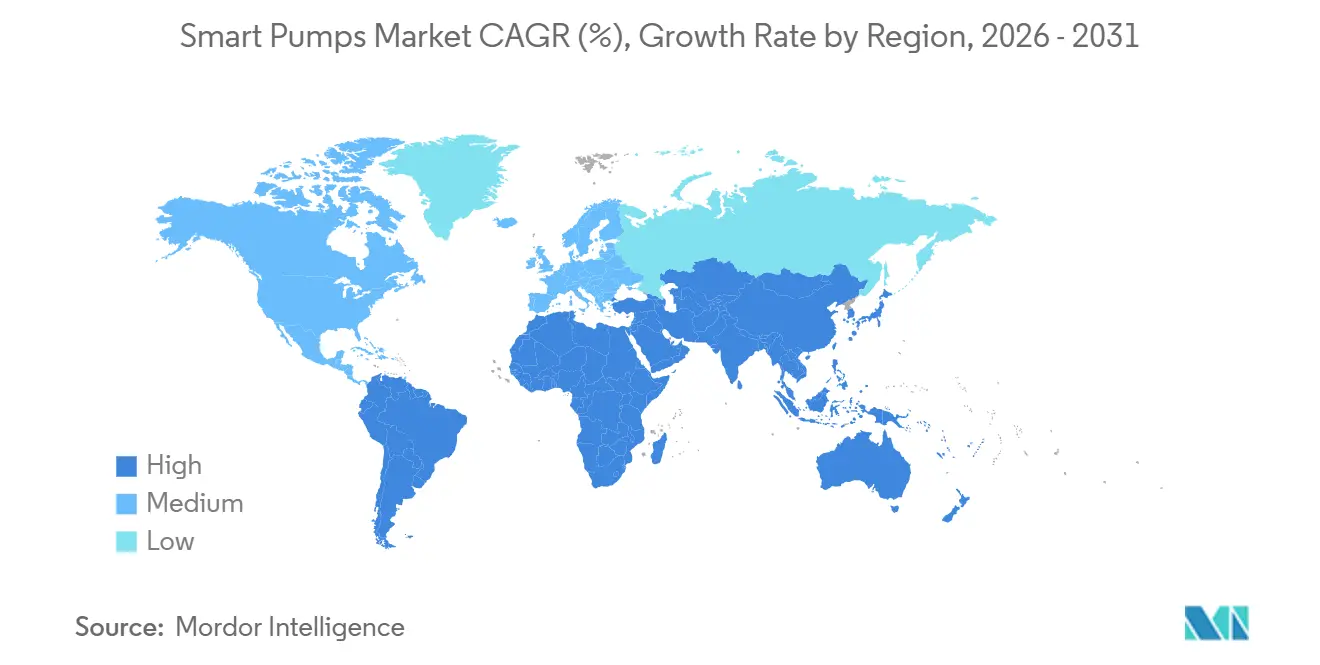
- By geography, Asia-Pacific accounted for 38.26% of global revenue in 2025, whereas the Middle East is the fastest-growing region, with an 8.89% CAGR expected over the forecast horizon.
Note: Market size and forecast figures in this report are generated using Mordor Intelligence’s proprietary estimation framework, updated with the latest available data and insights as of 2026.
Global Smart Pumps Market Trends and Insights
Drivers Impact Analysis*
| Driver | (~) % Impact on CAGR Forecast | Geographic Relevance | Impact Timeline |
|---|---|---|---|
| Digitization of Oil and Gas Industry | +1.8% | Global, with concentration in Middle East, North America, and Asia-Pacific offshore basins | Medium term (2-4 years) |
| Increasing Adoption of IoT-Enabled Pumping Systems | +1.6% | Global, led by North America and Europe utilities, expanding to Asia-Pacific smart cities | Short term (≤ 2 years) |
| Stringent Energy-Efficiency Regulations for Fluid-Handling Equipment | +1.4% | North America and Europe, with emerging mandates in China and India | Long term (≥ 4 years) |
| AI-Driven Predictive-Maintenance Programs in Utilities | +1.2% | North America and Europe municipal water, spillover to Asia-Pacific industrial clusters | Medium term (2-4 years) |
| Edge-Analytics for Remote Water and Wastewater Assets | +1.0% | Asia-Pacific rural infrastructure, Middle East desalination, North America rural utilities | Medium term (2-4 years) |
| Embedded Digital Twin Models for Pump Performance Optimization | +0.9% | Global industrial sectors, early adoption in pharmaceuticals and power generation | Long term (≥ 4 years) |
| Source: Mordor Intelligence | |||
Digitization of Oil and Gas Industry
Upstream and midstream operators are linking smart pumps to supervisory control systems so that vibration and temperature anomalies trigger automatic shutdowns in line with IEC 61508 functional-safety rules. Saudi Aramco reported a 22% year-over-year drop in pump failures during 2025 after deploying predictive analytics, saving USD 180 million in avoided downtime.[1]Saudi Aramco, “Sustainability Report 2025,” saudiaramco.com Wireless sensor networks are pivotal on unmanned North Sea and Gulf of Mexico platforms, where satellite backhaul avoids the expense of subsea fiber runs. Local edge modules now process multiphase-booster data, enabling alarms to reach control rooms within seconds and supporting the drive toward lights-out operations in unconventional shale fields.
Increasing Adoption of IoT-Enabled Pumping Systems
Municipal utilities retrofit legacy stations with gateways that collect flow, pressure, and motor-current data for cloud algorithms that flag inefficiencies in real time. The United States Environmental Protection Agency’s WaterSense partners reduced pump energy intensity by 18% in 2025, saving 4.2 terawatt-hours of electricity.[2]U.S. Environmental Protection Agency, “WaterSense Program Annual Report 2025,” epa.gov Grundfos’ iSolutions platform, trained on 15 million operating hours, predicts bearing failures 6 weeks in advance, giving operators longer maintenance windows. Low-power wide-area networks now extend coverage to rural lift stations and farm irrigation sites that previously lacked cellular coverage, broadening early adoption beyond metropolitan areas.
Stringent Energy-Efficiency Regulations for Fluid-Handling Equipment
Regulators are pushing variable-speed architectures into both new builds and retrofits. The United States Department of Energy rule, effective January 2025, mandates minimum energy performance indices for clean-water pumps with a horsepower rating above 1.[3]U.S. Department of Energy, “Energy Conservation Standards for Pumps; Final Rule,” federalregister.gov The European Union’s 2024 Ecodesign amendment requires digital product passports to document lifetime energy consumption, while China’s revised efficiency labels promote permanent-magnet motors. Facility managers now compare life-cycle operating cost rather than purchase price, tilting tenders toward smart pumps with onboard power monitoring.
AI-Driven Predictive-Maintenance Programs in Utilities
Machine-learning models increasingly analyze vibration spectra and hydraulic curves to schedule repairs only when risk is imminent. Xylem’s analytics suite processed 2.3 billion pump-station data points in 2025, identifying 1,847 anomalies and saving USD 42 million in emergency costs. Digital twins let utilities test the influence of impeller wear on efficiency before committing budget to replacements. German operators rely on these tools to approach the European Union’s 2027 non-revenue-water target of below 15%.
Restraints Impact Analysis*
| Restraint | (~) % Impact on CAGR Forecast | Geographic Relevance | Impact Timeline |
|---|---|---|---|
| High Initial Cost of Installation and Retrofits | -1.1% | Global, acute in Asia-Pacific and South America municipalities with constrained capital budgets | Short term (≤ 2 years) |
| Cyber-Security and Data-Privacy Concerns | -0.9% | North America and Europe critical infrastructure, expanding to Asia-Pacific industrial sectors | Medium term (2-4 years) |
| Protocol Fragmentation and Lack of Interoperability | -0.7% | Global brownfield sites, particularly in chemicals and power generation | Long term (≥ 4 years) |
| Scarcity of Application-Specific AI Talent for Pump Diagnostics | -0.5% | Global, with talent concentration in North America and Europe technology hubs | Long term (≥ 4 years) |
| Source: Mordor Intelligence | |||
High Initial Cost of Installation and Retrofits
A single medium-sized station retrofit can exceed USD 50,000 when drives, sensors, and control panels are factored in, a hurdle for cash-strapped water districts. An American Water Works Association survey showed that 63% of small utilities cited capital scarcity as the main barrier to digitization, despite projected 25%-40% energy savings over 10 years. Legacy power cabinets often need harmonic filters and three-phase upgrades, adding to the financial burden. Performance contracts and rebate programs help close gaps, yet access to concessional finance remains uneven outside North America and Europe.
Cyber-Security and Data-Privacy Concerns
Connecting pumps to the internet widens the attack surface of operational technology networks. The United States Cybersecurity and Infrastructure Security Agency published advisory ICSA-25-073-01 in 2025 that highlighted firmware flaws allowing remote parameter changes. Europe’s Network and Information Security Directive 2.0 requires operators of essential services to conduct risk assessments and report incidents within 24 hours, adding compliance overhead. Utilities now deploy network segmentation, encryption, and multifactor authentication, but the added complexity can lengthen procurement cycles, especially in pharmaceutical plants where telemetry may contain proprietary batch data.
*Our forecasts treat driver/restraint impacts as directional, not additive. The impact forecasts reflect baseline growth, mix effects, and variable interactions.
Segment Analysis
By Type: Positive Displacement Gains on Precision Dosing
Centrifugal pumps accounted for 64.56% of revenue in 2025, underscoring their dominance in high-flow municipal water and district-cooling circuits. Positive displacement designs are forecast to grow at an 8.07% CAGR, outpacing the overall smart pumps market, as peristaltic and diaphragm models meet the precision dosing demands of pharmaceutical clean-in-place operations. The integration of torque sensors and closed-loop controllers enables gear and progressive-cavity units to self-adjust viscosity compensation, thereby reducing batch variability under ISO 9001 programs. Magnetic-drive centrifugal platforms now tackle volatile organic compounds compliance, aligning with updated National Emission Standards for Hazardous Air Pollutants.
Smart pumps market size gains in chemical metering and offshore injection services are reinforcing the shift toward positive displacement variants. Twin-screw technology maintains constant flow despite pressure fluctuation, a key advantage for unconventional reservoirs moving heavier crude. Conversely, centrifugal pumps remain the default for fire protection and emergency cooling, though variable-speed jockey models reduce standby energy draw. Together, these dynamics deepen product segmentation within the smart pumps market.


By Connectivity: Wireless Protocols Mature for Remote Assets
Wired architectures retained a 53.82% share in 2025, thanks to deterministic Modbus RTU and PROFIBUS links in refineries and power plants. Wireless solutions, however, are expanding at an 8.03% CAGR on the back of LoRaWAN, WirelessHART, and ISA100.11a certifications. Private 5G networks on industrial campuses enable low-latency augmented-reality maintenance, cutting mean time to repair by 40% in semiconductor fabs.
Overlay gateways now let operators mesh battery-powered sensors onto existing cable runs, preserving sunk investment in control cabinets. Smart pump market share gains for wireless nodes are most evident in retrofit projects, where conduit trenching costs dwarf sensor prices. Ten-year battery life and vibration-safe housings support installations on offshore rigs and harsh-duty chemical skids. Time-sensitive networking standards are addressing latency concerns, opening the way for wireless emergency-shutdown circuits that meet IEC 61511 safety standards.
By Component: Software Ascends as Analytics Monetization Accelerates
Sensors and instrumentation accounted for 36.77% of 2025 revenue, driven by triaxial accelerometers, ultrasonic flow meters, and MEMS pressure chips that deliver high-resolution data streams. Control and analytics software is projected to grow at an 8.67% CAGR, capturing a growing share of the smart pumps market as vendors pivot to subscription models. Variable-frequency drives powered by silicon-carbide semiconductors remain critical for efficiency, but commoditization is shifting margins toward cloud dashboards and digital twin services.
Digital twins simulate the outcomes of impeller trimming and speed modulation, allowing engineers to benchmark scenarios before buying new hardware. Open-source frameworks and containerized deployments now reduce lock-in, and OPC UA and MQTT interfaces provide multivendor compatibility. As a result, the smart pumps industry is tilting toward platform economics where recurrent analytics fees outweigh initial hardware profits.

By End User: Pharmaceuticals Lead Growth on Compliance Imperatives
Water and wastewater utilities accounted for 28.91% of 2025 shipments, benefiting from government stimulus that targets leak reduction and resilience. Pharmaceutical sites, however, are forecast to expand at a 9.44% CAGR through 2031, driven by real-time release testing under the FDA Quality by Design paradigm. Closed-loop control of flow, pressure, and temperature is now essential to maintain the integrity of electronic records under 21 CFR Part 11.
Building owners retrofit chilled-water loops with variable-speed pumps to comply with ASHRAE 90.1 and secure LEED points, while oil and gas firms digitize artificial-lift strings to curb methane emissions under pending EPA rules. Food and beverage processors use sanitary, 3-A-certified smart pumps to meet Hazard Analysis and Critical Control Points (HACCP) audit requirements. Together, these trends reinforce a diversified demand base that supports steady expansion of the smart pumps market.
Geography Analysis
Asia-Pacific captured 38.26% of the smart pumps market revenue in 2025, propelled by China’s push for smart water grids, India’s Jal Jeevan Mission, and Japan’s seismic-resilient retrofit wave. Provincial mandates now require variable-speed drives in municipal pumping stations, creating multi-year order backlogs. Low-cost manufacturers based in China and South Korea are embedding IoT modules into mid-tier catalog lines, allowing local utilities to adopt predictive maintenance without premium pricing.
North America benefits from USD 55 billion allotted to water infrastructure under the Infrastructure Investment and Jobs Act, as well as Department of Energy efficiency standards that accelerate variable-speed adoption. Utilities use cloud analytics to meet state-level non-revenue-water targets and carbon-neutrality pledges. Europe follows closely, with the Energy Efficiency Directive compelling large enterprises to audit pump floors every four years, while the Water Framework Directive keeps leakage reduction high on utility agendas.
The Middle East is the fastest-growing regional cluster, with an 8.89% CAGR outlook, thanks to multibillion-dollar desalination programs in Saudi Arabia and the United Arab Emirates. Desal plant specifications now demand continuous condition monitoring to maximize uptime in water-scarce deserts. South America and Africa represent smaller yet emerging opportunities, as mining and rural water programs adopt solar-powered, satellite-linked smart pumps to bypass gaps in terrestrial networks. These regional vectors collectively support a broad geographic runway for the smart pumps market.

Competitive Landscape
The smart pumps market is moderately fragmented: the top five suppliers held roughly 40% of 2025 revenue, leaving room for regional challengers and software-only disruptors. Grundfos, Xylem, and Sulzer leverage large installed bases to bundle analytics subscriptions into service contracts, shifting revenue mix from one-time equipment sales to recurring streams. Patent filings reveal a pivot toward hybrid control schemes that marry model-based predictive control with reinforcement learning, enabling autonomous speed adjustments that track fluctuating demand curves.
ABB’s 2025 patent on consensus-based coordination of parallel drives claims 12% energy savings in district-heating networks. Emerson and Siemens have begun embedding pump modules into their distributed control system suites, streamlining procurement for buyers in the process industry. Meanwhile, smaller firms are carving out niches by specializing in explosion-proof wireless sensors and decade-long battery gateways, addressing product needs in hazardous areas.
Strategic partnerships between equipment makers and cloud hyperscalers shorten deployment cycles by hosting digital twins on edge nodes with sub-100 millisecond latency, a requirement for emergency-shutdown circuits on LNG trains. Vendors that can aggregate telemetry across multibrand fleets and apply transfer-learning diagnostics enjoy a data-scale advantage that differentiates software performance. As such, advanced analytics capabilities are becoming the primary competitive lever within the smart pumps market.
Smart Pumps Industry Leaders
Grundfos Holding A/S
Xylem Inc.
Sulzer Ltd.
Flowserve Corporation
Wilo SE
- *Disclaimer: Major Players sorted in no particular order

Recent Industry Developments
- February 2026: Xylem bought a European hydraulics-analytics firm to integrate its machine-learning models into the Advanced Infrastructure Analytics suite, widening software-as-a-service revenue streams.
- January 2026: Grundfos opened a USD 120 million drive and controller plant in Pune, India, with capacity for 500,000 units a year.
- December 2025: Sulzer partnered with a hyperscale cloud provider to host its digital-twin platform on edge nodes, enabling sub-100 ms pump optimization for oil and gas clients.
- November 2025: Flowserve secured a USD 85 million order for smart cryogenic pumps and condition monitoring at a Qatari LNG export terminal.


Global Smart Pumps Market Report Scope
The Smart Pumps Market Report is Segmented by Type (Centrifugal, and Positive Displacement), Connectivity (Wired, and Wireless), Component (Pump Hardware, Sensors and Instrumentation, Variable-Frequency Drives, Control and Analytics Software), End-User (Building Automation, Water and Wastewater, Oil and Gas, Chemicals, Power Generation, Food and Beverage, Pharmaceuticals, Other End-Users), and Geography (North America, South America, Europe, Asia-Pacific, Middle East and Africa). The Market Forecasts are Provided in Terms of Value (USD).
| Centrifugal |
| Positive Displacement |
| Wired |
| Wireless |
| Pump Hardware |
| Sensors and Instrumentation |
| Variable-Frequency Drives |
| Control and Analytics Software |
| Building Automation |
| Water and Wastewater |
| Oil and Gas |
| Chemicals |
| Power Generation |
| Food and Beverage |
| Pharmaceuticals |
| Other End-Users |
| North America | United States | |
| Canada | ||
| Mexico | ||
| South America | Brazil | |
| Argentina | ||
| Rest of South America | ||
| Europe | United Kingdom | |
| Germany | ||
| France | ||
| Italy | ||
| Rest of Europe | ||
| Asia-Pacific | China | |
| Japan | ||
| India | ||
| South Korea | ||
| Rest of Asia-Pacific | ||
| Middle East and Africa | Middle East | United Arab Emirates |
| Saudi Arabia | ||
| Rest of Middle East | ||
| Africa | South Africa | |
| Egypt | ||
| Rest of Africa | ||
| By Type | Centrifugal | ||
| Positive Displacement | |||
| By Connectivity | Wired | ||
| Wireless | |||
| By Component | Pump Hardware | ||
| Sensors and Instrumentation | |||
| Variable-Frequency Drives | |||
| Control and Analytics Software | |||
| By End-User | Building Automation | ||
| Water and Wastewater | |||
| Oil and Gas | |||
| Chemicals | |||
| Power Generation | |||
| Food and Beverage | |||
| Pharmaceuticals | |||
| Other End-Users | |||
| By Geography | North America | United States | |
| Canada | |||
| Mexico | |||
| South America | Brazil | ||
| Argentina | |||
| Rest of South America | |||
| Europe | United Kingdom | ||
| Germany | |||
| France | |||
| Italy | |||
| Rest of Europe | |||
| Asia-Pacific | China | ||
| Japan | |||
| India | |||
| South Korea | |||
| Rest of Asia-Pacific | |||
| Middle East and Africa | Middle East | United Arab Emirates | |
| Saudi Arabia | |||
| Rest of Middle East | |||
| Africa | South Africa | ||
| Egypt | |||
| Rest of Africa | |||


Key Questions Answered in the Report
What is the projected value of the smart pumps market by 2031?
The market is forecast to reach USD 1.34 billion by 2031.
Which pump type will grow fastest through 2031?
Positive displacement models are expected to expand at an 8.07% CAGR, driven by precision-dosing needs in pharmaceuticals and high-viscosity chemical applications.
Why are utilities investing in smart pumps?
Utilities aim to cut energy use by 30%-50% and enable predictive maintenance, benefits demonstrated by U.S. WaterSense participants who saved 4.2 TWh in 2025.
Which region will record the highest growth rate?
The Middle East is projected to grow at an 8.89% CAGR as desalination and oil-and-gas digitization accelerate demand.
How are software revenues changing in the smart pumps domain?
Control and analytics platforms are expected to grow at an 8.67% CAGR, shifting value creation from hardware sales to subscription-based services.
What is the main barrier to adoption for smaller utilities?
High upfront retrofit costs often above USD 50,000 per station remain the primary obstacle despite long-term energy savings potential.
Page last updated on:


