Singapore Chemical Logistics Market Size and Share
Market Overview
| Study Period | 2020 - 2031 |
|---|---|
| Forecast Data Period | 2026 - 2031 |
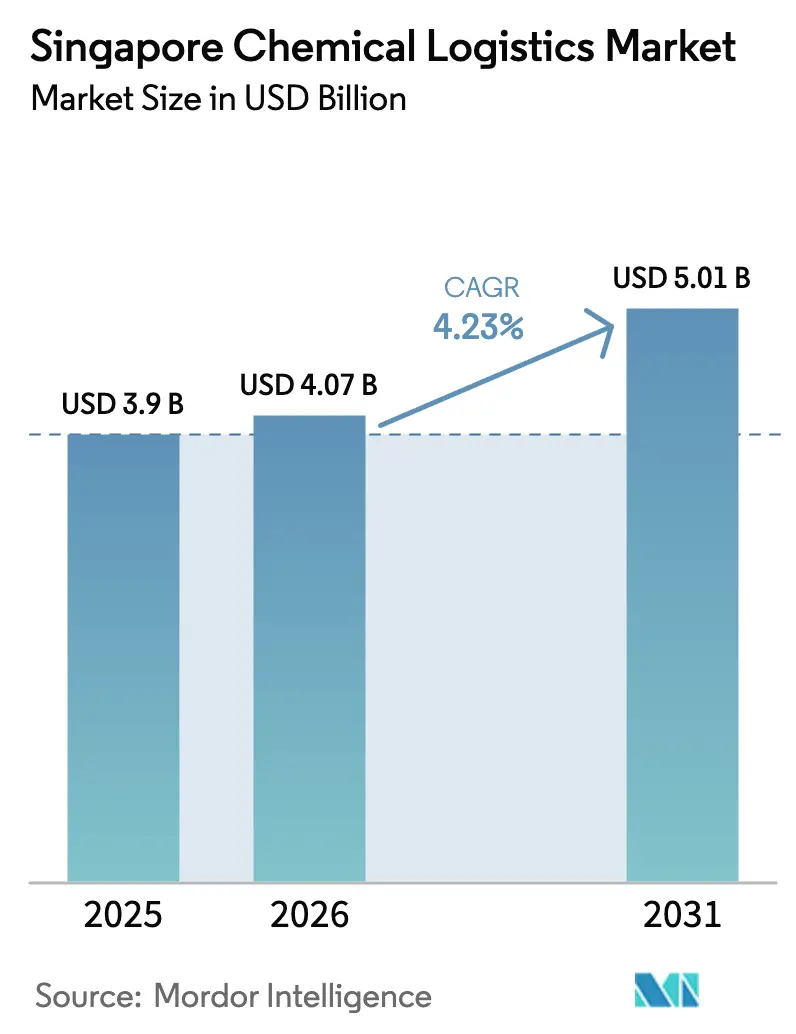
| Base Year Market Size (2025) | USD 3.9 Billion |
| Market Size (2026) | USD 4.07 Billion |
| Market Size (2031) | USD 5.01 Billion |
| Growth Rate (2026 - 2031) | 4.23% CAGR |
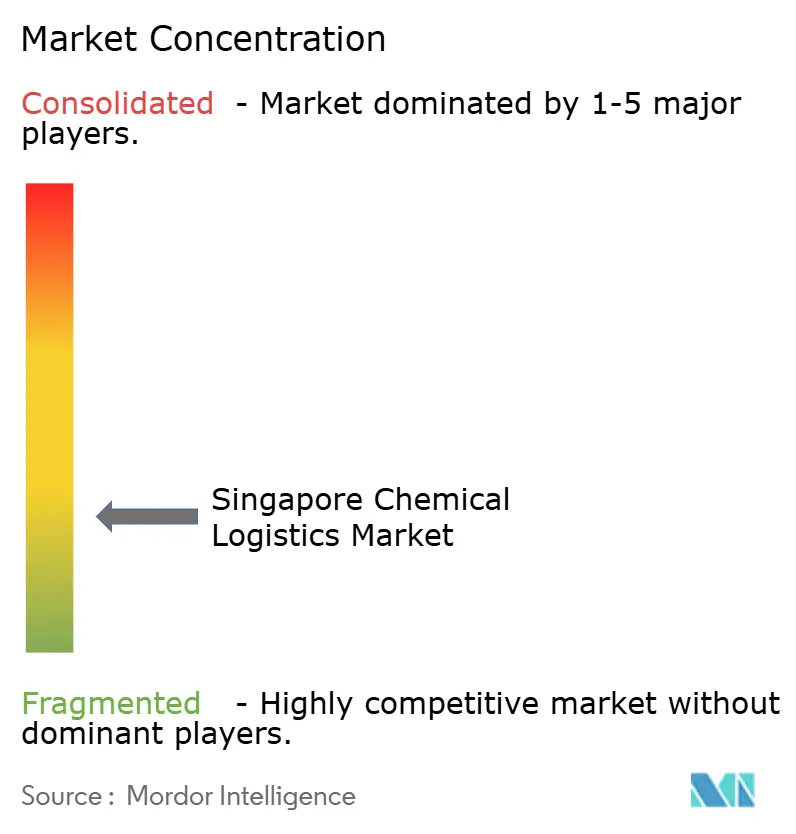
| Market Concentration | Low |
Major Players *Disclaimer: Major Players sorted in no particular order Image © Mordor Intelligence. Reuse requires attribution under CC BY 4.0. | |
Singapore Chemical Logistics Market Analysis by Mordor Intelligence
The Singapore chemical logistics market size was valued at USD 3.9 billion in 2025 and estimated to grow from USD 4.07 billion in 2026 to reach USD 5.01 billion by 2031, at a CAGR of 4.23% during the forecast period (2026-2031).
Chemical re-export flows to Africa and South Asia generate premium margins because importers in those regions rely on Singapore for quality verification and consolidated documentation. SS 667:2020 upgrades are tightening dangerous-goods warehouse supply, favoring capital-rich operators with compliant facilities. Tuas Port’s autonomous yard-truck deployments are already showing 20–30% dwell-time savings that raise asset utilization for operators with real-time data connectivity. Private-equity backed ISO-tank leasing pools domiciled in Singapore are expanding specialized equipment availability and helping integrated providers bundle transport, tank rental, and TradeNet filing into single-source offerings. Low-carbon ammonia bunkering trials, together with the TradeNet e-DG permit revamp, illustrate how government-led digitalization and decarbonization initiatives are continually raising the baseline for operational efficiency.
Key Report Takeaways
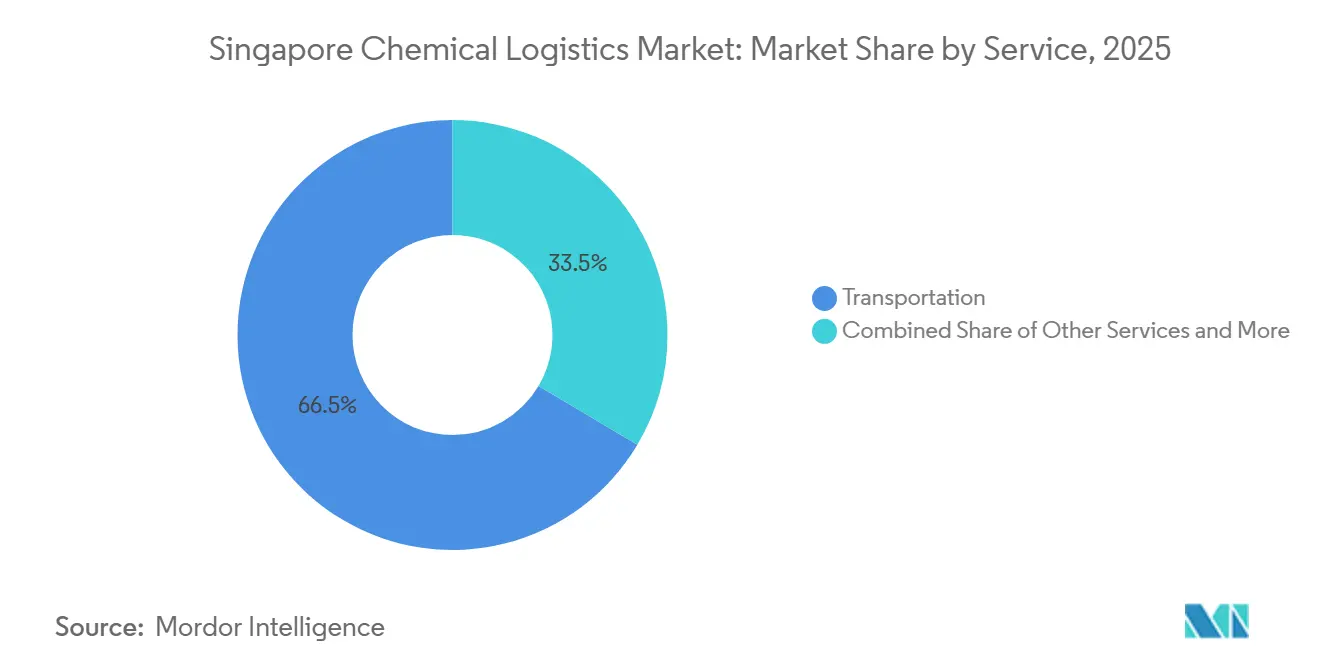
- By service type, transportation services led with a 66.47% share of the Singapore chemical logistics market size in 2025, whereas other services are projected to expand at a 6.11% CAGR through 2031.
- By end-user industry, oil and gas commanded 27.08% of the Singapore chemical logistics market share in 2025, while pharmaceutical logistics is advancing at a 5.28% CAGR to 2031.
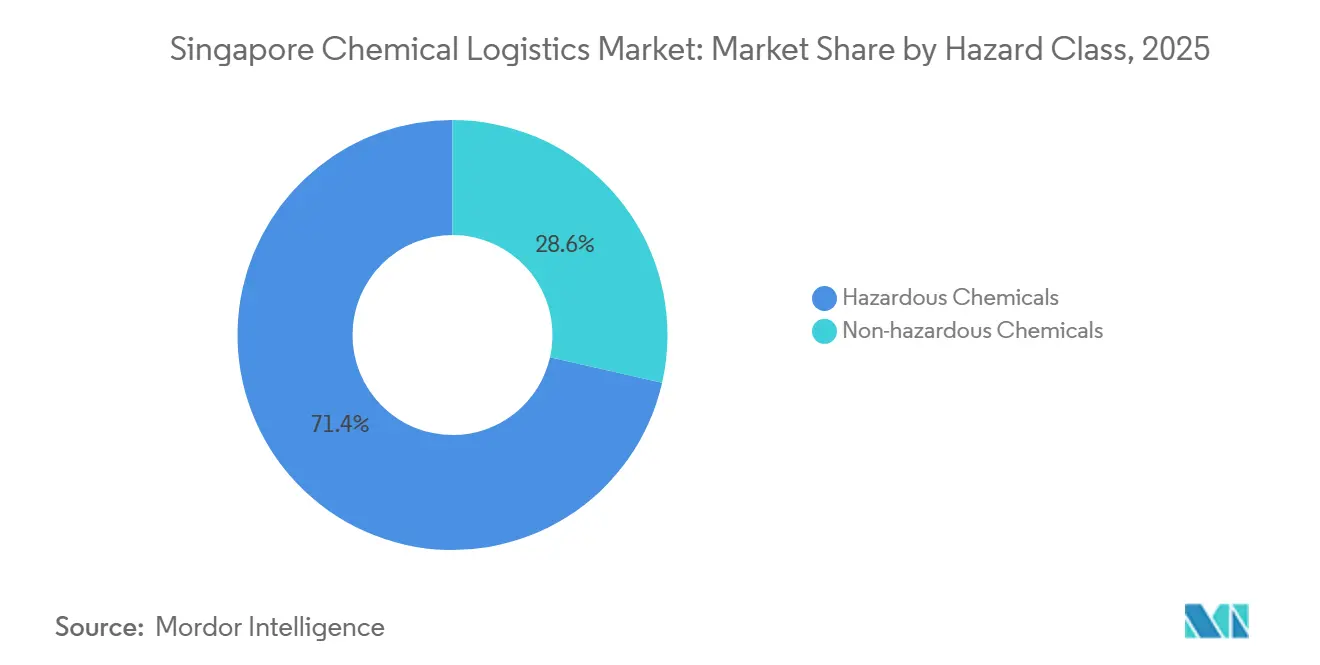
- By hazard class, hazardous chemicals accounted for 71.44% of the Singapore chemical logistics market size in 2025 and are set to grow at a 4.49% CAGR over 2026-2031.
- By temperature control, non-temperature-controlled logistics represented 65.3% of 2025 throughput, yet is forecast to expand at a 6.23% CAGR to 2031.
Note: Market size and forecast figures in this report are generated using Mordor Intelligence’s proprietary estimation framework, updated with the latest available data and insights as of 2026.
Singapore Chemical Logistics Market Trends and Insights
Drivers Impact Analysis*
| Driver | (~) % Impact on CAGR Forecast | Geographic Relevance | Impact Timeline |
|---|---|---|---|
| Surge in SG's specialty-chemical re-exports to Africa and South Asia | +0.9% | Singapore as regional hub, Africa and South Asia destinations | Medium term (2-4 years) |
| Autonomous yard-truck pilots at Tuas Port accelerating turnaround times | +0.7% | Singapore, port-adjacent logistics zones | Short term (≤ 2 years) |
| Mandatory SS 667:2020 certification driving compliant storage demand | +0.6% | Singapore, affecting all DG warehouse operators | Medium term (2-4 years) |
| PE-backed growth of ISO-tank leasing pools domiciled in Singapore | +0.5% | Singapore as domicile, Asia-Pacific utilization | Long term (≥ 4 years) |
| Low-carbon ammonia bunkering trials creating new logistics flows | +0.4% | Singapore as bunkering hub, global shipping routes | Long term (≥ 4 years) |
| TradeNet e-DG permit revamp reducing customs clearance times | +0.3% | Singapore, cross-border trade facilitation | Short term (≤ 2 years) |
| Source: Mordor Intelligence | |||
Surge in Singapore’s Specialty-Chemical Re-Exports to Africa and South Asia
Enterprise Singapore recorded SGD 91.5 billion (USD 68.6 billion) of chemical exports in 2024, and specialty segments such as surfactants and catalysts posted double-digit growth toward emerging markets. Importers rely on Singapore for smaller lot repackaging, local-language SDS preparation, and authenticity assurance, allowing logistics providers to charge 2-3 times standard transshipment rates. Partnerships with African distributors add inventory management and supply-chain financing services, while South Asian pharmaceutical buyers adopt Singapore‐based sourcing to diversify away from single-country dependencies. The dynamic is expected to widen the revenue share of value-added activities, reinforcing Singapore’s function as a risk-buffering gateway for specialty chemicals[1]“Fire Safety Act and Regulations,” Singapore Civil Defence Force, scdf.gov.sg .
Autonomous Yard-Truck Pilots at Tuas Port Accelerating Turnaround Times
PSA Singapore has deployed more than 200 autonomous electric yard trucks capable of 24/7 operation with centimeter-level precision, cutting chemical container dwell time by up to 30%. Automation removes driver fatigue limitations and reduces human exposure to hazardous cargo, enhancing both safety and productivity. Event-driven port software feeds routing updates to each vehicle, synchronizing yard moves with vessel schedules and warehouse slot availability. Integrated 3PLs that plug their transport-management systems directly into PSA’s data layer gain real-time milestones, pushing on-time performance above 98%[2]“Tax Treaties,” Inland Revenue Authority of Singapore, iras.gov.sg .
Mandatory SS 667:2020 Certification Driving Compliant Storage Demand
The SS 667:2020 Code of Practice obliges warehouses handling flammable liquids and oxidizers to install automated fire suppression, explosion-proof electricals, and segregated cells, with retrofits costing SGD 500-1,500 (USD 375-1,125) per m². Rental premiums of 40-60% for certified space are already visible, and insurers grant rate discounts to compliant operators. Smaller landlords unable to fund upgrades are exiting or divesting, accelerating market consolidation and tightening prime‐grade capacity.
PE-Backed Growth of ISO-Tank Leasing Pools Domiciled in Singapore
Singapore’s double-tax treaties and transparent legal structure underpin private-equity investment in ISO-tank fleets, where a single stainless-steel tank can cost USD 25,000-50,000. Utilization rates stay above 85% as chemicals producers convert from drums to tanks for purity and handling benefits. Lessors are bundling depot, cleaning, and regulatory support into subscription models, letting shippers pay per trip instead of owning assets. Integrated 3PLs with captive tank pools thereby secure both capacity priority and margin lift.
Restraints Impact Analysis*
| Restraint | (~) % Impact on CAGR Forecast | Geographic Relevance | Impact Timeline |
|---|---|---|---|
| Rising insurance premiums for DG warehousing post-global incidents | -0.7% | Singapore, global underwriting market influence | Short term (≤ 2 years) |
| EU CBAM compliance burden inflating export documentation cycles | -0.5% | Singapore exporters to EU markets | Medium term (2-4 years) |
| Limited domestic rail connectivity hindering multimodal cost savings | -0.4% | Singapore, competitive disadvantage vs regional hubs | Long term (≥ 4 years) |
| Volatile bunker fuel surcharges eroding 3PL margin stability | -0.3% | Singapore, global maritime fuel market exposure | Short term (≤ 2 years) |
| Source: Mordor Intelligence | |||
Rising Insurance Premiums for DG Warehousing Post-Global Incidents
After the Beirut and Tianjin explosions, underwriters raised premiums 30–50% for facilities without advanced detection and suppression, compelling operators to adopt real-time monitoring and third-party safety audits to maintain cover. Capital-rich firms comply; smaller players often exit, tightening supply and supporting higher rents for certified space[3]“Carbon Border Adjustment Mechanism,” European Commission, europa.eu .
EU CBAM Compliance Burden Inflating Export Documentation Cycles
CBAM’s 2026 phase-in forces exporters to document cradle-to-border carbon footprints for covered chemicals, extending order cycles by up to four weeks. Logistics firms are building carbon accounting modules and verification workflows, yet the extra steps raise cost-to-serve and squeeze margins on EU-bound traffic[4]“Land Transport Authority Singapore,” Land Transport Authority, lta.gov.sg.
*Our forecasts treat driver/restraint impacts as directional, not additive. The impact forecasts reflect baseline growth, mix effects, and variable interactions.
Segment Analysis
By Service: Regulatory-Driven Value-Added Services Outpacing Core Transport
Transportation maintained 66.47% share of the Singapore chemical logistics market in 2025, yet other services are growing faster at 6.11% CAGR as exporters grapple with CBAM filings, dangerous-goods packaging, and customs brokerage. The Singapore chemical logistics market size for value-added services benefits from advisory fees of USD 5,000–25,000 per exporter on carbon reporting mandates. Meanwhile, autonomous yard-truck rollouts improve truck cycle times but cannot fully offset fuel-surcharge volatility. Warehousing revenue is buoyed by SS 667:2020 premiums that lift rents 40-60% above standard industrial space and enhance the overall Singapore chemical logistics market share captured by operators offering certified storage.
Demand for bundled solutions lets integrated 3PLs pair ISO-tank leasing with TradeNet automation, creating stickier contracts and pricing power. Niche consultants thrive on dangerous-goods documentation and packaging for small-lot re-exports to Africa. Those without digital permit integration risk disintermediation as shippers embrace providers capable of same-day clearance.


By End-User: Pharmaceutical Cold Chain Leads Growth Trajectory
Oil and Gas controls 27.08% Singapore chemical logistics market share owing to Jurong Island’s refinery complex, yet pharmaceutical logistics expands at 5.28% CAGR on biologics flows to power-unstable ASEAN neighbors. GDP-compliant facilities with backup power and validated cold rooms command 2–3-times standard handling rates, boosting the Singapore chemical logistics market size attributable to healthcare shipments. Cosmetics and specialty electronic chemicals also gain from Singapore’s role as a regional consolidation hub for semiconductor fabs and beauty brands.
Stringent Health Sciences Authority oversight ensures only licensed GDP providers compete, limiting supply and supporting margins. Conversely, energy-transition measures compress crude trading volumes, forcing Oil & Gas logistics to pursue ISO-tank optimization and automation to preserve profitability.
By Hazard Class: Dangerous-Goods Dominance Underpinned by Compliance Complexity
Hazardous cargo represented 71.44% of 2025 throughput and expands at 4.49% CAGR, reflecting Singapore’s niche in flammable liquids, oxidizers, and corrosives subject to multi-agency permits. The Singapore chemical logistics market size for dangerous goods is reinforced by SS 667:2020 requirements that lift barriers to entry. Non-hazardous chemicals, while simpler to handle, face commoditized pricing and do not materially shift the Singapore chemical logistics market share.
Rental premiums and insurance incentives reward operators with automated fire systems and NEA transport routing software. Older facilities encounter surcharges or policy cancellations, prompting consolidation or exit.
By Temperature Control: Ambient Majority with Cold-Chain Acceleration
Non-temperature-controlled logistics held 65.3% market share, while temperature-controlled logistics were expected to grow at a 6.23% CAGR, powered by biologics, food-grade additives, and specialty chemicals that require 2-8 °C or -20 °C integrity. Purpose-built cold rooms cost USD 150-250 per ft², triple conventional warehouse builds, yet customers accept higher rates to avoid loss risks. The Singapore chemical logistics market size in cold chain benefits from the migration of pharma cargo from air to sea reefer containers for decarbonization purposes. Non-temperature cargo remains the bulk by tonnage but sees slower value growth and tighter margins.
IoT sensors and robotic shuttle systems cut energy spend and provide 24/7 temperature logs, strengthening audit readiness for pharmaceutical regulators and reinforcing customer loyalty.
Geography Analysis
Singapore’s western logistics corridor unites Jurong Island’s 3,000-hectare petrochemical cluster with the fully automated Tuas Port, enabling pipe-to-port transfers that reduce road tanker moves by 15-20%. The port handled 37 million TEU in 2025, with chemical cargo accounting for roughly 8-10% yet capturing higher fee yields due to dangerous-goods handling surcharges. Autonomous yard trucks, AGV cranes, and AI berth planning have cut vessel turnaround times, solidifying Singapore’s appeal for high-value chemical transshipment.
Beyond physical assets, Singapore leverages 28 free-trade agreements to cover markets representing more than 85% of global GDP, giving distributors tariff-efficient access to Asia-Pacific, Middle Eastern, and African buyers. The 2025 Johor-Singapore Special Economic Zone extends the functional hinterland into Malaysia, coupling Singapore’s regulatory reliability with Johor’s lower land costs and expanding warehouse footprints by 20%.
Digitalization further differentiates the locale. The TradeNet e-DG permit overhaul links customs, port, and logistics operator systems into one API-enabled platform, delivering same-day permit approvals that were impossible in competing hubs. Shippers moving time-sensitive chemicals now route via Singapore to exploit the predictability, reinforcing the nation’s role as a consolidated gateway despite its higher cost base.
Competitive Landscape
The Singapore chemical logistics market hosts a mix of global integrators such as DHL Supply Chain, Kuehne + Nagel, and DSV, regional players like Toll Group and Yusen Logistics, and local specialists including CWT and Poh Tiong Choon. Vertical integration is the key strategic thrust: leaders combine ISO-tank fleets, SS 667:2020 certified warehouses, and CBAM compliance software into holistic contracts. PSA International’s automated yard interfaces give early-access partners a measurable throughput edge, driving smaller forwarders to join digital marketplace platforms for capacity pooling.
Capital intensity is rising. Fire-suppression retrofits, cold-room builds, and IoT platforms demand heavy outlays, encouraging private-equity injections and mergers. Insurer pressure on risk governance accelerates exits of under-capitalized firms. Technology capability acts as a moat; those running autonomous truck interfaces and EDI links to TradeNet capture sticky volumes and can negotiate take-or-pay deals with shippers.
White space remains in low-carbon ammonia bunkering logistics, CBAM advisory services, and pharmaceutical serialization support. First movers establishing ammonia storage and safety protocols will lock in multi-year contracts with vessel operators and fuel suppliers. Consulting arms that master EU carbon paperwork are already enjoying premium bill rates.
Singapore Chemical Logistics Industry Leaders
DHL Group
Kuehne+Nagel
Toll Group
NYK Line
PSA Corporation
- *Disclaimer: Major Players sorted in no particular order

Recent Industry Developments
- January 2026: CWT Limited and S.F. Express (Singapore) inked a two-year MoU to build an integrated general and cold-chain ecosystem covering warehousing, container transport, maintenance, and freight forwarding.
- October 2025: Kuehne+Nagel began expanding its Southeast Asia road fleet to support temperature-sensitive and high-value consignments across the region.
- October 2025: Yusen Logistics partnered with Ocean Network Express to adopt the ONE LEAF+ green-shipping service.
- August 2025: Yusen Logistics partnered with AllChiefs to launch a carbon-insetting and alternative-fuel program aligned with EU CBAM reduction targets.


Singapore Chemical Logistics Market Report Scope
| Transportation | Road |
| Rail | |
| Air | |
| Sea | |
| Warehousing, Distribution and Inventory Management | |
| Other Services |
| Pharmaceutical |
| Cosmetic |
| Oil and Gas |
| Specialty Chemicals |
| Other End-Users |
| Hazardous Chemicals |
| Non-hazardous Chemicals |
| Temperature-Controlled (Refrigerated/Heated) |
| Non-Temperature-Controlled |
| By Service | Transportation | Road |
| Rail | ||
| Air | ||
| Sea | ||
| Warehousing, Distribution and Inventory Management | ||
| Other Services | ||
| By End-User Industry | Pharmaceutical | |
| Cosmetic | ||
| Oil and Gas | ||
| Specialty Chemicals | ||
| Other End-Users | ||
| By Hazard Class | Hazardous Chemicals | |
| Non-hazardous Chemicals | ||
| By Temperature Control | Temperature-Controlled (Refrigerated/Heated) | |
| Non-Temperature-Controlled |


Key Questions Answered in the Report
What is the 2026 value of the Singapore chemical logistics market?
The Singapore chemical logistics market is estimated at USD 4.07 billion in 2026.
Which service category is growing fastest?
Other Services, including regulatory consulting and customs brokerage, are advancing at a 6.11% CAGR through 2031.
How large is the hazardous-chemicals segment?
Hazardous cargo represented 71.44% of 2025 volumes and will expand at 4.49% CAGR between 2026 and 2031.
Why is pharmaceutical cold-chain demand rising?
Biologics bound for Southeast Asia require GDP-compliant temperature control, driving the pharma segment to a 5.28% CAGR.
How do SS 667:2020 rules affect warehouse rents?
Certified dangerous-goods space commands 40-60% rental premiums over conventional industrial facilities.
What impact do autonomous yard trucks have on operations?
Automation at Tuas Port is shortening container dwell times by up to 30%, improving schedule reliability for chemical shippers.
Page last updated on:


