Ship Port Infrastructure Market Size and Share
Market Overview
| Study Period | 2020 - 2031 |
|---|---|
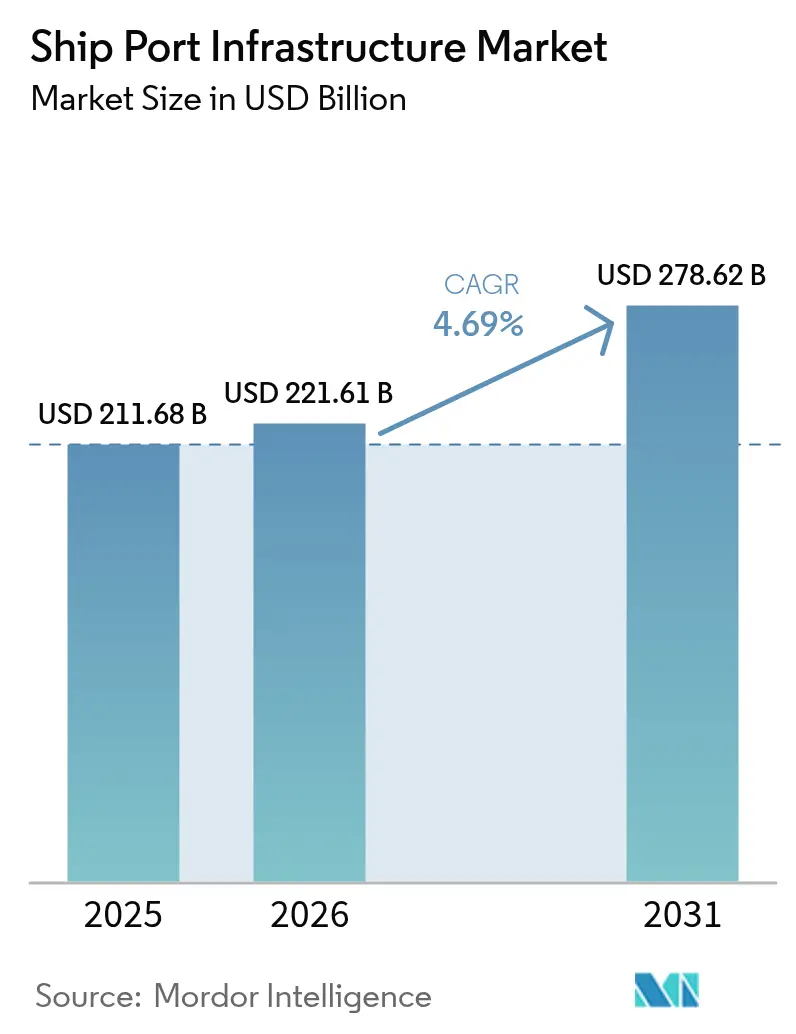
| Market Size (2026) | USD 221.61 Billion |
| Market Size (2031) | USD 278.62 Billion |
| Growth Rate (2026 - 2031) | 4.69% CAGR |
| Fastest Growing Market | Asia Pacific |
| Largest Market | Asia Pacific |
| Market Concentration | Medium |
Major Players *Disclaimer: Major Players sorted in no particular order Image © Mordor Intelligence. Reuse requires attribution under CC BY 4.0. | |
Ship Port Infrastructure Market Analysis by Mordor Intelligence
Ship Port Infrastructure Market size in 2026 is estimated at USD 221.61 billion, growing from 2025 value of USD 211.68 billion with 2031 projections showing USD 278.62 billion, growing at 4.69% CAGR over 2026-2031. This growth reflects a decisive global shift toward automation, climate-resilient engineering, and alternative-fuel readiness, reshaping competitive advantages in the ship port infrastructure market. Public-sector stimulus programs are unlocking large modernization pipelines, private 5G roll-outs tightening equipment synchronization, and mandatory decarbonization timelines force ports to electrify cargo-handling fleets and upgrade on-shore power systems. Near-shoring is also re-routing container volumes toward secondary coastal and inland nodes, broadening the geographic footprint of the ship port infrastructure market while intensifying the race for capital-efficient expansion.
Key Report Takeaways
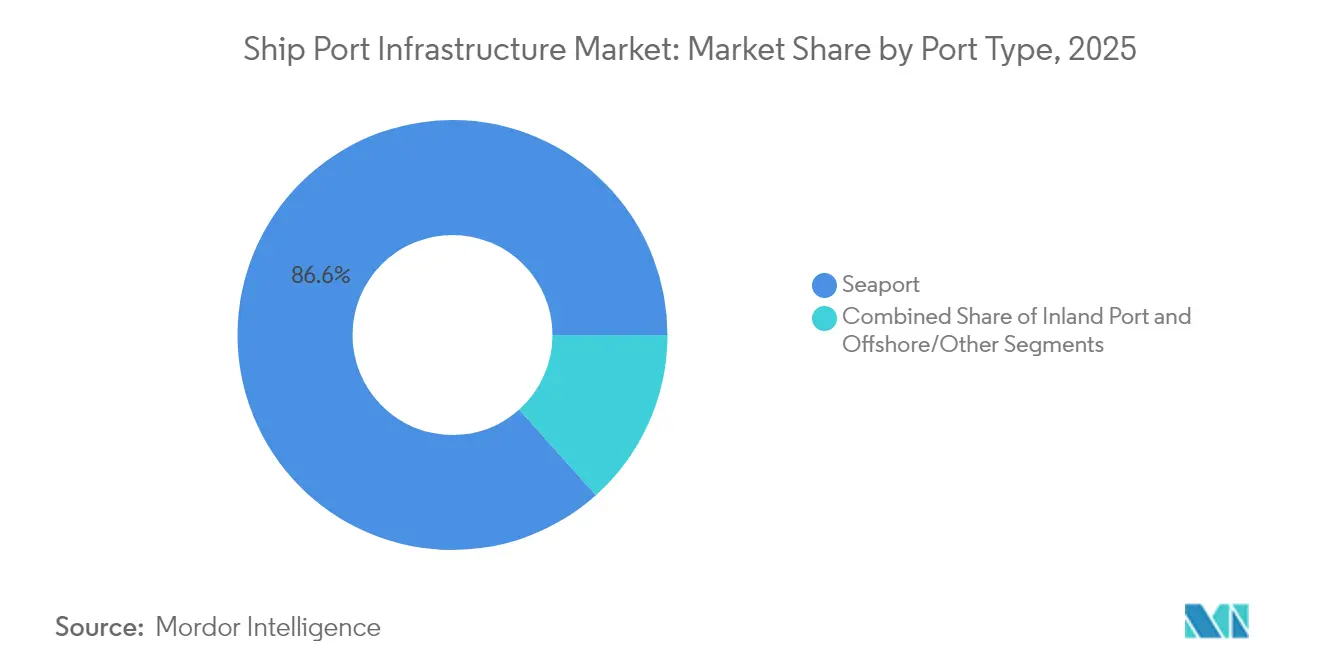
- By port type, seaports led with 86.62% of the ship port infrastructure market share in 2025, while inland ports are forecast to grow at a 4.82% CAGR through 2031.
- By application, cargo operations accounted for 90.55% share of the ship port infrastructure market size in 2025; the passenger segment is expected to post a 4.81% CAGR to 2031.
- By ownership model, public entities held 51.68% of the ship port infrastructure market size in 2025, whereas private operators are projected to expand at a 4.74% CAGR through 2031.
- By technology adoption level, conventional terminals commanded 65.35% of the ship port infrastructure market size in 2025, while fully automated facilities are scaling at a 4.71% CAGR to 2031.
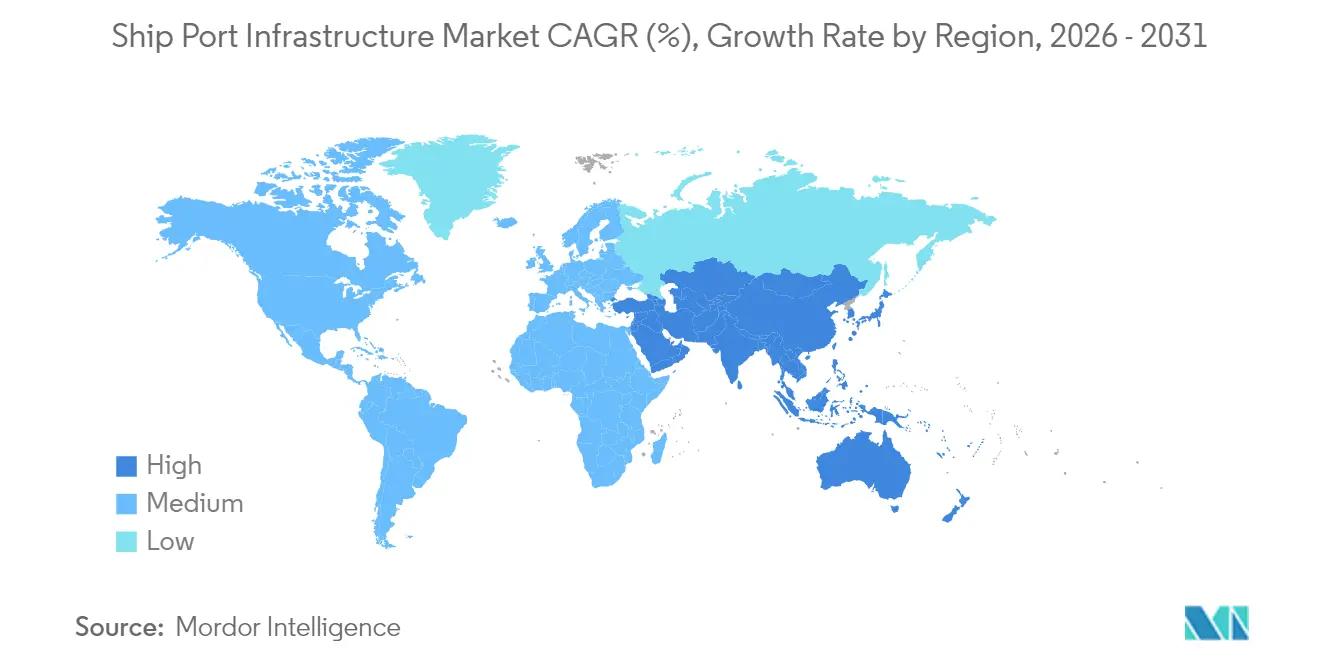
- By geography, Asia Pacific captured 38.42% of the ship port infrastructure market share in 2025 and is set to grow at a 4.72% CAGR through 2031.
Note: Market size and forecast figures in this report are generated using Mordor Intelligence’s proprietary estimation framework, updated with the latest available data and insights as of 2026.
Global Ship Port Infrastructure Market Trends and Insights
Drivers Impact Analysis*
| Driver | (~) % Impact on CAGR Forecast | Geographic Relevance | Impact Timeline |
|---|---|---|---|
| Expansionary Public-Sector Port Modernization Budgets | +1.2% | Global, with concentration in North America and EU | Medium term (2-4 years) |
| Rapid Container-Terminal Automation | +1.1% | Asia-Pacific core, expanding to EU and North America | Long term (≥ 4 years) |
| Mandatory IMO/ICS Decarbonization Timelines | +0.9% | Global | Long term (≥ 4 years) |
| Near-Shoring Shifting Cargo Flows to Secondary Seaports | +0.8% | North America and Latin America, spill-over to Asia-Pacific | Medium term (2-4 years) |
| Resilience Investments Against Climate-Linked Chokepoint | +0.6% | Coastal regions globally, priority in North America and EU | Long term (≥ 4 years) |
| Rapid Build-Out of Specialized Bulk Terminals | +0.4% | Global, with emphasis on commodity-exporting regions | Medium term (2-4 years) |
| Source: Mordor Intelligence | |||
Expansionary Public-Sector Port Modernization Budgets
Government spending is reshaping capacity and technology priorities across the ship port infrastructure market. The United States allocated USD 580 million to 31 projects in 2024, while California ring-fenced USD 2.3 billion for port improvements that bundle berth expansion with digital yard-management platforms.[1]“Port Modernization Funding Overview,” California Department of Transportation, dot.ca.gov Similar momentum is visible in the European Union’s Connecting Europe Facility, which co-finances shore-power deployment and intermodal upgrades. Blended-finance structures enable quicker execution, as shown by DP World’s USD 1.2 billion London Gateway phase-II build that combines public guarantees with private equity.[2]“London Gateway Phase II Investment,” DP World, dpworld.comPorts securing multi-source funding can synchronise civil works expansion with automation roll-outs, compressing payback periods by lifting throughput per hectare. Yet capacity gains hinge on hinterland connectivity; berth productivity fails to translate into end-to-end velocity without rail-and-road alignment.
Rapid Container-Terminal Automation & Private-5G Roll-Outs
Automation is accelerating as terminals confront labour shortages and volatility in collective bargaining. Singapore’s Tuas Port operates more than 200 driverless vehicles under a private 5G network that supports millisecond equipment hand-offs, cutting unproductive moves by 20%. China leads with 52 automated berths online and 27 under construction, validating systems' economies of scale. Early adopters nevertheless gain a structural cost edge when industrial action halts manual peers, making automation the decisive differentiator for volume-sensitive carriers.
Mandatory IMO Decarbonisation Timelines Accelerating Green-Retrofit Capex
The IMO target of net-zero greenhouse-gas emissions by 2050 compels ports to electrify cargo gear, install shore power, and prepare for low-carbon bunkering. Rotterdam will build ammonia storage and hydrogen pipelines by electrifying 100% of straddle carriers by 2030. Studies by the Zero Emission Port Alliance show that 94% of new handling equipment purchases will be battery-electric by 2035. The financial burden includes grid upgrades, with many ports needing to triple their electrical import capacity. Operators moving first can levy green-premium tariffs as shipping lines integrate emissions ratings into port-call decisions.
Near-Shoring Shifts Cargo Flows to Secondary Seaports
Manufacturers moving closer to consumption zones diversify containers from mega-hubs to emerging gateways, enlarging the investable universe within the shipping port infrastructure market. Mexico’s Manzanillo is tripling annual capacity to 10 million TEU via a USD 3 billion master plan that capitalises on North American regionalisation.[3]“Master Plan Update 2025,” Administración del Sistema Portuario Nacional Manzanillo, asiponamanzanillo.gob.mx In the United States, the Port of Nevada provides an inland railhead that bypasses West Coast road congestion and trims door-to-door transit by two days. Secondary ports can monetise shorter vessel queues and dedicated acreage; however, they must match the data visibility standards of tier-1 terminals to keep high-value shippers. The competitive field, therefore, rewards facilities that pair acreage expansion with optical-character-recognition gates, automated stacking cranes, and cloud-based scheduling.
Restraints Impact Analysis*
| Restraint | (~) % Impact on CAGR Forecast | Geographic Relevance | Impact Timeline |
|---|---|---|---|
| Multi-Billion-Dollar Upfront Capital Requirement | -0.9% | Global | Long term (≥ 4 years) |
| Labour-Union Resistance to Full Automation | -0.7% | North America and EU | Medium term (2-4 years) |
| Growing Cyber-Security Vulnerabilities | -0.4% | Global, priority in developed markets | Short term (≤ 2 years) |
| Escalating Annual Dredging Costs | -0.3% | Global, emphasis on coastal regions | Medium term (2-4 years) |
| Source: Mordor Intelligence | |||
Multi-Billion-Dollar Upfront Capital Requirement & Long Pay-Back
Full automation and berth deepening stretch balance sheets across the ship port infrastructure market. Projects exceed, and lenders demand covenants tied to throughput guarantees, creating hurdles for midsize operators. Technology obsolescence risk further complicates underwriting; equipment cycles shrink as software-defined cranes replace mechanical upgrades every five years. Consequently, smaller concessions may pivot to phased semi-automation as an interim hedge.
Labour-Union Resistance to Full Automation at Legacy Hubs
Organised labour at West Coast US terminals halted operations in October 2024, revealing the strike leverage that unions retain even as automation proliferates. Contract renegotiations in January 2025 opened the door to hybrid skill paths—such as remote crane operators—that moderate job displacement. Nevertheless, ports bound by outdated labour clauses risk service unreliability and diversion of discretionary cargo to Asian competitors.
*Our forecasts treat driver/restraint impacts as directional, not additive. The impact forecasts reflect baseline growth, mix effects, and variable interactions.
Segment Analysis
By Port Type: Seaports Maintain Primacy While Inland Nodes Accelerate
Seaports continue to dominate the ship port infrastructure market size, accounting for an 86.62% share in 2025, as only coastal facilities can berth ultra-large vessels. This dominance anchors the ship port infrastructure market size at the high end of the capital allocation spectrum, driving dredging, breakwater reinforcement, and automation outlays that dwarf those of inland and offshore installations. Volume visibility attracts third-party logistics providers and fintech platforms, creating network effects that reinforce seaport hegemony.
Seaport investments center on tandem-lift quay cranes, AI-enabled stack management, and on-dock rail integration, which can reduce truck idling by 30%. Inland ports, which will grow at a CAGR of 4.82% by 2031, leverage rail economics; the Port of Nevada’s 224-acre site processes remote customs clearance and rail transloading, which remove 600 daily truck trips from congested interstate corridors. Growth potential is spurred by e-commerce fulfillment centers migrating inland, signaling that the ship port infrastructure market will witness a nuanced balance between coastal scalability and interior agility.


By Application: Cargo Operations Anchor Revenues While Passenger Demand Recovers
Cargo handling represented 90.55% of the total ship port infrastructure market share in 2025, anchoring the market. Terminal operators funnel capital toward automated stacking cranes, optical gate systems, and blockchain-linked documentation that eliminate manual reconciliation delays. Container dwell time has become the principal metric through which investors benchmark asset productivity.
Passenger activities grow at a CAGR of 4.81% through 2031, cruise and ferry terminals are rebounding as vaccination passports and pent-up travel demand lift bookings. Ports in the Mediterranean and Caribbean are refurbishing embarkation lounges and installing LNG bunkering to serve new dual-fuel cruise ships. Higher spend per docked passenger offsets seasonal volatility, diversifies income streams, and raises asset valuations within the broader ship port infrastructure industry.
By Ownership Model: Public Dominance Persists Amid Private Efficiency Gains
Public authorities retained 51.68% control of the ship port infrastructure market size in 2025, safeguarding national-interest assets and trade security considerations. Nevertheless, fiscal constraints and competing social budgets encourage concessioning to global operators like PSA International, which recently secured a 30-year build-operate-transfer deal in Jakarta. Private entities accelerate project timelines by compressing procurement cycles and aligning incentives to throughput, while growing at a CAGR of 4.74%.
Hybrid public-private partnerships unlock multilateral finance, enabling emerging-market ports to attain international standards. Performance-based tariff structures encourage throughput guarantees and clarify lender repayment profiles, thereby expanding the investible tranche of the ship port infrastructure market.

By Technology Adoption Level: Conventional Operations Give Way to End-to-End Automation
Conventional processes accounted for 65.35% of the ship port infrastructure market size in 2025, illustrating the inertia of legacy asset bases. Yet fully automated yards are scaling rapidly, with 4.71% CAGR, as proof-of-concept projects like Rotterdam’s Maasvlakte II achieve 30-move-per-hour crane productivity without human drivers.
Investment returns hinge on integrated operating systems; siloed automation often under-delivers when different vendors program quay, yard, and gate modules. The transition path typically begins with automated stacking cranes and graduates to automated guided vehicles. It culminates in real-time digital twins orchestrating entire terminals, redefining competitive moats within the ship port infrastructure market.
Geography Analysis
Asia Pacific led the ship port infrastructure market share with a 38.42% regional share in 2025 and remains the fastest-growing territory at a 4.72% CAGR. China’s 52 automated berths and a national strategy that treats terminals as smart-manufacturing nodes gave Shanghai the first 50 million TEU throughput record in history. South Korea’s Busan added an automated phase that lifted yard density by 20%, illustrating how technology leapfrogging corrects land constraints. Although geopolitical frictions pose downside risk, regional governments continue to pour capex into digital-rail corridors that funnel hinterland exports to coastal hubs.
Europe maintains efficiency leadership in sustainability. Rotterdam’s 6.8 benefit-to-cost ratio adaptation plan channels EUR 2 billion into flood-barriers, ammonia bunkering, and green hydrogen pipelines. Hamburg’s Altenwerder terminal operates climate-neutral equipment and has become a test-bed for electricity-as-a-service models that shift battery ownership to utilities, reducing operator capex. Regulatory frameworks such as FuelEU Maritime reward early movers by extending green-corridor incentives to shipping lines that call at low-carbon ports, enriching the strategic profile of the ship port infrastructure market.
North America lags on automation but benefits from near-shoring and federal grants. The USD 580 million Port Infrastructure Development Program funnels funds toward berth rehabilitation and electrified rubber-tyred gantry cranes at Los Angeles and Long Beach. Labour uncertainty remains the region’s Achilles heel; the 2024 strike pushed carriers to divert 9% of Transpacific volumes to Mexican and Canadian gateways.

Competitive Landscape
The ship port infrastructure market is moderately consolidated. BlackRock’s USD 22.8 billion joint purchase of Hutchison’s overseas assets underscores rising institutional appetite for the stable cash flows embedded in the ship port infrastructure market. Strategic differentiation increasingly rests on data integration and climate credentials rather than simple berth length.
Operators are funding automation to lock in cost competitiveness. DP World earmarked USD 250 million for a modernised on-dock rail extension at Sydney’s Port Botany and completed a similar USD 400 million automation suite in Callao, Peru. PSA’s Tuas mega-terminal in Singapore consolidates seven city-centre terminals into a 65 million TEU complex, leveraging cloud-native orchestration to arbitrage quay crane allocation. Technology startups such as NextPort are embedding digital twins that simulate yard congestion scenarios, giving midsize operators a tactical toolkit to stay relevant.
Climate-aligned services also distinguish market leaders. Rotterdam, Los Angeles, and Valencia are establishing green-corridor pacts with shipping lines, bundling shore power, alternative-fuel bunkering, and verifiable emissions reporting. Ports without clear decarbonisation blueprints risk relegation to secondary routing as cargo owners press for supply-chain Scope 3 visibility.
Ship Port Infrastructure Industry Leaders
Man Infraconstruction Ltd.
APM Terminals
Essar Ports Limited
Larsen & Toubro Limited
Adani Ports & SEZ
- *Disclaimer: Major Players sorted in no particular order

Recent Industry Developments
- May 2025: AD Ports Group signed an agreement with the Suez Canal Economic Zone to develop the KEZAD East Port Said Zone, expanding UAE strategic reach in a critical chokepoint.
- April 2025: APM Terminals acquired Panama Canal Railway Company, integrating rail and port operations to tighten cargo flow between Atlantic and Pacific coasts.
- March 2025: DP World commenced a USD 1.2 billion expansion of London Gateway that will lift United Kingdom container capacity by 50% and add 1,400 jobs.


Global Ship Port Infrastructure Market Report Scope
The ship port infrastructure is used to provide transport-related port services. The transport-related services consist of the transportation of the vessel, cargo, and passengers which pass through ports.
The ship Port Infrastructure market is segmented by type, application, and geography. Based on the type, the market is segmented into seaports, inland ports, and other types. Based on the application, the market is segmented into passenger and cargo. Based on geography, the market is segmented into North America, Europe, Asia-Pacific, and the Rest of the world.
For each segment, the market sizing and forecast have been done on the basis of value (USD).
| Seaport |
| Inland Port |
| Offshore/Other |
| Cargo |
| Passenger |
| Public |
| Private |
| Conventional |
| Semi-Automated |
| Fully-Automated |
| North America | United States |
| Canada | |
| Rest of North America | |
| South America | Brazil |
| Argentina | |
| Rest of South America | |
| Europe | Germany |
| United Kingdom | |
| France | |
| Italy | |
| Spain | |
| Netherlands | |
| Rest of Europe | |
| Asia-Pacific | China |
| Japan | |
| South Korea | |
| India | |
| Australia | |
| Rest of Asia Pacific | |
| Middle East and Africa | United Arab Emirates |
| Saudi Arabia | |
| South Africa | |
| Turkey | |
| Rest of Middle East and Africa |
| By Port Type | Seaport | |
| Inland Port | ||
| Offshore/Other | ||
| By Application | Cargo | |
| Passenger | ||
| By Ownership Model | Public | |
| Private | ||
| By Technology Adoption Level | Conventional | |
| Semi-Automated | ||
| Fully-Automated | ||
| By Geography | North America | United States |
| Canada | ||
| Rest of North America | ||
| South America | Brazil | |
| Argentina | ||
| Rest of South America | ||
| Europe | Germany | |
| United Kingdom | ||
| France | ||
| Italy | ||
| Spain | ||
| Netherlands | ||
| Rest of Europe | ||
| Asia-Pacific | China | |
| Japan | ||
| South Korea | ||
| India | ||
| Australia | ||
| Rest of Asia Pacific | ||
| Middle East and Africa | United Arab Emirates | |
| Saudi Arabia | ||
| South Africa | ||
| Turkey | ||
| Rest of Middle East and Africa | ||


Key Questions Answered in the Report
What is the current value of the ship port infrastructure market?
The ship port infrastructure market was valued at USD 221.61 billion in 2026 and is on track to hit USD 278.62 billion by 2031.
Which region leads the ship port infrastructure market?
Asia Pacific holds the top position with 38.42% share in 2025 and remains the fastest-growing territory at a 4.72% CAGR through 2031.
How significant is automation in shaping competitive advantages?
Fully automated terminals post 15-20% higher crane productivity and lower labor exposure, making automation a pivotal determinant of long-term cost leadership.
What role do public-private partnerships play in new port projects?
They bridge funding gaps by combining government guarantees with private capital, accelerating delivery while ensuring strategic oversight.
How are decarbonisation mandates influencing port investments?
IMO net-zero targets push ports to electrify equipment, install shore power, and develop alternative-fuel bunkering, often tripling grid capacity requirements.
Why are secondary ports gaining attention from shippers?
Near-shoring strategies and congestion avoidance divert volumes to smaller gateways that can offer dedicated acreage, faster turnaround, and integrated rail links.
Page last updated on:


