Self-Service Market Size and Share
Market Overview
| Study Period | 2020 - 2031 |
|---|---|
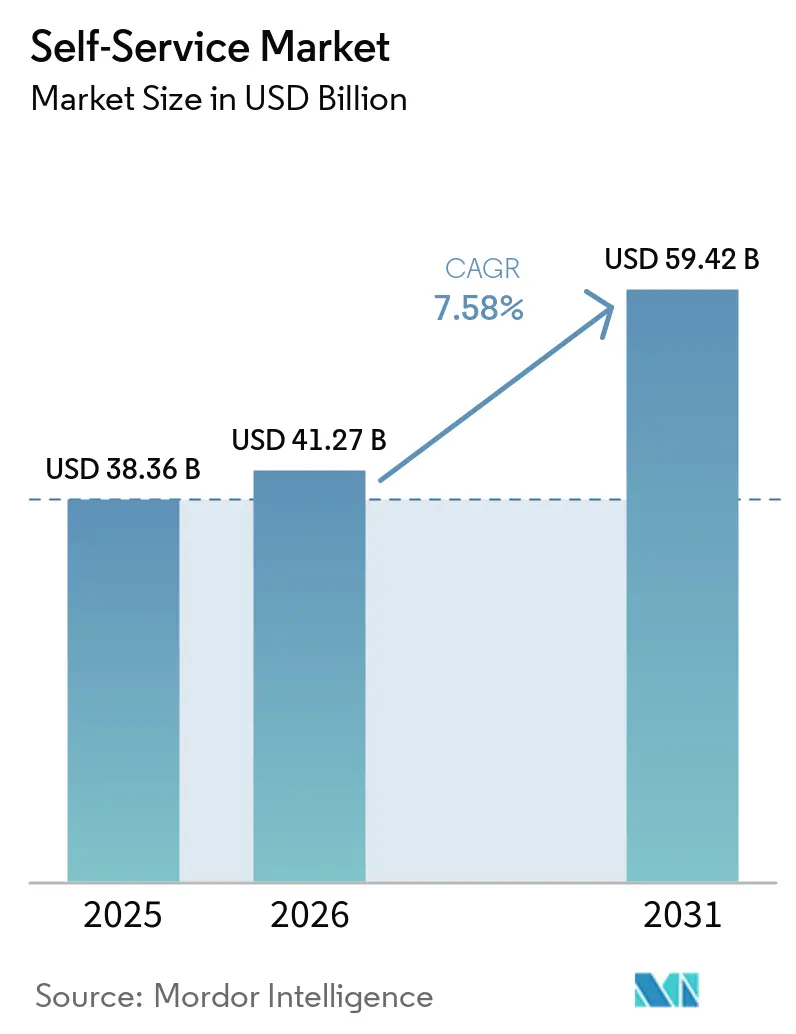
| Market Size (2026) | USD 41.27 Billion |
| Market Size (2031) | USD 59.42 Billion |
| Growth Rate (2026 - 2031) | 7.58% CAGR |
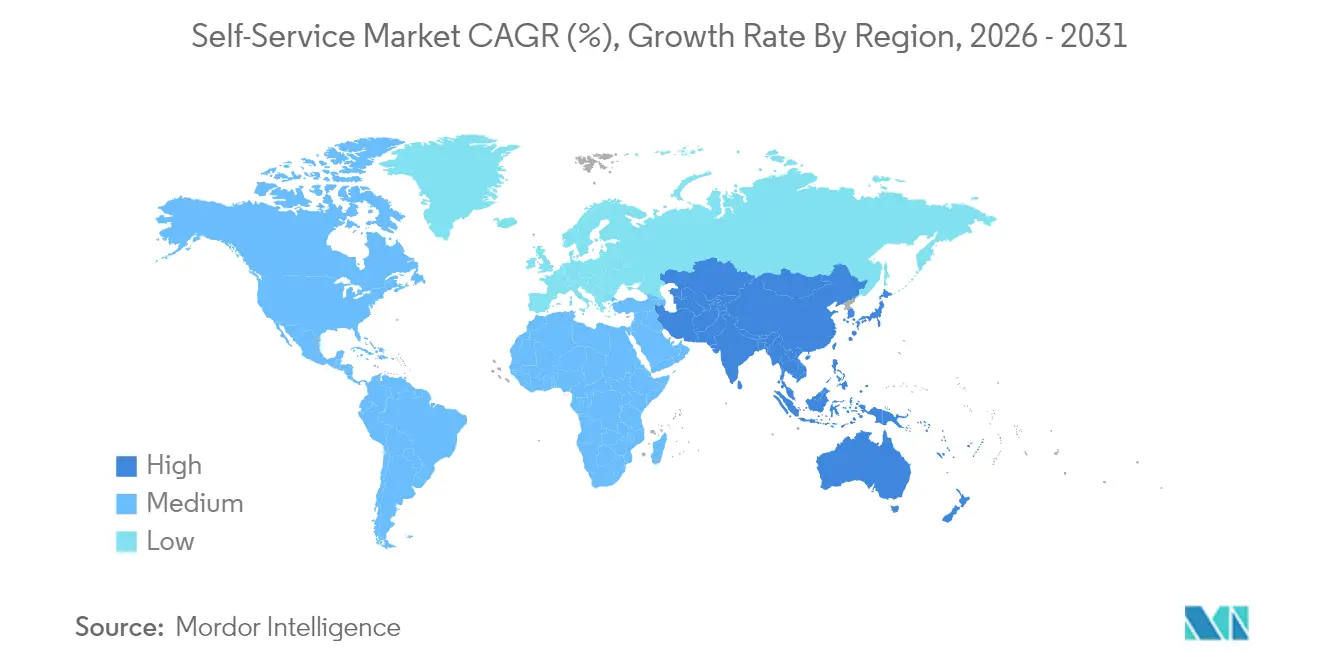
| Fastest Growing Market | Asia Pacific |
| Largest Market | North America |
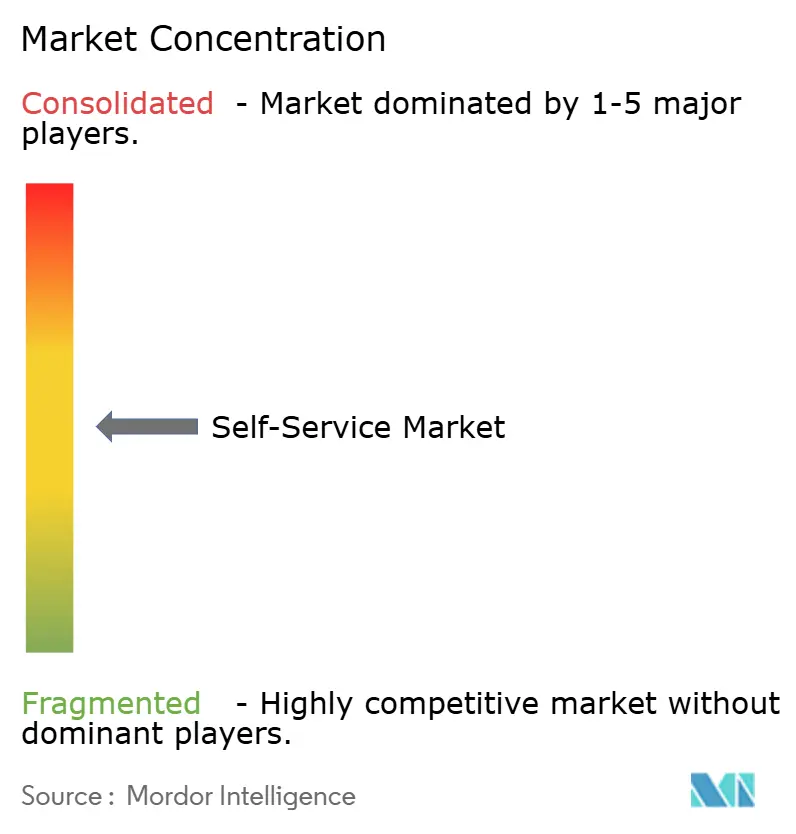
| Market Concentration | Medium |
Major Players *Disclaimer: Major Players sorted in no particular order Image © Mordor Intelligence. Reuse requires attribution under CC BY 4.0. | |
Self-Service Market Analysis by Mordor Intelligence
The Self-Service Market size is projected to expand from USD 38.36 billion in 2025 and USD 41.27 billion in 2026 to USD 59.42 billion by 2031, registering a CAGR of 7.58% between 2026 to 2031.
This growth links directly to the shift toward contactless engagement that gathered pace after the pandemic, tighter corporate mandates for digitization, and broad public familiarity with digital wallets. Hardware and software suppliers are responding by embedding AI, computer vision, and biometric modules that cut wait times, strengthen security, and open new use-cases across banking, retail, healthcare, and public venues. Payment ecosystems built on QR and NFC are now mainstream in many urban centers, and they underpin steady demand for self-service terminals able to accept any credential the user prefers. Vendors also highlight service contracts and platform fees, turning what was once a one-off hardware sale into a recurring revenue stream that smooths cash flow. However, resilience against vandalism, outdoor weather extremes, and e-commerce substitution remains a prerequisite for profitable roll-outs.
Key Report Takeaways
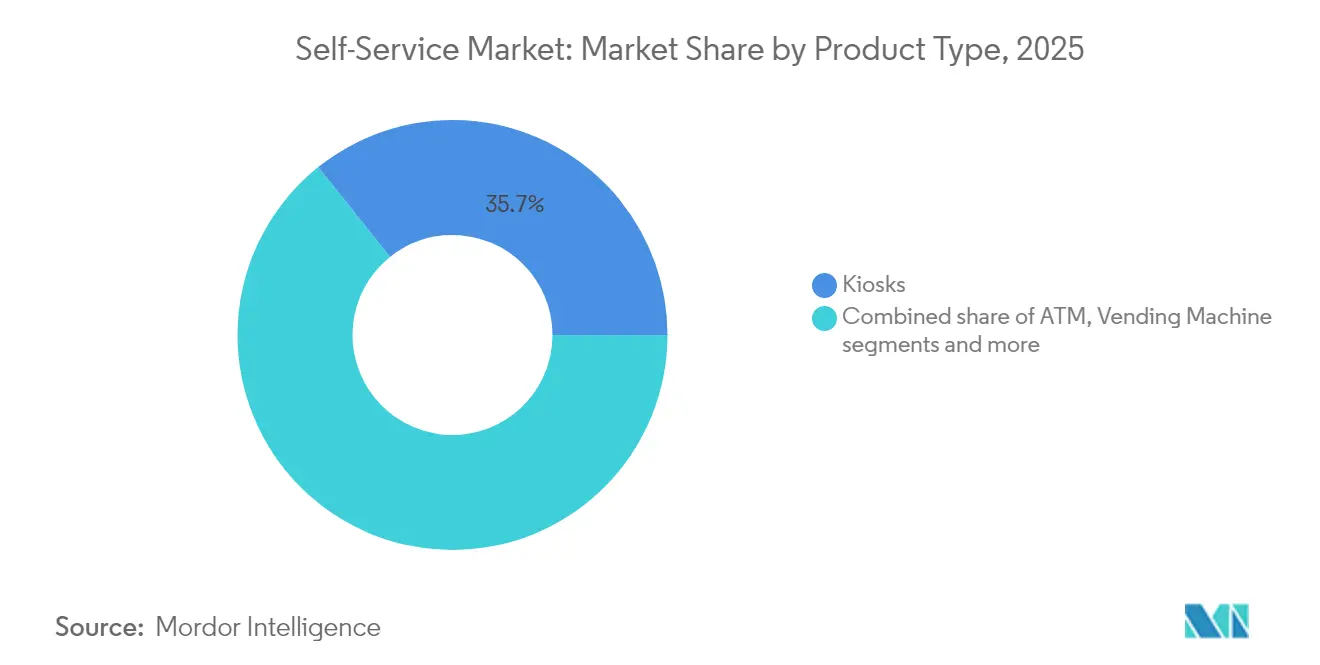
- By product type, kiosks led with 35.74% of self-service market share in 2025, while self-checkout systems are on track for the highest 8.01% CAGR through 2031.
- By component, hardware accounted for 53.52% of the self-service market in 2025, whereas software is projected to expand at a 8.66% CAGR up to 2031.
- By end-user industry, retail and quick-service restaurants captured 31.45% share of the self-service market in 2025, while healthcare represents the highest 7.85% CAGR through 2031.
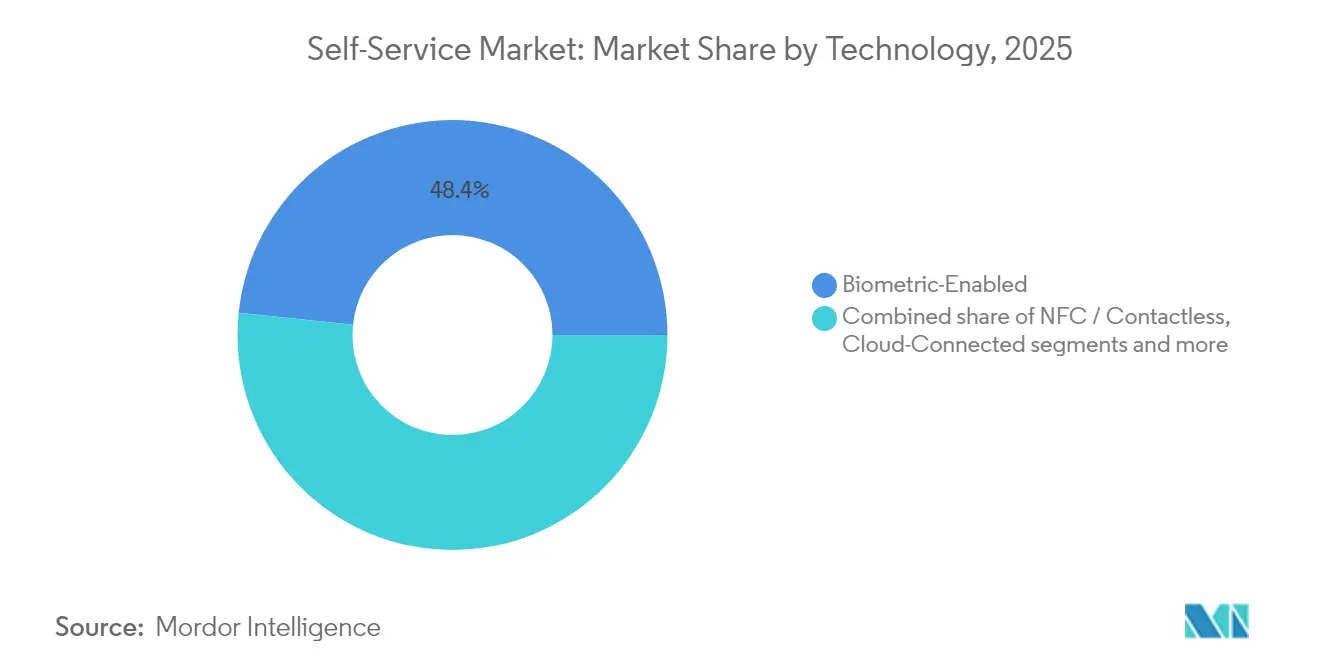
- By technology, biometric-enabled systems commanded 48.35% of self-service market share in 2025, and AI-driven solutions are advancing at an 8.28% CAGR to 2031.
- By deployment location, indoor installations held 66.02% self-service market share in 2025; outdoor units are expected to grow at a robust 8.74% CAGR toward 2031.
- By geography, North America dominated with 39.02% revenue share in 2025; Asia-Pacific is expected to post the fastest 8.17% CAGR to 2031.
Note: Market size and forecast figures in this report are generated using Mordor Intelligence’s proprietary estimation framework, updated with the latest available data and insights as of 2026.
Market Trends and Insights
Drivers Impact Analysis of Self-Service Market*
| Driver | (~) % Impact on CAGR Forecast | Geographic Relevance | Impact Timeline |
|---|---|---|---|
| Ubiquity of contact-free transactions post-COVID | +1.8% | Global; strongest in developed markets | Medium term (2-4 years) |
| Rapid rollout of smart retail formats | +1.5% | North America and Europe; expanding to APAC | Medium term (2-4 years) |
| Omni-channel banking automation wave | +1.2% | Global; led by developed banking markets | Long term (≥4 years) |
| Government push for cash-lite societies | +1.0% | APAC core; spill-over to Europe and emerging markets | Long term (≥4 years) |
| AI-powered adaptive user interfaces | +0.9% | North America and Europe; APAC adoption rising | Medium term (2-4 years) |
| Micro-fulfilment and 24/7 unmanned concepts | +0.7% | Urban centers worldwide; concentrated in developed markets | Short term (≤2 years) |
| Source: Mordor Intelligence | |||
Ubiquity of Contact-Free Transactions Post-COVID
Global digital payment participation jumped from 44% in 2014 to two-thirds of adults in 2022, confirming a permanent tilt toward cashless behaviors. European research shows sustained intentions to avoid cash because of hygiene concerns, and operators of micro-markets report higher revenues after installing cashless modules. Countries like Sweden, where cash use halved in the past decade, underscore how rapidly policy, merchants, and consumers converge on digital rails[1]International Monetary Fund, “Sweden’s Path to a Cash-Lite Economy,” imf.org. This preference extends to biometric taps and voice prompts, driving every corner of the self-service market to support no-touch authentication.
Rapid Rollout of Smart Retail Formats
Autonomous stores relying on RFID gates, computer vision, and smart shelving are projected to grow significantly. Germany counted more than 5,000 self-checkout outlets recently, and retailers plan further acceleration. In the United States, wholesale chains such as Sam’s Club deployed AI-enhanced devices that scan carts in seconds, shrinking queues and redeploying staff. Micro-fulfilment hubs, despite integration headaches, promise same-hour replenishment for densely populated districts, creating a pull for lockers and hybrid kiosks able to dispense and accept goods around the clock. Self-Service Kiosk deployments are increasing rapidly as businesses focus on contactless service, operational efficiency, and enhanced customer experience.
Omni-Channel Banking Automation Wave
Enhanced Self-Service ATMs enable banks to stretch branch footprints at a lower cost while keeping 24/7 coverage. NCR Atleos reports that 66.7% of its revenue came from recurring service streams tied to roughly 800,000 installed ATMs, illustrating predictable returns once devices are networked. Diebold Nixdorf, meanwhile, integrates more than 230,000 machines into its cloud kernel, which supports remote monitoring and software upsell. As crypto ATM counts rise and video banking gains acceptance, financial institutions use self-service market solutions to cut teller queues and offer flexible on-ramp services.
Government Push for Cash-Lite Societies
India’s Unified Payments Interface cleared over 100 billion transfers, validating public policy that steers citizens toward digital cash alternatives. The European Central Bank is testing a digital euro to prevent fragmentation of the payment landscape and preserve monetary sovereignty. Public agencies also turn to interactive kiosks to provide forms, licenses, and welfare services without staffed counters, advancing inclusion while trimming costs. While each jurisdiction balances privacy, addiction to cash, and age factors, the strategic direction favors terminals that bridge card, mobile wallet, and CBDC rails.
Restraints Impact Analysis of Self-Service Market*
| Restraint | (~) % Impact on CAGR Forecast | Geographic Relevance | Impact Timeline |
|---|---|---|---|
| Persistent vandalism and cash-handling security risks | -0.8% | Global; higher impact in urban and high-crime areas | Medium term (2-4 years) |
| High TCO for outdoor deployments in harsh climates | -0.6% | Northern climates; extreme-weather regions worldwide | Long term (≥4 years) |
| Source: Mordor Intelligence | |||
Persistent Vandalism and Cash-Handling Security Risks
Data from British Telecom revealed tens of thousands of attacks on pay-phones each year until ruggedized locks and alarms curbed incidents[2]UK Government Home Office, “Reducing Vandalism in Public Payphones,” gov.uk . Sophisticated jackpotting and skimming drives a physical and cyber security market forecast to reach USD 32.4 billion by 2032. Operators add fingerprint, facial recognition and multi-factor prompts to counter fraud, yet every new module raises cost per unit and elongates certification cycles. Collaborative patrols with police and AI-driven surveillance mitigate losses but cannot erase them entirely.
High TCO for Outdoor Deployments in Harsh Climates
Outdoor kiosks need sunlight-readable panels, HVAC, rain gaskets, and reinforced steel, which can double material bills relative to indoor units. ISO 9001 and UL labeling impose further compliance spending, while site prep for power and fiber may rival the kiosk itself. Operators recently removed 13% of ATMs per 100,000 adults, citing low footfall and maintenance drag. New solar panels and energy-aware firmware ease running costs, yet outdoor returns hinge on strategic placement in busy transit hubs where transactions justify the premium.
*Our forecasts treat driver/restraint impacts as directional, not additive. The impact forecasts reflect baseline growth, mix effects, and variable interactions.
Self-Service Market Segment Analysis
By Product Type:
Kiosks Lead Market TransformationKiosks controlled 35.74% self-service market share in 2025, highlighting their flexibility across check-in, ticketing, and bill payment. The self-service market size tied to kiosks benefits from continuous software refreshes that add language packs, AI avatars, and payment choices. Self-checkout lanes are growing at an 8.01% CAGR as grocers and general merchandisers curb labor expenses and speed the line. ATMs still anchor cash ecosystems, yet annual installations are plateauing because mobile transfers now satisfy many low-value needs. Vending machines move beyond snacks into OTC medicines, PPE, and time-sensitive vaccines, which widens their social footprint. Smart lockers registered brisk orders from logistics firms under pressure to cut last-mile costs and allow after-hours parcel pick-up. Healthcare kiosks, projected to ramp from USD 0.86 billion in 2025 to USD 1.92 billion by 2029, illustrate how diagnosis, telehealth, and prescription renewal can converge in compact footprints. Retailers adopt computer vision so cameras automatically weigh produce, minimizing errors and shopper frustration. The product mix will continue to reward vendors who merge durability with cloud hooks that unlock real-time insights and remote service.
Kiosk suppliers invest in antimicrobial surfaces, haptic feedback, and wheelchair-friendly layouts to stay ahead of accessibility rules. Self-checkout makers partner with fintech gateways to switch on buy-now-pay-later while still conforming to payment security standards. ATM vendors pivot toward Video Teller Machines and cryptocurrency modules to preserve relevance. Vending specialists test dynamic refrigeration and AI planograms to display fast-moving inventory first, which uplifts sales per square inch. Locker providers add temperature control for the grocery and pharmaceutical segments. Portfolio breadth, therefore, remains a hedge against shifts in consumer flow and merchant economics within the self-service market.


By Component:
Software Acceleration Drives Value MigrationHardware was responsible for 53.52% of revenue in 2025, yet software is advancing 8.66% each year and is the key to lifetime monetization. Vendors deploy containerized operating systems that permit secure updates without field visits, shortening mean-time-to-market for new features. Cloud dashboards spotlight usage spikes, allowing retailers to preload staff only when traffic demands. Diebold Nixdorf’s DN Vynamic suite connects more than 230,000 endpoints and pushes predictive maintenance alerts that reduce unscheduled downtime. AI engines sit at the edge, flagging suspicious withdrawal patterns within milliseconds and supporting instant lockouts. Integrations with loyalty platforms also open upsell moments right on the screen.
Services round out the component play, spanning installation, decommissioning, software patching, and compliance audits. As recurring contracts expand, service margins may eclipse those of hardware shipments. Accessibility consultants ensure adherence to tactile, speech, and visual standards laid out in the Federal Register. Firms that couple ERP and point-of-sale data with kiosk telemetry enable closed-loop analytics showing sales uplift by SKU, shift, and location. This visibility is central to procurement decisions at large chains that roll kiosks worldwide on thin capex cycles within the self-service market.
By End-User Industry:
Retail Dominance Amid Healthcare SurgeRetail and quick-service restaurants held 31.45% of the self-service market size in 2025 as staff shortages intensified and consumers favored self-checkout. Grocery leaders deploy conversational AI that upsells recipes while scanning items, transforming a routine task into engagement time. Apparel stores adopt smart mirrors so shoppers can request sizes without leaving the fitting room. In QSR, menu boards integrate with kitchen systems to tame peak load ordering, and staff can shift to order assembly rather than cash collection. Banks, though turning digital, still maintain lobby kiosks for document printing and account onboarding, nurturing omni-channel cohesion. Travel hubs embrace biometric e-gates that shorten queuing and comply with border control mandates.
Healthcare is poised for the sharpest 7.85% CAGR as kiosks expand triage, appointment scheduling, and remote diagnostics. Hospitals monitor vitals and issue after-visit summaries with minimal nurse intervention, freeing clinicians for acute cases. Pharmacies secure controlled substance dispensing behind biometric locks, removing after-hours gaps. UnitedHealthcare urges providers to press self-service portals for claims and authorizations, hinting at broader payer endorsement. The pandemic amplified the acceptability of remote consultations, so kiosks in corporate lobbies and rural clinics now double as telehealth nodes. Insurance, hospitality, and public administration also refine citizen touchpoints, embedding feedback loops into every transaction and demonstrating the elasticity of the self-service market.
By Technology:
Biometric Leadership Faces AI DisruptionBiometric solutions controlled 48.35% self-service market share in 2025. Fingerprint readers are commoditized, resulting in lower price points and broad embedded use. Facial recognition built on deep neural networks spots spoofing attempts, raising the bar for attackers. Hybrid authentication—voice plus palm vein—ensures high throughput without compromising security. AI and computer vision solutions, though newer, are clocking an 8.28% CAGR as retailers automate visual SKU recognition and banks add real-time fraud scoring. NFC modules benefited from pandemic hygiene rules and now appear in transit, parking, and event ticketing terminals. Cloud APIs centralize analytics so that operators can compare KPIs across borders and hardware generations.
Blockchain back-ends gain attention where immutable record trails are demanded, for example, in election kiosks and high-stakes gaming. Edge GPUs deliver instant inference for foreign object detection in coin recyclers, reducing jams that once required technician call-outs. Open standards such as W3C Web of Things ease cross-vendor orchestration, thereby curbing vendor lock-in. Biometric privacy laws push suppliers to embed on-device encryption and consent toggles, ensuring compliance without extra peripherals.
By Deployment Location:
Indoor Stability Versus Outdoor InnovationIndoor setups made up 66.02% of revenue in 2025, thanks to mall, branch, and hospital environments where temperature and security are predictable. Retailers capex indoor lanes first because ROI tracks foot-traffic metrics already in POS systems. Banks site adjunct video ATMs in vestibules that inherit building climate controls, extending service hours cheaply. Healthcare networks mount wall-embedded units that check symptoms, lowering waiting room stress. Education campuses deploy ID-issuing kiosks in registrar corridors where supervision is straightforward.
Outdoor stations, although only 33.98% today, are expanding 8.74% annually. Electric vehicle charging includes touchscreens for loyalty offers. Quick-serve brands build walk-up ordering panels to free drive-through lanes at meal peaks. Municipalities install unattended bill-pay portals outside city halls. Each outdoor asset integrates weather sensors that throttle screen brightness, HVAC, and power draw to lengthen component life. New powder-coat finishes and IoT locks deter graffiti and pry attacks. Energy harvesting roofs and battery packs let rural kiosks run even where mains power is scarce, extending the self-service market to previously unreachable customer clusters.
Geography Analysis
North America Self-Service Market
North America held 39.02% of revenue in 2025, reflecting long-standing adoption of automated teller technology, wide retail deployment, and supportive privacy regulations. Payment card penetration is nearly universal, and digital wallets are mainstream, so merchants prioritize terminals that handle chip, tap, and mobile credentials. Federal agencies devote stimulus budgets to broadband and digital government portals, fostering a consistent user experience in public service kiosks. Corporate appetite for AI, cloud, and cybersecurity rises each budget cycle, reinforcing demand for software-centric upgrades that sit atop existing hardware.
Europe Self-Service Market
Europe balances sustainability and inclusion. The European Commission urges eco-design and transparent supply chains, pushing manufacturers to lengthen device lifespans and publish carbon footprints. Accessibility law compels tactile keypads, audio prompts, and adjustable font sizes, which influence BOM and firmware design. Germany’s EHI initiative demonstrates commercial appetite by counting thousands of self-checkout lanes, while the region debates best formats for a digital euro that could seamlessly link to kiosks and ATMs. Operators retrofit remote telemetry to trim service van miles, aligning with climate targets.
APAC, South America and Middle East Self-Service Market
Asia-Pacific, advancing at an 8.17% CAGR, benefits from pro-digitization edicts and an explosion of smartphone-linked QR payments. India stages billions of UPI transfers each month, normalizing QR taps even in rural kiosks. China pilots a central bank digital currency that will likely integrate into transit and vending networks, placing pressure on operators to update firmware fast. Governments in ASEAN fund e-government lobbies inside post offices, reducing red tape while ensuring remote citizens receive equal service. South America and the Middle East trail but accelerate as telcos push mobile money and as tourism revives interest in multi-language ticketing stations.

Competitive Landscape
The self-service market shows moderate fragmentation. NCR Atleos monetizes roughly 800,000 ATMs worldwide, deriving 66.7% of revenue from service contracts that stabilize income. Diebold Nixdorf leverages a combined hardware and DN Vynamic software stack that connects 230,000 devices and feeds predictive algorithms, lowering field interventions[5]Diebold Nixdorf Incorporated, “DN Vynamic Connected Commerce Framework,” dieboldnixdorf.com. Smaller specialists focus on niche areas such as biometric modules or outdoor enclosures and partner with big integrators for distribution.
Strategy tilts toward platform billing. Vendors roll out ATM-as-a-Service, where banks pay by transaction rather than purchase outright boxes. Retail solution providers bundle computer vision licenses with cameras and lighting kits, shifting expenses to opex. Healthcare kiosk makers enter subscription deals covering device, telehealth link, and medical peripherals. Barriers to entry arise from patent portfolios around secure cash recyclers, ADA compliance, and encryption key management.
Innovation centers on AI, cloud hooks, and ruggedization. NCR Voyix, set up after the ATM spin-off, concentrates on retailers and restaurants with cloud POS that unifies kiosk, mobile, and drive-through experiences. Emerging players integrate large-language models so voice commands rewrite menus in real time, aiding visually impaired users. Outdoor kiosk designers add passive cooling and e-ink promotion panels that slash power bills. Competition, therefore, balances the scale economies of incumbents against the agility of domain-focused challengers within the self-service market.
Self-Service Industry Leaders
NCR Corporation
Diebold Nixdorf
Fujitsu Ltd.
Zebra Technologies
HESS Cash Systems GmbH
- *Disclaimer: Major Players sorted in no particular order
Self-Service Market Companies Covered in this Report
- NCR Corporation
- Diebold Nixdorf
- Crane Payment Innovations
- Fujitsu Ltd.
- Glory Global Solutions
- Zebra Technologies
- Advantech Co. Ltd.
- Frank Mayer and Associates Inc.
- HESS Cash Systems GmbH
- Azkoyen Group
- Embross
- SEDCO
- IER Group
- Maas International B.V.
- RedyRef Interactive
- Olea Kiosks Inc.
- Posiflex Technology Inc.
- SlabbKiosks
- KIOSK Information Systems

Recent Industry Developments in Self-Service Market
- April 2025: Kenvue partnered with Microsoft for a five-year plan to use AI and predictive analytics in consumer health product operations.
- February 2025: Loc Software profiled next-gen grocery self-checkout dynamics.
- May 2024: Sam’s Club deployed AI-powered checkout to speed in-store transactions.
- May 2024: REWE Group expanded its Pick&Go cashierless store in Düsseldorf, and Marvel Stadium installed AI self-checkout kiosks for faster concessions.
- May 2024: Currys joined Accenture and Microsoft to embed AI in operations, while AutoStore launched Pio automated warehouses for SME e-commerce.


Self-Service Market Report Scope and Research Methodology
Market Definition and Coverage
Our study defines the global self-service market as the revenues generated from hardware-centric unattended terminals, ATMs, interactive kiosks, vending machines, self-checkout lanes, and smart parcel lockers, together with the embedded software, maintenance services, and enabling payment modules that let customers complete a transaction without staff interaction. Revenues are captured at manufacturer selling price, converted to constant 2024 USD, and are mapped to retail, BFSI, healthcare, hospitality, transport, government, and other public venues.
Scope exclusion: purely digital self-service applications (e.g., mobile chatbots, IVR platforms) without an associated physical terminal are not counted.
Segments Covered in This Report
- By Product Type
- Kiosk
- ATM
- Vending Machine
- Self-Checkout System
- Smart Locker / Parcel Station
- By Component
- Hardware
- Software
- Services
- By End-user Industry
- BFSI
- Retail and Quick-Service Restaurant
- Hospitality
- Healthcare
- Transportation and Travel Hubs
- Government and Public Sector
- By Technology
- Biometric-Enabled
- NFC / Contactless
- AI-Driven and Computer-Vision
- Cloud-Connected
- By Deployment Location
- Indoor
- Outdoor
- By Geography
- North America
- United States
- Canada
- Mexico
- Europe
- Germany
- United Kingdom
- France
- Italy
- Spain
- Russia
- Rest of Europe
- Asia-Pacific
- China
- Japan
- India
- South Korea
- ASEAN
- Australia and New Zealand
- Rest of Asia-Pacific
- South America
- Brazil
- Argentina
- Rest of South America
- Middle East and Africa
- Middle East
- Saudi Arabia
- UAE
- Turkey
- Rest of Middle East
- Africa
- South Africa
- Nigeria
- Rest of Africa
- Middle East
- North America
Data Sources, Market Sizing, and Validation
Primary Research
Our team spoke with kiosk OEM product managers, payment network executives, large retailers, and facility managers across North America, Europe, and Asia-Pacific. The interviews validated installed-base counts, typical replacement cycles, outdoor unit failure rates, and likely ASP movements that secondary data alone could not clarify.
Desk Research
We built the initial data spine from reputable, open datasets such as World Bank digital-payment indicators, UN Comtrade shipment codes for kiosks and cash dispensers, the Federal Reserve Payments Study, and trade association dashboards from the ATM Industry Association, National Automatic Merchandising Association, and Airports Council International. Company filings, investor decks, and selected articles on Factiva supplemented supplier revenue splits. D&B Hoovers furnished hard-to-find private-company estimates, giving us consistent global roll-ups. Regulatory notices (PCI-DSS v4.0 adoption timelines, EMV migration reports) and government tender portals added visibility on upcoming fleet refreshes. These sources are illustrative, not exhaustive; our analysts reviewed many other public records to cross-check volumes, values, and pricing inflections.
Market-Sizing & Forecasting
A top-down model reconciled import/export flows, domestic production, and retirement curves to arrive at the net active installed base, which was then multiplied by weighted average selling prices. We corroborated totals with selective bottom-up checks, sampled supplier revenues, and large roll-out announcements before adjusting for channel margins. Key variables include cashless-transaction penetration, urban footfall indices, minimum-wage growth (labor substitution driver), kiosk uptime targets, and government capex incentives. Forecasts employ multivariate regression blended with scenario analysis to reflect differing economic outlooks shared by interviewees. Data gaps on emerging geographies were bridged using regional proxy ratios derived from similar GDP-per-capita clusters.
Data Validation & Update Cycle
Mordor analysts run outlier, currency, and YoY variance tests, then a second reviewer challenges anomalies. Reports refresh each year, with interim updates triggered by material events such as large regulatory mandates or mega deployment contracts. A final pre-publication sweep ensures clients receive the latest view.
How Mordor Intelligence's Self-Service Market Size Compares to Other Published Estimates
Published figures vary because firms pick different product baskets, price assumptions, and refresh rhythms. We publicly spell out our scope and refresh cadence, so buyers see exactly what is and is not included before trusting the numbers.
Key gap drivers are usually the inclusion of digital-only platforms, use of list rather than transacted prices, or one-off survey samples that miss gray-market flows. Our base year ties back to verifiable trade codes and audited vendor filings, while others often rely on user surveys or single-region extrapolations.
Benchmark comparison
| Market Size | Anonymized source | Primary gap driver |
|---|---|---|
| USD 38.36 B (2025) | Mordor Intelligence | - |
| USD 41.96 B (2025) | Global Consultancy A | Counts standalone software and applies headline ASPs without discounting |
| USD 42.90 B (2025) | Technology Think Tank B | Uses single scenario, limited primary checks, and bundles CRM chatbots |
| USD 41.27 B (2024) | Investment Insights C | Older base year and average exchange rates from Q1 2024 |
The comparison shows that once scope creep, pricing choices, and dated baselines are adjusted, the spread narrows sharply. Our disciplined source hierarchy and yearly refresh give decision-makers a transparent, repeatable starting point.


Key Questions Answered in the Report
What is the current value of the self-service market?
The self-service market was valued at USD 41.27 billion in 2026 and is projected to reach USD 59.42 billion by 2031.
Which region leads the self-service market?
North America leads with 39.02% revenue share in 2025, supported by mature banking networks and retail automation.
Which segment is growing fastest in the self-service market?
Self-checkout systems show the quickest rise, posting an 8.01% CAGR through 2031 as retailers target labor savings and speed.
How significant is software in the self-service market?
Software is expanding at a 8.66% CAGR and is pivotal for AI, analytics and recurring revenue, even though hardware still contributes over half of 2025 revenue.
What are the main restraints impacting self-service deployments?
Vandalism and cash-handling security risks, plus high outdoor deployment costs in harsh climates, weigh on expansion and trim the overall CAGR by an estimated 1.4 percentage points.
Why is healthcare a promising end-user industry?
Healthcare kiosks help manage staffing shortages, enable telehealth and speed patient intake, driving an 7.85% CAGR and an anticipated leap from USD 0.86 billion in 2025 to USD 1.92 billion by 2029.
Page last updated on:


