
Market Overview
| Study Period | 2021 - 2031 |
|---|---|
| Forecast Data Period | 2026 - 2031 |
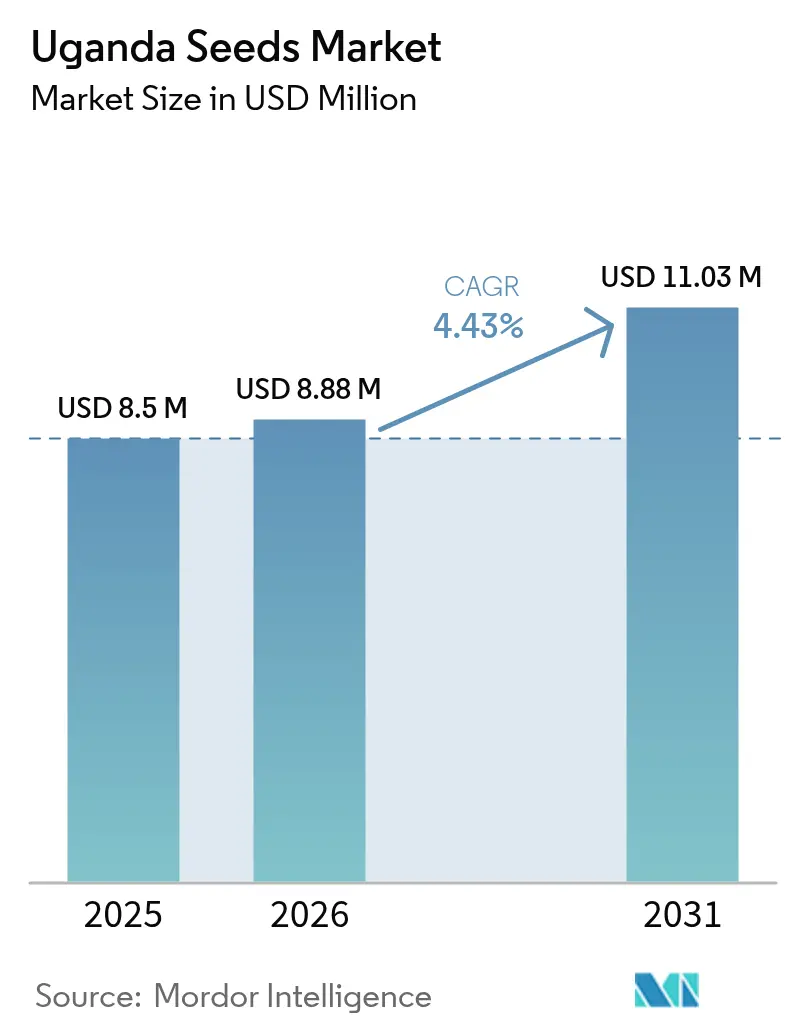
| Base Year Market Size (2025) | USD 8.50 Million |
| Market Size (2026) | USD 8.88 Million |
| Market Size (2031) | USD 11.03 Million |
| Growth Rate (2026 - 2031) | 4.43 % |
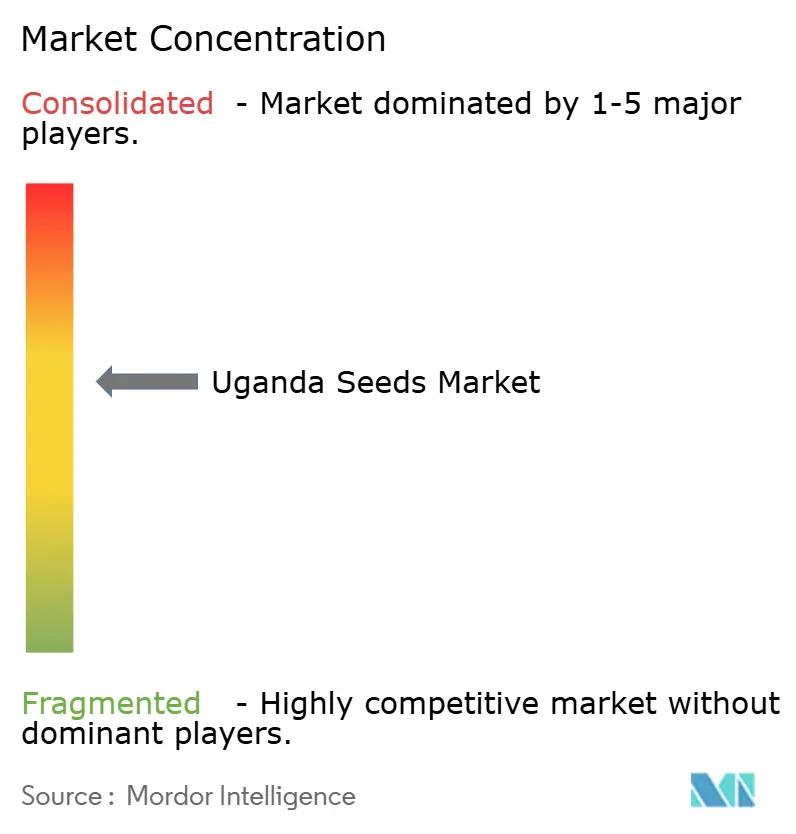
| Market Concentration | Medium |
Major Players
*Disclaimer: Major Players sorted in no particular order Image © Mordor Intelligence. Reuse requires attribution under CC BY 4.0. |
|
Uganda Seeds Market Analysis by Mordor Intelligence
The Uganda seeds market size was valued at USD 8.50 million in 2025 and estimated to grow from USD 8.88 million in 2026 to reach USD 11.03 million by 2031, at a CAGR of 4.43% during the forecast period (2026-2031). Rising government spending on agro-industrialization, including the USD 1.86 trillion allocation in the 2025/26 budget, strengthens commercial farming demand for certified genetics, while the Parish Development Model channels USD 276 million into input access for nine sub-regions. Hybrid varieties dominate adoption due to their yield stability across Uganda’s fourteen agro-ecological zones, yet 85-89% of smallholders still rely on informal seed channels, which limit the speed of genetic gain. Private breeders accelerate product cycles by collaborating with the National Agricultural Research Organization (NARO) to run 17 confined field trials for stacked-trait maize, banana, and cassava, a pathway that shortens trait release timelines by at least two seasons. Parallel opportunities emerge from climate-smart initiatives, such as the Environmental Conservation Trust of Uganda's (ECOTRUST) carbon-credit scheme, which rewards farmers who integrate improved seeds and agroforestry practices, thereby expanding the revenue base beyond crop sales.
Key Report Takeaways
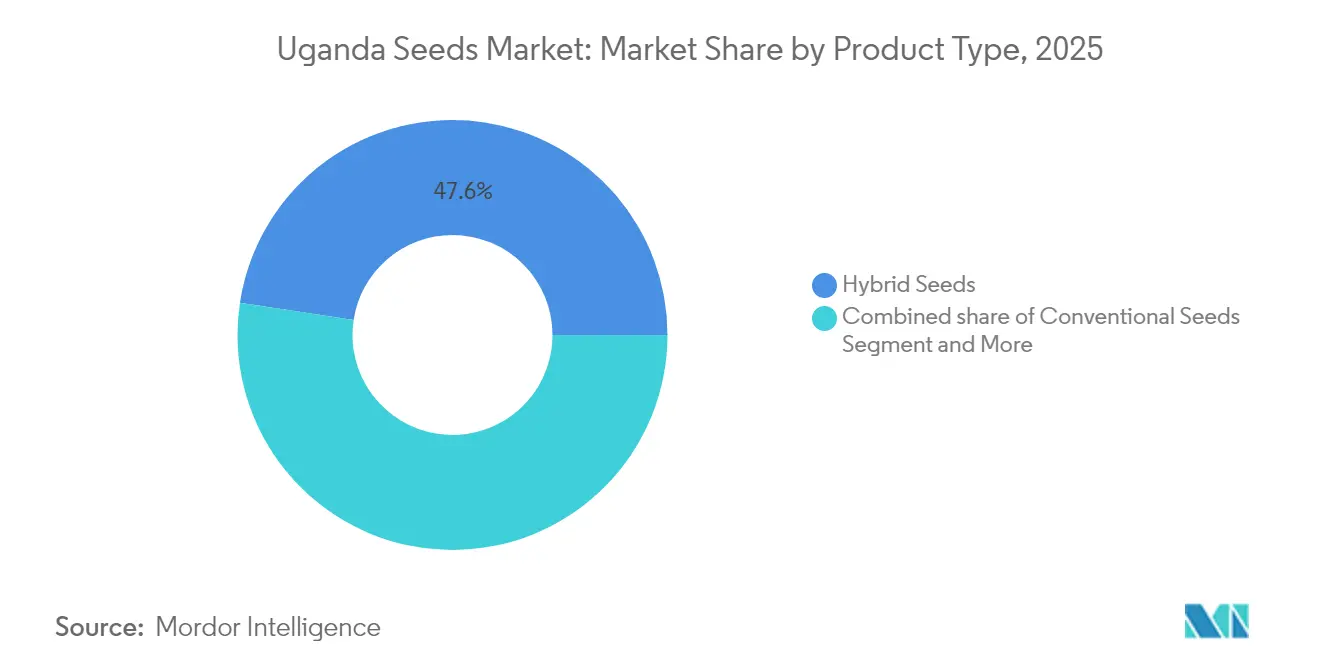
- By product type, hybrid seeds led with 47.60% of the Uganda seeds market share in 2025. Genetically modified seeds are projected to compound at a 9.06% CAGR through 2031.
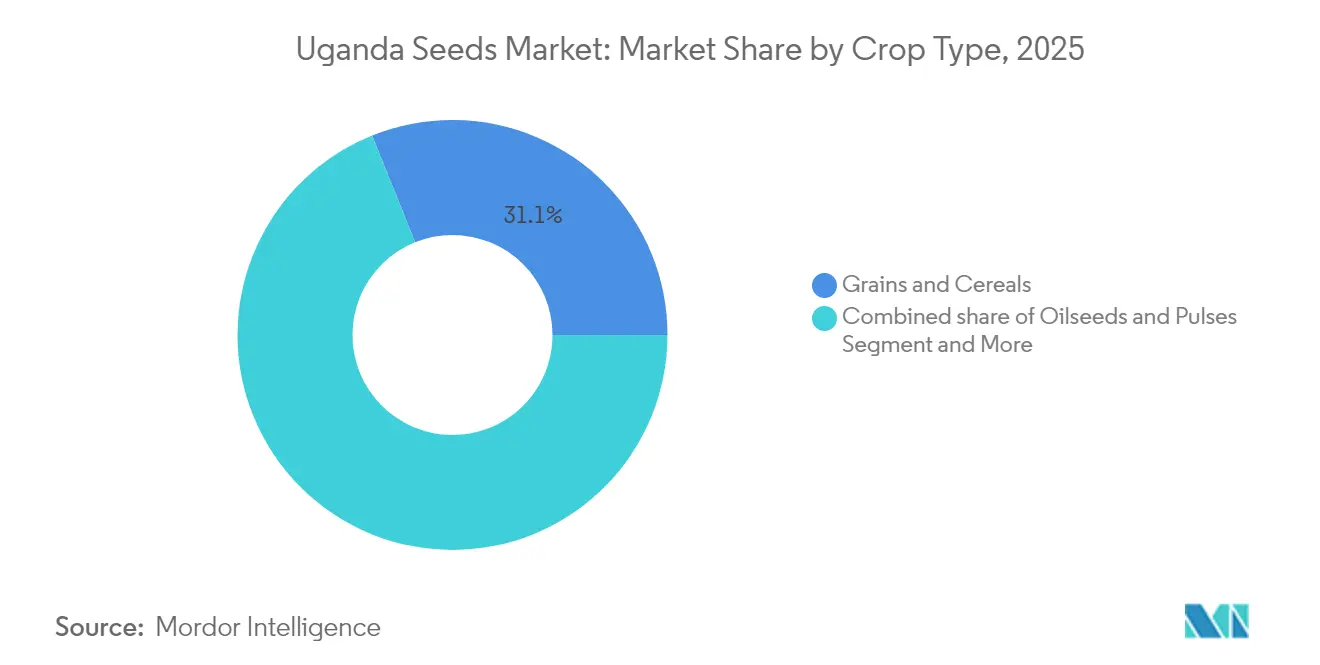
- By crop type, grains and cereals accounted for 31.10% of the Uganda seeds market size in 2025, and oilseeds and pulses are projected to advance at an 8.25% CAGR to 2031
Note: Market size and forecast figures in this report are generated using Mordor Intelligence’s proprietary estimation framework, updated with the latest available data and insights as of 2026.
Uganda Seeds Market Trends and Insights
Drivers Impact Analysis*
| Driver | (~)% Impact on CAGR Forecast | Geographic Relevance | Impact Timeline |
|---|---|---|---|
| Commodity-price support programs | +0.8% | National, with a concentration in Northern and Eastern regions | Medium term (2-4 years) |
| Expansion of stacked-trait GM and gene-edited varieties | +1.2% | National, early adoption in Central and Western Uganda | Long term (≥ 4 years) |
| On-farm data analytics driving seed placement optimization | +0.3% | Emerging in commercial farming areas, limited rural penetration | Long term (≥ 4 years) |
| Carbon-credit revenue opportunities for growers using improved seeds | +0.4% | Rural areas with agroforestry potential, particularly Western Uganda | Long term (≥ 4 years) |
| Accelerated trait-approval timelines via NARO regulatory frameworks | +0.7% | National, with research centers in Kawanda and regional stations | Medium term (2-4 years) |
| Increase in Area Under Commercial Crops | +0.6% | Global trend, Uganda following regional patterns | Medium term (2-4 years) |
| Source: Mordor Intelligence | |||
Commodity-Price Support Programs
Government schemes such as Operation Wealth Creation and the Parish Development Model distributed more than 600,000 Hass avocado seedlings between 2024 and 2025, cushioning producer margins and lifting demand for quality seed lots despite volatile farm-gate prices[1]Source: International Institute for Sustainable Development, "Agricultural Subsidies, A case for Uganda," iisd.org. Subsidized credit lines worth USD 30 billion extend working capital for input purchases, enabling smallholders to trial higher-value hybrids that were once unaffordable. While the incentives increase certified seed uptake, they also concentrate adoption on a narrow range of hybrids, exposing farmers to monoculture-related pest and price risks. Bureaucratic layers slow disbursement, and political influence sometimes skews geographic targeting, creating patchy benefits across districts. Nonetheless, the guaranteed demand floor boosts processor confidence in securing raw material flows and encourages private breeders to widen product portfolios.
Expansion of Stacked-Trait GM and Gene-Edited Varieties
National Agriculture and Food Research Organization (NARO) and international partners have advanced 17 confined field experiments, positioning Uganda to leapfrog regional peers in drought- and pest-tolerant germplasm. Maize yields show 18-32% gains, equivalent to USD 500-864 per hectare, a differential that can double net farm income in semi-arid Karamoja. Biosafety evaluations are conducted faster than regional averages, yet commercialization still lags behind Kenya by roughly two seasons due to parliamentary delays. Public awareness is low, with only 39.1% of farmers having heard of GM crops, raising the specter of market resistance unless outreach efforts intensify. The eventual rollout is projected to increase genetic diversity in formal channels and enhance resilience to climate shocks that are increasingly reducing yields.
On-Farm Data Analytics Driving Seed Placement Optimization
Digital agricultural platforms like the Yara FarmCare app enable data-driven decision-making for crop management, though penetration remains limited to commercial farming operations. The World Bank's Micro-scale Irrigation Program incorporates digital tools like the IrriTrack app for farmer registration and support, emphasizing local decision-making and female participation. Agricultural digitalization initiatives focus on improving seed distribution and access to information, though infrastructure limitations and low technology adoption rates among smallholders constrain widespread implementation. The integration of precision agriculture concepts remains in early stages, with potential for growth as mobile network coverage expands and smartphone adoption increases among farming communities.
Carbon-Credit Revenue Opportunities for Growers Using Improved Seeds
ECOTRUST’s Trees for Global Benefits enrolled 400 farmers who planted 35,000 trees, generating an anticipated 25,000 metric tons of CO₂ sequestration over two decades and unlocking USD 8-10 per metric ton forward credit pricing that flows directly to participants. Agroforestry using Grevillea robusta sequesters up to 470 metric tons CO₂e per hectare, while integrating improved maize hybrids into alley cropping elevates average household cash income by 23%. Village savings groups ease entry costs, yet complex verification protocols and high brokerage fees curtail wider adoption. If digital MRV (measurement, reporting, verification) tools gain scale, carbon credits could subsidize premium seed purchases and reduce payback periods for smallholders.
Restraints Impact Analysis*
| Restraint | (~)% Impact on CAGR Forecast | Geographic Relevance | Impact Timeline |
|---|---|---|---|
| Consolidation-driven price increases for proprietary genetics | -0.9% | Global impact, particularly affecting smallholder farmers | Short term (≤ 2 years) |
| Regulatory uncertainty around state-level pesticide bans | -0.5% | National, with varying enforcement across districts | Medium term (2-4 years) |
| Increasing incidence of herbicide-resistant weeds | -0.7% | Agricultural regions, particularly intensive farming areas | Long term (≥ 4 years) |
| Consumer pushback on gene-editing transparency | -0.4% | Urban centers and export markets, limited rural impact | Medium term (2-4 years) |
| Source: Mordor Intelligence | |||
Consolidation-Driven Price Increases for Proprietary Genetics
Global mergers have trimmed competitive choice. Bayer’s 2024 seed revenue fell 2% to EUR 22.3 billion (USD 24.5 billion), yet list prices in sub-Saharan markets rose 4-6% as the firm recovers R&D costs. Hybrid maize bags sourced from Kenya retail at 15–18% more than locally bred options, squeezing margins for resource-constrained smallholders. With limited royalty-free alternatives, farmers may revert to saved seed, lengthening the turnover time for superior genetics. Policy proposals for pooled public germplasm licensing are under discussion but remain unfunded.
Regulatory Uncertainty Around State-Level Pesticide Bans
District-specific bans on select cholinesterase inhibitors complicate seed-treatment registrations and force firms to redevelop coating recipes every two seasons, raising formulation expenses by 12%. Non-uniform enforcement seeds ambiguity across retail chains, discouraging inventories of integrated seed and chemistry packages. Smallholders often misapply pesticides, compounding resistance risks and eroding variety performance. A harmonized national registry is in the draft stage but lacks budget allocation for inspectors.
*Our forecasts treat driver/restraint impacts as directional, not additive. The impact forecasts reflect baseline growth, mix effects, and variable interactions.
Segment Analysis
By Product Type: Hybrid Dominance Drives Market Evolution
Hybrid lines held 47.60% of Uganda seeds market share in 2025, and they retained price premium over conventional varieties. The Uganda seeds market size for hybrid seeds is projected to climb at a steady rate, underpinned by highland-specific releases such as NAROMAIZE 731, which yields 8.2 metric tons per hectare on slopes above 1,800 meters. Private firms co-license parental lines with NARO, thereby accelerating local adaptation while maintaining competitive breeder royalties. Hybrid adoption is correlated with access to off-farm income, and farmers earning more than USD 2,500 annually have a 2.1 times higher probability of purchase than their subsistence peers. Retail penetration, however, is limited by agro-dealer density, and one outlet serves 1,400 farmers in Northern districts versus 320 in Central, highlighting distribution gaps that private distributors aim to bridge through mobile vans and village stockists.
Genetically Modified Seeds constitute the fastest rising slice of the Uganda seeds market, clocking a 9.06% CAGR. The Uganda seeds market for GM corn alone could surpass by 2030 once commercial clearance aligns with Kenya’s precedent. Confined field data show that the TELA event reduces pesticide sprays from six to two per season, a benefit that offsets seed cost premiums within two harvests. Opposition from civil-society groups prompts regulators to mandate extensive public hearings, elongating introduction timelines. Conventional seeds continue to meet low-input farmer needs and occupy 39.40% of total planting material. Quality Declared Seed (QDS) offers a stepping-stone, cooperatives in Lango produce 1,200 metric tons annually, reducing last-mile transport costs by 14% and fostering gradual upgrade to certified status.



By Crop Type: Food Security Priorities Shape Demand Patterns
Grains and Cereals represented 31.10% of Uganda seed market revenue in 2025, reflecting maize’s central role in daily caloric intake and poultry feed demand. The Uganda seeds market size attributed to cereal hybrids is projected to advance annually, buoyed by school feeding programs and regional deficit imports from Kenya and South Sudan. Only 6% of cereal farmers used improved varieties in 2024, and scaling this up to 25% could increase national output by 400,000 metric tons and save USD 62 million in grain imports. Disease-tolerant sorghum and rice lines are under review in the pipeline, promising multi-crop risk mitigation for rain-fed systems.
Oilseeds and pulses represent the fastest-growing crop category, with a CAGR of 8.25%, supported by domestic soybean processors who are set to double their crush capacity between 2023 and 2025. Farmers in Mid-Western districts are shifting from tobacco to sunflower hybrids, chasing farm-gate prices that have risen 21% year-on-year. Uganda emerged as the sixth-largest African soybean grower in 2025, and the Uganda seeds market share for oilseed genetics is forecast to reach 18.35% by 2031. Vegetables capture urban dietary diversification, but seed quality complaints persist because informal exchanges account for 64% of tomato seed sales, undermining uniformity in fresh-produce supply chains. Cash crops such as vanilla and coffee capitalize on premium export niches, and vanilla exports grew to 600 metric tons in 2024, prompting research into disease-tolerant clonal lines that stabilize pod weight.
Geography Analysis
Central and Western Uganda collectively accounted for the largest share of revenue in the Uganda seed market in 2025, supported by superior infrastructure, denser agro-dealer networks, and higher median farm incomes. Maize hybrids show adoption rates of 28% in this corridor, compared to 13% nationwide, reflecting an agile extension ecosystem that links research stations in Kawanda and Mbarara to producer groups through seasonal field days. The region also hosts the bulk of irrigation pilots, which lessen rainfall risk and incentivize farmers to invest in higher-value genetics.
Northern Uganda, including Lango and Acholi, is poised for the highest growth as development partners channel seed vouchers through the USD 276 million Northern Uganda Social Action Fund (NUSAF) Phase IV scheme, thereby lowering upfront input costs. Conservation-agriculture plots demonstrate 23% yield gains when paired with drought-tolerant hybrids, a narrative that is drawing agro-dealers into districts previously deemed low-volume. Transportation advances, such as the upgrading of the Gulu–Kitgum corridor, are expected to reduce freight rates by 17%, benefiting seed shelf life and pricing.
Eastern highland areas grapple with soil erosion, yet targeted releases like NAROMAIZE 733 deliver 7.2 metric tons per hectare and shorten maturity to five months, helping farmers align harvests with peak school-fee seasons. The semi-arid Karamoja sub-region remains underserved, and only 9% of households use certified seed, largely because road quality drops to below 35% passability in the rainy season. Planned micro-scale irrigation on 45,000 hectares should nudge adoption by improving yield reliability. Cross-border exchanges with Kenya continue to supply roughly 50% of Uganda’s imported seed, but harmonization lags as customs weighbridges impose variable axle rules that inflate transit times by up to 48 hours.
Regulatory Landscape
Uganda's formal seed system is anchored by the Seeds and Plant Act, 2006 (Act No. 3 of 2007) and the Seeds and Plant Regulations, which set operational procedures for breeding, testing, certification, and marketing. Oversight sits with the National Seed Certification Service (NSCS) under the Ministry of Agriculture, Animal Industry and Fisheries (MAAIF), covering variety testing (including NPT and DUS), field inspection, sampling and laboratory testing, and the registration and licensing of seed merchants, conditioners, and dealers. The Act also requires registration of seed sellers.
The National Seed Policy provides the sector policy framework and includes an institutional transition in which NSCS is to be transformed into the Uganda Plant Health and Inspectorate Agency (UPHIA) to consolidate seed regulation with phytosanitary and agricultural chemical oversight. Alongside this, MAAIF-managed online certification and application processes keep formal compliance workflows in motion, improving traceability and enforcement capacity within the certified segment even as the market still relies heavily on informal seed channels.
Competitive Landscape
The Uganda seeds market hosts more than 40 registered firms, yet the top Bayer AG, Corteva Inc., and Syngenta Group collectively captured a major share of branded volumes in 2024. Bayer’s decision to streamline SKUs after a global restructure concentrated marketing on three premium maize hybrids, each backed by radio blitz campaigns in Luganda and Luo. Corteva Agriscience rolled out a field-edge digital advisory named “Wakulima Smart” that reached 12,000 farmers within six months, driving a 17% sales jump for its Pioneer P2859W hybrid. Syngenta group, meanwhile, piloted cart-based mobile seed shops in Kampala peri-urban zones, cutting retail mark-ups by 8% and boosting brand visibility among market-oriented vegetable growers.
Regional players leverage cross-border scale economies. Kenya Highland Seed introduced a hot-pepper line co-branded with Ugandan processors, capturing a new niche in the fast-growing spice segment. Seed Co International ramped up its QDS out-grower scheme, contracting 1,100 farmers and guaranteeing buy-back, thereby securing 2,400 metric tons of near-foundation stock for 2026 planting. Local challenger Equator Seeds differentiated itself through early-maturing sorghum for brewery supply, achieving a 62% repeat purchase rate in pilot zones.
Yara and Asili Agriculture’s partnership offers bundled seed treatments and micronutrient packages, promising a 15% return on investment even at smallholder scale. Start-ups such as EzyAgric aggregate agro-dealer inventory online and deliver to farm gates within 48 hours, eroding the traditional advantage of legacy distributors. Strategic alliances with carbon project developers add another lever, firms that certify hybrid adoption within agroforestry earn premium positioning with export-led coffee estates that need verifiable ESG credentials.
Uganda Seeds Industry Leaders
-
Bayer Crop Science
-
Corteva Agriscience
-
Syngenta Group
-
BASF SE
-
Groupe Limagrain
- *Disclaimer: Major Players sorted in no particular order

Market Opportunities and Future Outlook
Digitization of quality assurance creates room for seed companies and distributors to capture demand that currently shifts to counterfeits and informal trade. In May 2026, MAAIF, via NSCS, demonstrated a GPS-enabled Seed Tracking and Traceability System (STTS) designed to phase out manual paperwork and enable farmer authentication of certified seed through security-enhanced labels, which benefits brands that can link labeling with dealer training and last-mile education in their go-to-market models.
Pipeline depth from public research and structured commercialization pathways also supports private multiplication and localized seed hubs. As of 2025, NARO had licensed 26 private companies to commercialize 92 crop varieties, and it handed over 13 potato varieties (September 2025) to nine private seed companies for multiplication, pointing to demand for early generation seed, decentralized bulking, and disciplined cold-chain or storage operations. For vegetables, the KOICA-linked VegeSeed work, which moves multiple tomato, pepper, and nakati lines into National Performance Trials (March 2026 milestone), offers a concrete route to locally bred vegetable seed portfolios, while the Parish Development Model and NUSAF IV input channels keep input access central to scaling certified adoption beyond the current informal-dominant smallholder baseline.
Recent Industry Developments
- May 2026: Uganda's National Seed Certification Service (NSCS) under MAAIF demonstrated a GPS-enabled Seed Tracking and Traceability System (STTS) to stakeholders to digitize certification workflows and curb counterfeit seed trade. The shift from manual documentation to traceable labels raises the compliance bar for seed merchants while giving organized brands a clearer path to differentiate certified seed at retail.
- September 2025: NARO handed over 13 potato varieties to nine private seed companies, including FICA Seeds and Sterling Seeds, for commercial multiplication. This expands the multiplication pipeline for high-value seed systems and supports the build-out of decentralized seed hubs that reduce reliance on imported planting material.
- November 2024: Yara International partnered with Asili Agriculture in Uganda to promote sustainable farming, including farmer training tied to maize and soybean production systems. The collaboration strengthens bundled agronomy-plus-input models that can lift hybrid and improved seed performance, supporting repeat purchases and dealer-driven adoption.


Research Methodology Framework and Report Scope
Market Definition and Coverage
For this methodology, the Uganda seed market is defined as the value of commercial seeds sold for sowing in Uganda, covering major field crops and vegetable crops, counted at the point of sale to the farming channel in USD.
Scope exclusions: Farm-saved seeds, seeds used for human or animal consumption, and vegetatively reproduced planting material (and other non-sowing plant parts sold commercially) are excluded.
Segmentation Overview
-
By Product Type
- Hybrid Seeds
- Genetically Modified (GM) Seeds
- Conventional Seeds
-
By Crop Type
-
Grains and Cereals
- Maize
- Wheat
- Rice
- Sorghum
- Other Grains and Cereals
-
Oilseeds and Pulses
- Soybean
- Canola
- Sunflower
- Pulses
- Other Oilseeds
-
Vegetables
- Solanaceae
- Cucurbits
- Roots and Bulbs
- Brassicas
- Other Vegetables
- Cash Crops
- Other Crops
-
Grains and Cereals
Data Sources, Market Sizing, and Validation
Desk Research
Desk research was used to build the base model structure and to anchor it to Uganda-specific cropping realities before assumptions were finalized. We relied on public sources such as the FAOSTAT database for crop area and production context, Uganda Bureau of Statistics releases for agriculture indicators, and Ministry of Agriculture (MAAIF) updates for policy direction and program coverage.
To cross-check supply-side signals, we reviewed materials from bodies such as the International Seed Testing Association and peer-reviewed agronomy and seed adoption studies that discuss quality seed usage, replacement behavior, and yield response. Import and export direction was validated using official customs and trade statistics where available, and this was complemented with company filings, public investor presentations, and reputed press coverage. A paid subscription for shipment-level import and export intelligence and a patent database were used selectively to clarify product flow and breeding activity signals. These examples are not exhaustive, and other public sources were referenced to collect data, validate it, and clarify open questions.
Primary Interviews and Surveys
In Uganda, we interview seed producers, importers, distributors, agro-dealers, crop researchers, regulators, and farm-facing managers. Surveys and expert checks clarify certified volumes, informal leakage, imported supply, package prices, crop adoption, and channel margins. We use these responses to address gaps in the desk data and reconcile demand with supplier and trade evidence.
Distribution of primary research fieldwork respondents
| Company type | Respondent position |
|---|---|
| Top tier: 27% | CXOs: 18% |
| Mid tier: 48% | Functional/Unit leaders: 32% |
| Smaller Players: 25% | Managers: 50% |
Market-Sizing & Forecasting
The sizing approach uses top-down demand pool reconstruction, where crop-wise planted area and the share of farmers buying commercial seed are translated into a seed volume requirement, which is then priced to reach a USD market value. To keep results grounded, we ran selective bottom-up checks using channel feedback on sales by crop, typical pack-size movement, and sampled price points for hybrid, GM, and conventional or varietal seeds.
Key inputs that shape the model include planted area by crop group, replacement rates for purchased seed versus farm-saved seed, adoption of hybrid and improved varieties, typical seed rate per hectare (where agronomy guidance is consistent), and observed price bands by crop and seed type at distributor and dealer levels. When data was missing for smaller crops, we used proxy relationships from similar crop groups and then tested those proxies with local expert feedback before finalizing totals.
For forecasting, we applied scenario analysis supported by a simple multivariate regression on drivers that are explainable in a client call, such as expected changes in crop area, input affordability, distribution reach, and seed replacement behavior. Assumptions were adjusted only when multiple interview rounds and observable signals moved in the same direction.
Data Validation & Update Cycle
Validation is done through multiple checks so the final number does not depend on one data series. We compare model output with independent signals such as import direction for seed categories, consistency of implied seed volume versus plausible cropping area, and whether price and adoption assumptions match what channels report.
If large variances show up by crop or seed type, we revisit the inputs and recheck the concerned nodes with respondents, followed by an internal analyst review before sign-off. Reports are refreshed annually, and interim updates are made when material events occur, such as changes in seed certification policy, sudden currency movement affecting prices, or major shifts in crop economics. Before delivery, a final pass is completed so clients receive the most current view available at that time.
Mordor Intelligence's Uganda Seed Market Size Measured Against Other Published Estimates
It is common to see different market sizes for seeds in Uganda because each publisher draws the market boundary differently and applies its own assumptions for adoption, pricing, and what counts as commercial seed. Differences also show up when the year of reference is not aligned, and when currency conversion timing is handled differently.
The table shows a wide spread. In the Mordor Intelligence model, the value is limited to commercial seeds sold for sowing in Uganda, while excluding farm-saved seed and seed meant for food or feed, which can materially change what is counted as the addressable market.
Benchmark comparison
| Source | Market Size | Gaps in Research Methodology |
|---|---|---|
| Mordor Intelligence | USD 8.50 M (2025) | |
| Industry Publisher A | USD 120.00 M (2023) | Uses a broader definition that appears to mix formal and informal seed systems and may include wider value chain activities beyond seeds sold strictly for sowing, which inflates totals versus a sowing-only boundary. |
| Industry Publisher B | USD 8.25 M (2023) | Same country focus but uses a different base year and a wider study frame, and its pricing and crop coverage assumptions are not clearly tied to sowing-only exclusions, which can shift the value even if growth rates look similar. |
Overall, the spread mainly comes from scope choices and the year used for the stated value, and then from how adoption and price progression are applied across crop groups. By keeping assumptions traceable to crop area, replacement behavior, and observed dealer pricing, the approach produces a repeatable number that can be revisited when new season signals emerge.


Key Questions Answered in the Report
What value will the Uganda seeds market reach by 2031?
It is projected to hit USD 11.03 million by 2031, expanding at a 4.43% CAGR from the 2025 base of USD 8.50 million.
Which seed category leads current sales?
Hybrid Seeds lead with a 47.60% share of 2025 sales, largely because of superior yield stability under diverse agro-ecological conditions.
Which crop segment is growing the fastest?
Oilseeds and Pulses are set to grow at an 8.25% CAGR to 2031 due to rising processor demand and expanding export channels.
How significant is informal seed sourcing in Uganda?
Informal channels still account for 85-89% of smallholder seed use, limiting rapid genetic improvement but offering low-cost access.
How are carbon credits linked to seed adoption?
Programs such as Trees for Global Benefits pay farmers for agroforestry that uses improved seed, generating an extra income stream that offsets input costs.
Page last updated on:





