Market Overview
| Study Period | 2017 - 2030 |
|---|---|
| Forecast Data Period | 2025 - 2030 |
| Historical Data Period | 2017 - 2023 |
| Market Size (2025) | USD 743.10 Million |
| Market Size (2030) | USD 974.60 Million |
| Growth Rate (2025 - 2030) | 5.60% CAGR |
| Market Concentration | Low |
Major Players *Disclaimer: Major Players sorted in no particular order Image © Mordor Intelligence. Reuse requires attribution under CC BY 4.0. | |

Africa Vegetable Seed Market Analysis by Mordor Intelligence
The Africa vegetable seed market size stood at USD 743.1 million in 2025 and is forecast to reach USD 974.6 million by 2030, advancing at a 5.6% CAGR during the period. Rapid urban population growth is widening year-round demand for fresh and processed vegetables, while climate stress is intensifying the shift toward heat- and drought-resilient varieties. Regional governments are synchronizing certification rules, making it easier for seed companies to scale across borders. Digital agriculture tools are improving last-mile delivery, and protected cultivation projects are multiplying across peri-urban belts, creating premium seed niches. At the same time, weak intellectual-property enforcement and smallholder price sensitivity continue to inhibit the formal commercial seed segment.[1]Source: Food and Agriculture Organization, “Seeds,” FAO, fao.org
Key Report Takeaways
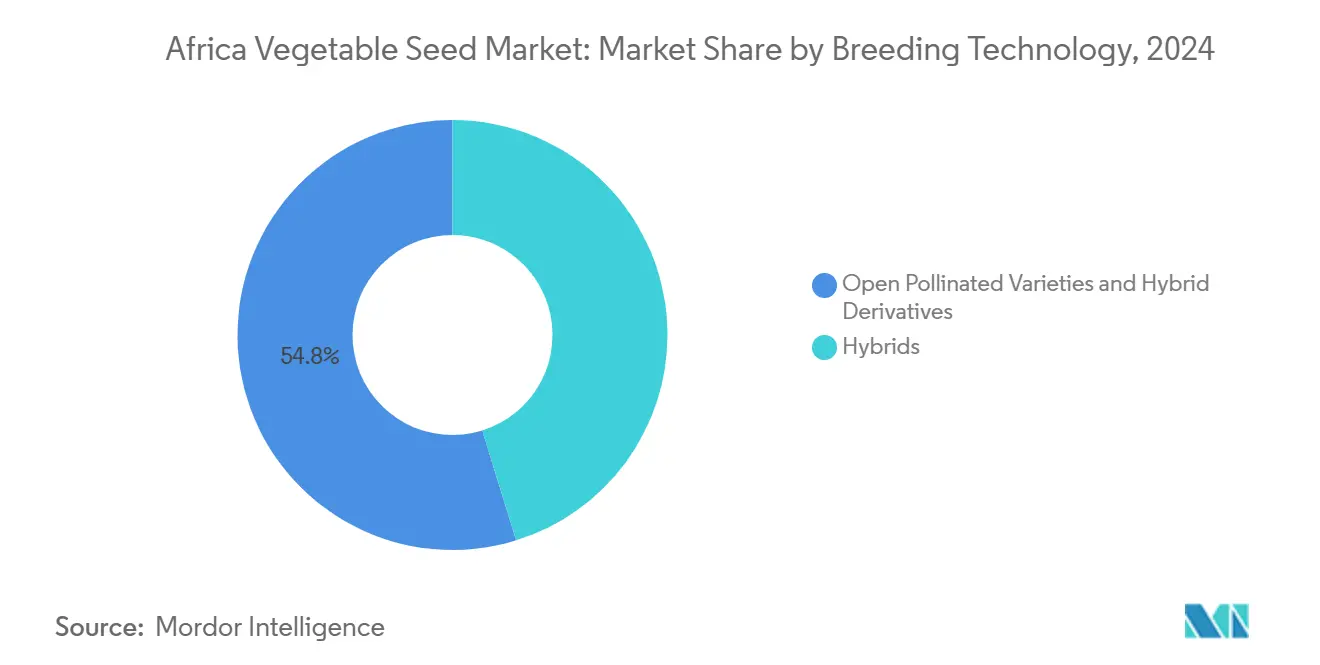
- By breeding technology, open-pollinated varieties and hybrid derivatives led with 54.8% of the Africa vegetable seed market share in 2024, while hybrids are anticipated to grow at a CAGR of 5.90% through 2030.
- By cultivation mechanism, open field accounted for 99.9% of the market share in 2024, while protected cultivation is projected to expand at a 7.84% CAGR through 2030, outpacing open-field systems.
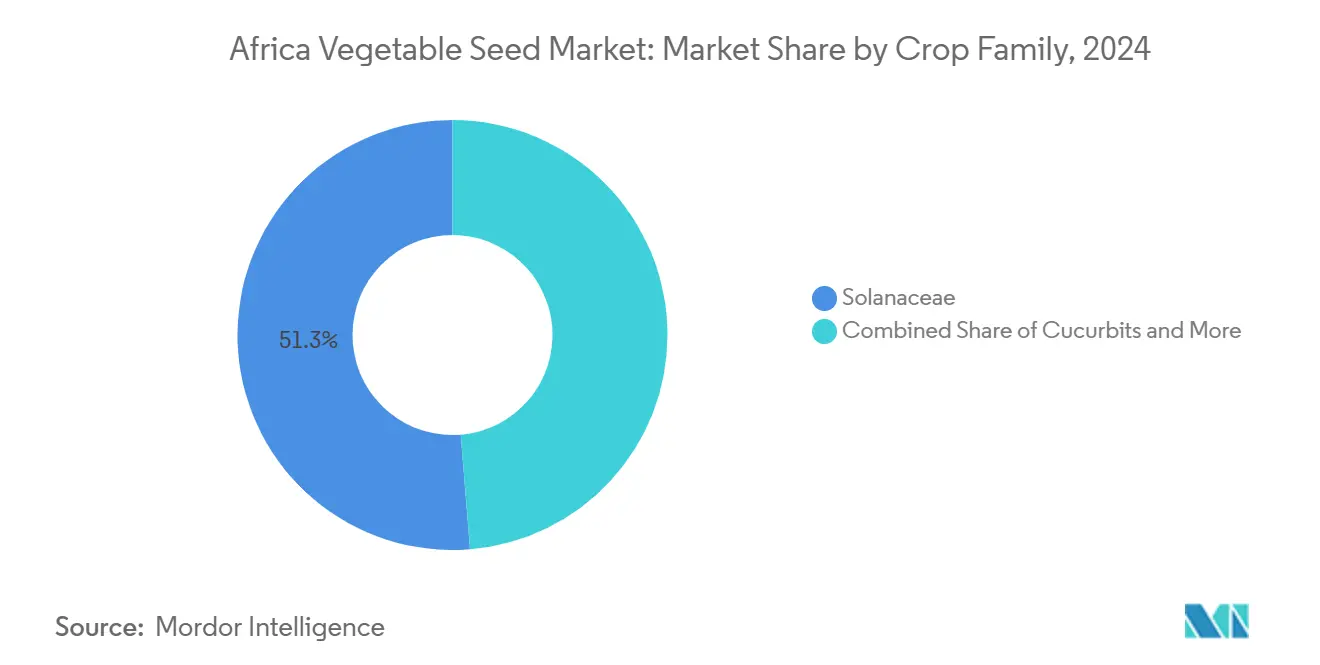
- By crop family, Solanaceae accounted for 51.3% of the Africa vegetable seed market size in 2024 and are projected to grow at a CAGR of 6.32% through 2030.
- By geography, Nigeria held 60.9% of the Africa vegetable seed market size in 2024 and is projected to grow at a CAGR of 6.02% through 2030.
Africa Vegetable Seed Market Trends and Insights
Drivers Impact Analysis*
| Driver | (~) % Impact on CAGR Forecast | Geographic Relevance | Impact Timeline |
|---|---|---|---|
| Expansion of climate-resilient hybrid varieties | +1.8% | Kenya, Nigeria, and Ethiopia | Medium term (2-4 years) |
| Rising adoption of protected cultivation systems | +1.2% | North Africa, South Africa, and West African cities | Long term (≥ 4 years) |
| Government seed-subsidy and certification reforms | +1.0% | Nigeria, Kenya, Ghana, and Tanzania | Medium term (2-4 years) |
| Growth of regional seed hubs and out-grower schemes | +0.8% | East Africa and Southern Africa corridors | Long term (≥ 4 years) |
| Urban demand for nutrient-dense vegetables | +0.6% | Lagos, Nairobi, Cairo, and Johannesburg | Short term (≤ 2 years) |
| Digital agriculture marketplaces and cold-chain expansion | +0.4% | Kenya, Nigeria, South Africa, and Ghana | Medium term (2-4 years) |
| Source: Mordor Intelligence | |||
Expansion of Climate-Resilient Hybrid Varieties
Climate adaptation is reshaping the Africa vegetable seed market as drought-tolerant and heat-resistant hybrids help farmers tackle erratic rainfall and rising temperatures. The Consultative Group on International Agricultural Research HarvestPlus program has released biofortified lines that hold nutritional density under stress, while private breeders emphasize short growing cycles that fit shorter rainy seasons.[2]Source: Consultative Group on International Agricultural Research, “HarvestPlus Program Highlights,” CGIAR, cgiar.org The Kenya Agricultural and Livestock Research Organization observed that climate-smart tomato hybrids jumped from 18% to 35% of hybrid seed sales between 2022 and 2025, signaling fast uptake.[3]Source: Kenya Agricultural and Livestock Research Organization, “Climate-Smart Vegetable Varieties Adoption,” KALRO, kalro.org These seeds attract premium prices yet provide 25–40% higher yields under stress, making the business case compelling for commercial producers. The Common Market for Eastern and Southern Africa streamlined variety registration to 18–24 months, down from four years, accelerating market entry for new hybrids. As more seed companies align portfolios with agroecological stress profiles, hybrid penetration is widening beyond high-income commercial farms.
Rising Adoption of Protected Cultivation Systems
Protected cultivation is the fastest-growing production method within the Africa vegetable seed market, buoyed by water scarcity, volatile weather, and surging urban demand. South Africa already maintains over 2,500 hectares of greenhouse vegetable sites, while Kenya’s floriculture expertise is being redeployed into greenhouse tomatoes, peppers, and cucumbers. In northern Nigeria, the protected area expanded threefold after 2023 as federal irrigation spending unlocked year-round production capacity. Controlled environments demand tailored seed genetics that thrive under low humidity, diffuse light, and high nutrient solutions, steering seed breeders toward specialized lines. Dutch equipment suppliers report that African projects now represent 15% of their global greenhouse installations versus 3% in 2020, underscoring investor confidence in the segment’s upside.
Government Seed-Subsidy and Certification Reforms
Public input programs are shifting from volume-based distribution to quality-assured seed incentives. Nigeria’s Anchor Borrowers Programme allocated 40% of its USD 2.1 billion input budget to certified vegetable seeds in 2024, up from 15% historically. Ghana’s Planting for Food and Jobs initiative mandates third-party testing for every subsidized batch, raising overall costs by 25% but driving counterfeit seeds out of formal channels. Harmonized seed rules across the Common Market for Eastern and Southern Africa and the East African Community are slashing cross-border variety registration timelines. These moves create robust demand pull for legitimate suppliers while pressuring informal systems that have historically served most smallholders.
Growth of Regional Seed Hubs and Out-Grower Schemes
Regional seed multiplication hubs in Kenya’s Rift Valley and South Africa’s Free State are strengthening supply chain resilience. East-West Seed’s facility in Kenya now produces 60% of the firm’s African volumes, shrinking import lead times and buffering currency volatility. Contract out-grower schemes tie smallholders into the formal seed value chain, guaranteeing purchase prices in exchange for strict quality protocols. The African Development Bank's Enable Youth program helped launch fifteen new partnerships in 2024 that train young farmers as certified seed producers. Although capital-intensive, hubs and out-grower models distribute value more evenly across the supply chain and anchor job creation.
Restraints Impact Analysis*
| Restraint | (~) % Impact on CAGR Forecast | Geographic Relevance | Impact Timeline |
|---|---|---|---|
| Weak intellectual-property enforcement fueling counterfeit seeds | -1.4% | Nigeria, Ghana, and Tanzania | Short term (≤ 2 years) |
| Smallholder price sensitivity to premium seeds | -1.1% | Rural Sub-Saharan Africa | Long term (≥ 4 years) |
| Post-harvest gaps lowering return on investment on quality seeds | -0.9% | West and East Africa | Medium term (2-4 years) |
| Climate-driven pest pressure outpacing breeding programs | -0.6% | Semi-arid and coastal areas | Long term (≥ 4 years) |
| Source: Mordor Intelligence | |||
Weak Intellectual-Property Enforcement Fueling Counterfeit Seeds
Counterfeit vegetable seeds account for an estimated 40% of volumes in some West African corridors, eroding trust in formal channels. Nigeria’s National Agricultural Seed Council seized over 2,000 metric tons of fake seeds in 2024, yet conviction rates remain under 15%. Informal traders import low-grade seeds that look professional but fail germination tests, damaging farmer livelihoods and bleeding breeding program revenues. The Economic Community of West African States is drafting unified penalties, but uneven enforcement constrains progress.
Smallholder Price Sensitivity to Premium Seeds
Hybrid packs cost three to five times the price of farmer-saved seeds, a daunting barrier when two-thirds of smallholder vegetable growers spend under USD 50 a year on purchased inputs. Cash flow gaps near planting time limit uptake of improved genetics despite the yield upside. Seed credit, micro-leasing, and harvest-settled payment plans exist in pilot form but remain below commercial scale. Unless financing models expand, the formal segment will keep missing a large potential customer base.
*Our forecasts treat driver/restraint impacts as directional, not additive. The impact forecasts reflect baseline growth, mix effects, and variable interactions.
Segment Analysis
By Breeding Technology: Traditional Varieties Retain Numerical Lead
Open-pollinated varieties and hybrid derivatives commanded 54.8% of the Africa vegetable seed market in 2024. Smallholders value the low cost and the ability to save seed without yield decline. Hybrids are tracking a 5.90% CAGR, faster than the traditional segment’s 4.8%, underlining a steady pivot to higher productivity systems. Kenya and South Africa already deploy hybrids on 58% and 65% of commercial acreage, respectively, while West Africa remains predominantly traditional owing to tight household budgets and limited extension services. The hybrid segment’s share of the Africa vegetable seed market size is projected to widen further as contract farming and warehouse receipt schemes unlock working capital. Some companies now market hybrid derivatives designed for one season of savings, offering a middle path between purity and affordability.
Local public institutes are also releasing improved open-pollinated lines with better disease tolerance and shorter maturity. These lines can yield 15–25% more than farmer-saved seed, narrowing the performance gap. Parallel investments in community seed banks are safeguarding agrobiodiversity while ensuring that improved traits reach remote zones. Over the outlook, hybrids will likely dominate high-value supply chains such as supermarkets, while open-pollinated seeds stay relevant in informal fresh markets.


By Cultivation Mechanism: Protected Systems Drive Innovation Despite Limited Scale
Open-field farming still captures 99.9% of planted area, reflecting the subsistence nature of African smallholder agriculture. Even so, protected cultivation is adding area at a 7.84% CAGR and reshaping seed demand in peri-urban districts. Greenhouse projects in Kenya exceed 1,200 hectares, fueled by floriculture know-how and proximity to export logistics. Northern Nigeria’s greenhouse boom concentrates in tomato belts supplying Lagos and Abuja during dry months.
Premium prices for greenhouse-specific seed offset a smaller area, encouraging breeders such as Rijk Zwaan to introduce parthenocarpic cucumbers and high-density pepper varieties. Open-field programs are simultaneously targeting traits like virus resistance to protect mass-market farmers against climate-linked disease flare-ups.
By Crop Family: Solanaceae Dominance Mirrors Urban Tastes
Solanaceae captured 51.3% of Africa's vegetable seed market share in 2024 and is anticipated to grow at a CAGR of 6.32%, propelled by tomatoes, peppers, and eggplants. Urbanization is fueling demand for tomato puree, pepper sauces, and ready-to-cook packs, which rely on uniform fruit size and color. Tomato hybrid adoption is gaining pace in Central and East Africa, where processing plants guarantee off-take. Brassicas rank second, thriving in cooler highland microclimates in Ethiopia and Kenya.
Onions anchor the roots and bulbs category, driven by Nigeria’s consumption surge and cross-border trade to Niger and Benin. Cucurbits have become mainstream in West Africa diets, where pumpkin, squash, and watermelon are household staples. Unclassified leafy greens, including spinach and lettuce, are registering double-digit growth in coastal cities as health awareness and refrigeration improve. Breeding priorities differ by family, ranging from heat tolerance in peppers to shelf-life extension in leafy greens.
Geography Analysis
Nigeria commanded 60.9% of the Africa vegetable seed market in 2024, reflecting a vast population, diverse climates, and heavy private investment in mid-stream processing. Lagos alone drives nearly 15% of national seed demand due to its 23 million consumers and booming hospitality sector. Nigeria’s market is expanding at 6.02% CAGR on the back of subsidy realignment, irrigation projects, and the rise of commercial clusters around Kano. The Common Market for Eastern and Southern Africa harmonization allows domestic seed firms to explore exports, unlocking fresh foreign-currency income.
South Africa ranks second at about a 15% share. Its sophisticated cold-chain, contract farming, and retail standards drive higher hybrid penetration and a premium seed blend. Protected cultivation acreage is largest in the Western Cape, where winter daytime highs suit greenhouse technology and export shipping lanes. Kenya holds a roughly 12% share, leveraging fertile highlands and established floriculture infrastructure for seed production. The country hosts multiple multinational breeding stations, which shorten delivery cycles for regional clients.
Ethiopia is the fastest grower at 7.1% CAGR as government initiatives target horticulture diversification. New cold-chain corridors link the Rift Valley to Addis Ababa and Djibouti ports, supporting fresh and processed exports. Egypt shows opportunity in North Africa, especially in reclaimed desert mega-greenhouses that rely on salt-tolerant cultivars. Ghana is diversifying away from cocoa toward vegetables for domestic consumption and coastal exports. Tanzania’s horticulture growth, anchored by Arusha’s temperate climate, benefits from new airport cargo capacity. The rest of Africa – including Morocco, Algeria, Uganda, and Senegal – collectively represents a sizable demand pool as retail chains penetrate secondary cities.
Competitive Landscape
The Africa vegetable seed market remains highly fragmented, with the top five suppliers, Syngenta Group, Bayer AG, Rijk Zwaan Zaadteelt en Zaadhandel B.V., Groupe Limagrain, and Bejo Zaden B.V., controlling a significant share of aggregate revenue, which limits pricing power and encourages localized product portfolios. Syngenta Group couples climate-resilient hybrids with its Cropwise digital platform that offers weather alerts, pest diagnostics, and seed recommendations tailored to smallholder plots. Bayer AG integrates its FieldView decision-support software with hybrid tomato and pepper lines, creating data-driven advisory bundles that help farmers fine-tune planting windows and nutrient plans. Rijk Zwaan concentrates on protected-environment genetics and recently opened a seed-conditioning site in South Africa’s Western Cape to shorten delivery times for greenhouse vegetables. Groupe Limagrain is scaling its African footprint through a research station in Kenya’s Nakuru County that screens drought- and disease-tolerant brassicas for highland climates.
Bejo Zaden B.V. leverages a network of demonstration farms in Tanzania and Ethiopia where farmers test onion, carrot, and cabbage varieties under local management practices. These live trials strengthen extension outreach and accelerate adoption in rain-fed systems that dominate smallholder production. Syngenta Group and Bayer AG both pursue public-private partnerships with ministries of agriculture to embed certified seeds in subsidy schemes, broadening market access while reinforcing brand visibility. Rijk Zwaan collaborates with Dutch greenhouse integrators, bundling seeds with turnkey technology packages that appeal to emerging commercial clusters around Lagos and Nairobi. Groupe Limagrain is negotiating licensing deals with national research institutes to co-release improved open-pollinated lines, aiming to balance affordability with genetic gain in marginal areas.
Competitive behavior is marked by targeted acquisitions and joint ventures rather than large-scale mergers, reflecting regulatory complexity and the need for deep local relationships. Bejo Zaden B.V. recently invested in a seed-coating facility near Johannesburg to improve germination uniformity and extend shelf life under warm-chain conditions. Digital extension is another battleground: Syngenta Group’s Cropwise platform surpassed 200,000 registered African users in 2025, while Bayer AG’s FieldView topped 150,000 after its 2024 launch. Rijk Zwaan and Groupe Limagrain focus on in-person field days, arguing that face-to-face agronomy support still drives trust among smallholders. Despite differing tactics, all five companies are expanding breeder trials across semi-arid zones to keep pace with rising temperature and pest pressure, ensuring sustained pipeline relevance for the continent’s diversified agroecologies.
Africa Vegetable Seed Industry Leaders
Syngenta Group
Groupe Limagrain
Bayer AG
Rijk Zwaan Zaadteelt en Zaadhandel B.V.
Bejo Zaden B.V.
- *Disclaimer: Major Players sorted in no particular order


Recent Industry Developments
- September 2025: East-West Seed expanded its African operations by introducing climate-resilient vegetable varieties and supporting smallholder farmers. The company partnered with the World Food Programme in Kenya, established a Knowledge Hub in Tanzania, and conducted farmer training programs in Niger, Nigeria, and Kenya during 2024-2025. East-West Seed also presented its agricultural innovations at the Africa Food Systems Forum 2025 in Senegal.
- September 2025: The World Vegetable Center and African Seed Trade Association are working together through the Africa Vegetable Breeding Consortium to improve vegetable seed systems across Africa. The collaboration focuses on developing resilient crop varieties and improving smallholder farmers' access to high-quality seeds.
- March 2025: Sakata Seed Southern Africa introduced new lettuce varieties: Meridian, Havasu, SV7735, Monterra, Carmim, and Abarquina, specifically developed for African growing conditions. These varieties feature enhanced bolting resistance, disease tolerance, and versatility for fresh market and processing applications.


Africa Vegetable Seed Market Report Scope
Hybrids, Open Pollinated Varieties & Hybrid Derivatives are covered as segments by Breeding Technology. Open Field, Protected Cultivation are covered as segments by Cultivation Mechanism. Brassicas, Cucurbits, Roots & Bulbs, Solanaceae, Unclassified Vegetables are covered as segments by Crop Family. Egypt, Ethiopia, Ghana, Kenya, Nigeria, South Africa, Tanzania are covered as segments by Country.Breeding Technology
| Hybrids |
| Open Pollinated Varieties and Hybrid Derivatives |
Cultivation Mechanism
| Open Field |
| Protected Cultivation |
Crop Family
| Brassicas | Cabbage |
| Cauliflower and Broccoli | |
| Other Brassicas | |
| Cucurbits | Cucumber and Gherkin |
| Pumpkin and Squash | |
| Other Cucurbits | |
| Roots and Bulbs | Garlic |
| Onion | |
| Potato | |
| Other Roots and Bulbs | |
| Solanaceae | Chilli |
| Eggplant | |
| Tomato | |
| Other Solanaceae | |
| Unclassified Vegetables | Asparagus |
| Lettuce | |
| Okra | |
| Peas | |
| Spinach | |
| Other Unclassified Vegetables |
Geography
| Egypt |
| Ethiopia |
| Ghana |
| Kenya |
| Nigeria |
| South Africa |
| Tanzania |
| Rest of Africa |
| Breeding Technology | Hybrids | |
| Open Pollinated Varieties and Hybrid Derivatives | ||
| Cultivation Mechanism | Open Field | |
| Protected Cultivation | ||
| Crop Family | Brassicas | Cabbage |
| Cauliflower and Broccoli | ||
| Other Brassicas | ||
| Cucurbits | Cucumber and Gherkin | |
| Pumpkin and Squash | ||
| Other Cucurbits | ||
| Roots and Bulbs | Garlic | |
| Onion | ||
| Potato | ||
| Other Roots and Bulbs | ||
| Solanaceae | Chilli | |
| Eggplant | ||
| Tomato | ||
| Other Solanaceae | ||
| Unclassified Vegetables | Asparagus | |
| Lettuce | ||
| Okra | ||
| Peas | ||
| Spinach | ||
| Other Unclassified Vegetables | ||
| Geography | Egypt | |
| Ethiopia | ||
| Ghana | ||
| Kenya | ||
| Nigeria | ||
| South Africa | ||
| Tanzania | ||
| Rest of Africa | ||


Market Definition
- Commercial Seed - For the purpose of this study, only commercial seeds have been included as part of the scope. Farm-saved Seeds, which are not commercially labeled are excluded from scope, even though a minor percentage of farm-saved seeds are exchanged commercially among farmers. The scope also excludes vegetatively reproduced crops and plant parts, which may be commercially sold in the market.
- Crop Acreage - While calculating the acreage under different crops, the Gross Cropped Area has been considered. Also known as Area Harvested, according to the Food & Agricultural Organization (FAO), this includes the total area cultivated under a particular crop across seasons.
- Seed Replacement Rate - Seed Replacement Rate is the percentage of area sown out of the total area of crop planted in the season by using certified/quality seeds other than the farm-saved seed.
- Protected Cultivation - The report defines protected cultivation as the process of growing crops in a controlled environment. This includes greenhouses, glasshouses, hydroponics, aeroponics, or any other cultivation system that protects the crop against any abiotic stress. However, cultivation in an open field using plastic mulch is excluded from this definition and is included under open field.
| Keyword | Definition |
|---|---|
| Row Crops | These are usually the field crops which include the different crop categories like grains & cereals, oilseeds, fiber crops like cotton, pulses, and forage crops. |
| Solanaceae | These are the family of flowering plants which includes tomato, chili, eggplants, and other crops. |
| Cucurbits | It represents a gourd family consisting of about 965 species in around 95 genera. The major crops considered for this study include Cucumber & Gherkin, Pumpkin and squash, and other crops. |
| Brassicas | It is a genus of plants in the cabbage and mustard family. It includes crops such as carrots, cabbage, cauliflower & broccoli. |
| Roots & Bulbs | The roots and bulbs segment includes onion, garlic, potato, and other crops. |
| Unclassified Vegetables | This segment in the report includes the crops which don’t belong to any of the above-mentioned categories. These include crops such as okra, asparagus, lettuce, peas, spinach, and others. |
| Hybrid Seed | It is the first generation of the seed produced by controlling cross-pollination and by combining two or more varieties, or species. |
| Transgenic Seed | It is a seed that is genetically modified to contain certain desirable input and/or output traits. |
| Non-Transgenic Seed | The seed produced through cross-pollination without any genetic modification. |
| Open-Pollinated Varieties & Hybrid Derivatives | Open-pollinated varieties produce seeds true to type as they cross-pollinate only with other plants of the same variety. |
| Other Solanaceae | The crops considered under other Solanaceae include bell peppers and other different peppers based on the locality of the respective countries. |
| Other Brassicaceae | The crops considered under other brassicas include radishes, turnips, Brussels sprouts, and kale. |
| Other Roots & Bulbs | The crops considered under other roots & bulbs include Sweet Potatoes and cassava. |
| Other Cucurbits | The crops considered under other cucurbits include gourds (bottle gourd, bitter gourd, ridge gourd, Snake gourd, and others). |
| Other Grains & Cereals | The crops considered under other grains & cereals include Barley, Buck Wheat, Canary Seed, Triticale, Oats, Millets, and Rye. |
| Other Fibre Crops | The crops considered under other fibers include Hemp, Jute, Agave fibers, Flax, Kenaf, Ramie, Abaca, Sisal, and Kapok. |
| Other Oilseeds | The crops considered under other oilseeds include Ground nut, Hempseed, Mustard seed, Castor seeds, safflower seeds, Sesame seeds, and Linseeds. |
| Other Forage Crops | The crops considered under other forages include Napier grass, Oat grass, White clover, Ryegrass, and Timothy. Other forage crops were considered based on the locality of the respective countries. |
| Pulses | Pigeon peas, Lentils, Broad and horse beans, Vetches, Chickpeas, Cowpeas, Lupins, and Bambara beans are the crops considered under pulses. |
| Other Unclassified Vegetables | The crops considered under other unclassified vegetables include Artichokes, Cassava Leaves, Leeks, Chicory, and String beans. |


Research Methodology
Mordor Intelligence follows a four-step methodology in all our reports.
- Step-1: IDENTIFY KEY VARIABLES: In order to build a robust forecasting methodology, the variables and factors identified in Step-1 are tested against available historical market numbers. Through an iterative process, the variables required for market forecast are set and the model is built on the basis of these variables.
- Step-2: Build a Market Model: Market-size estimations for the forecast years are in nominal terms. Inflation is not a part of the pricing, and the average selling price (ASP) is kept constant throughout the forecast period.
- Step-3: Validate and Finalize: In this important step, all market numbers, variables and analyst calls are validated through an extensive network of primary research experts from the market studied. The respondents are selected across levels and functions to generate a holistic picture of the market studied.
- Step-4: Research Outputs: Syndicated Reports, Custom Consulting Assignments, Databases, and Subscription Platforms


