
Market Overview
| Study Period | 2021 - 2031 |
|---|---|
| Market Size (2026) | USD 7 Billion |
| Market Size (2031) | USD 8.92 Billion |
| Growth Rate (2026 - 2031) | 4.97 % |
| Fastest Growing Market | Asia Pacific |
| Largest Market | North America |
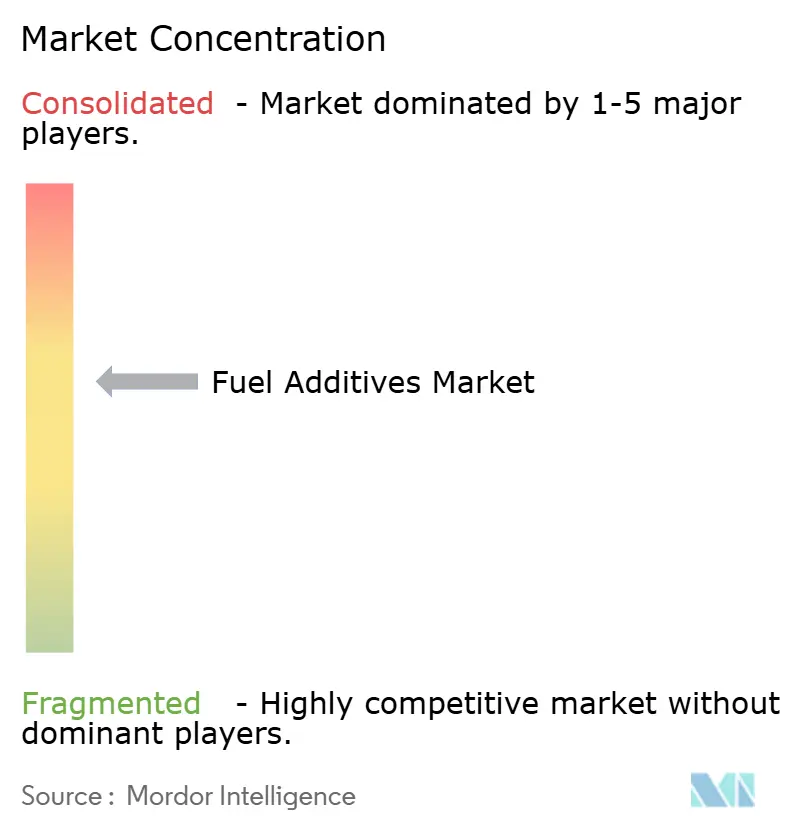
| Market Concentration | Medium |
Major Players *Disclaimer: Major Players sorted in no particular order Image © Mordor Intelligence. Reuse requires attribution under CC BY 4.0. | |
Fuel Additives Market Analysis by Mordor Intelligence
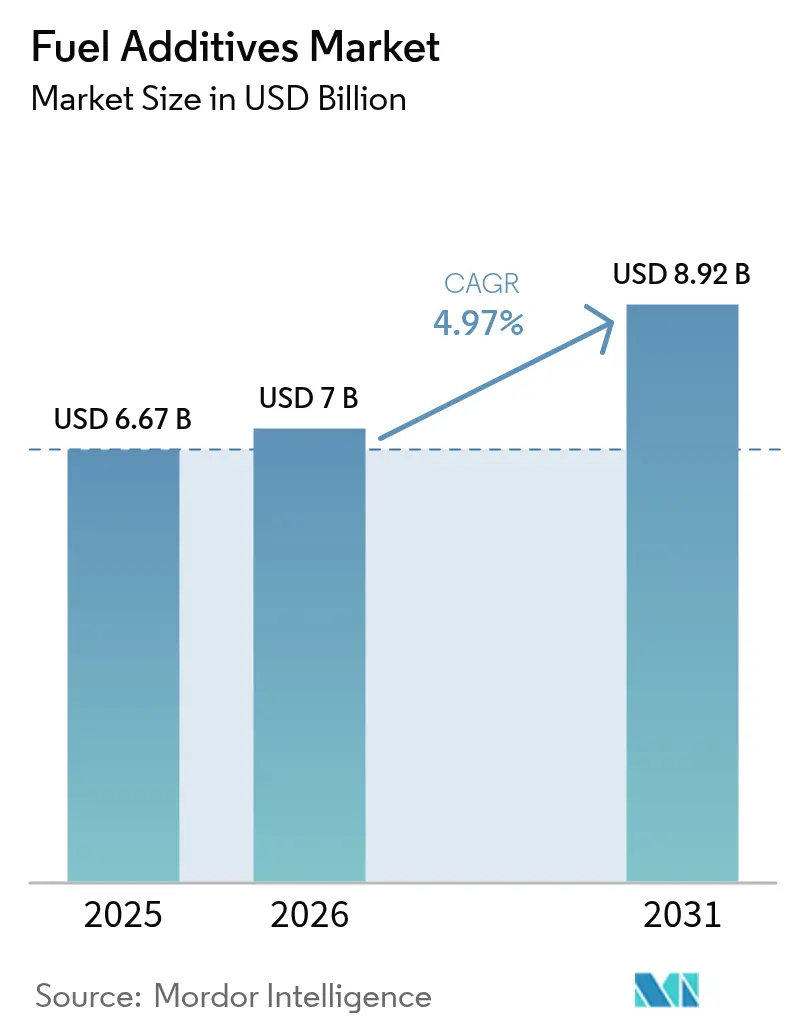
The Fuel Additives Market size is projected to be USD 6.67 billion in 2025, USD 7 billion in 2026, and reach USD 8.92 billion by 2031, growing at a CAGR of 4.97% from 2026 to 2031. A tightening web of emission norms across road, marine, and aviation channels is lifting treat rates for detergents, lubricity improvers, and cold-flow modifiers as refiners wrestle with heavier, higher-sulfur crude slates. Engine design shifts—especially gasoline direct-injection (GDI) and common-rail diesel—are reshaping the additive mix toward combustion-chamber deposit control, while the International Maritime Organization’s sulfur rule continues to anchor demand for very-low-sulfur fuel oil (VLSFO) stabilizers. Refinery configuration upgrades in India and China, mandated under Bharat Stage VI and China VI standards, are widening the addressable base for cetane and lubricity chemistries. At the same time, sustainable aviation fuel (SAF) adoption is opening a premium niche for antioxidants and metal deactivators that preserve jet-fuel stability at higher blend ratios.
Key Report Takeaways
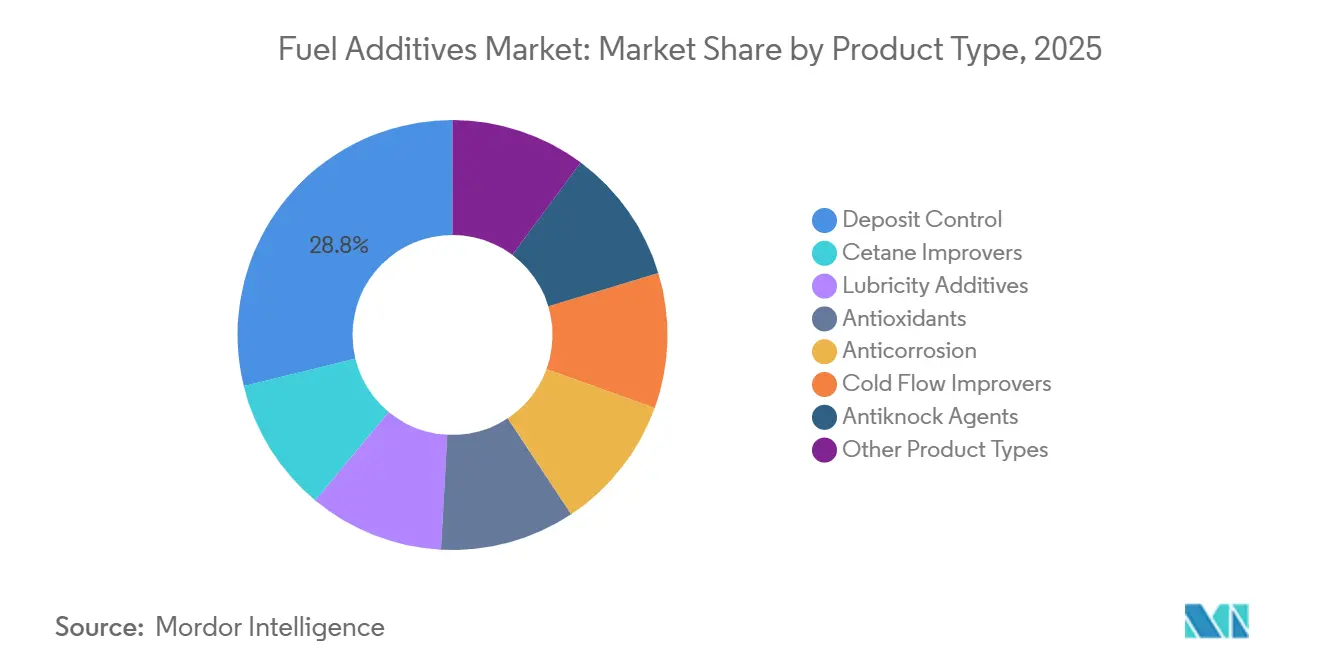
- By product type, deposit control additives held 28.81% of the fuel additives market share in 2025; cold flow improvers are projected to post the fastest 5.51% CAGR through 2031.
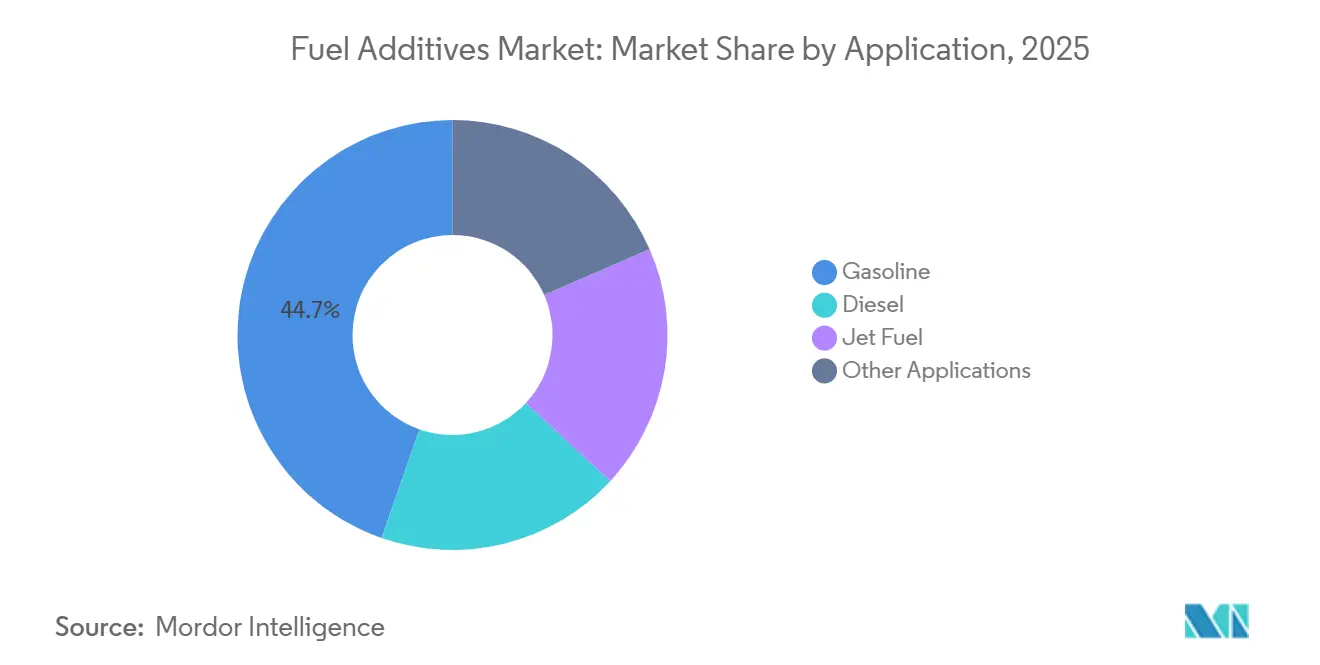
- By application, gasoline accounted for 44.65% of the fuel additives market size in 2025, while diesel applications are advancing at a 5.12% CAGR to 2031.
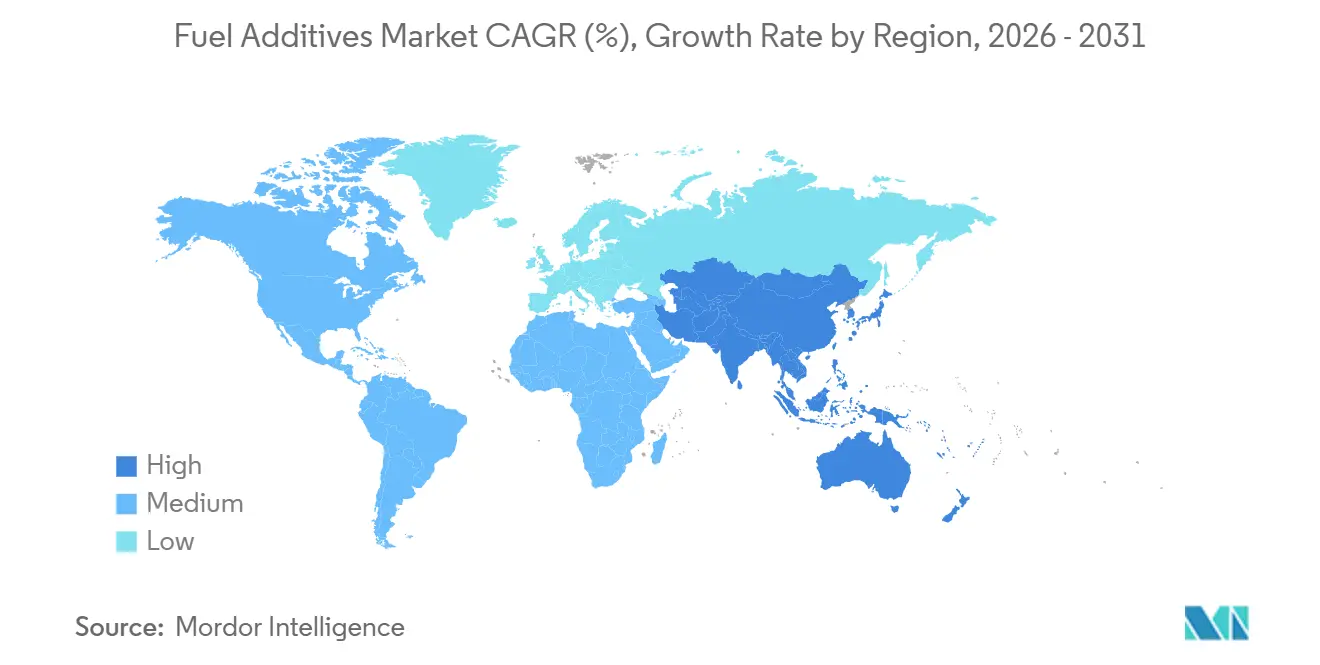
- By geography, North America led with 35.57% revenue share in 2025; Asia-Pacific registers the highest 5.56% CAGR through 2031.
Note: Market size and forecast figures in this report are generated using Mordor Intelligence’s proprietary estimation framework, updated with the latest available data and insights as of 2026.
Market Trends and Insights
Drivers Impact Analysis of Fuel Additives Market*
| Drivers | (~) % Impact on CAGR Forecast | Geographic Relevance | Impact Timeline |
|---|---|---|---|
| Enactment of stringent environmental regulations | +1.4% | Global, with peak enforcement in EU, North America, and China | Medium term (2-4 years) |
| Degrading crude-oil quality raising deposit issues | +1.1% | Global, concentrated in regions processing heavy-sour crudes (Middle East, Latin America) | Long term (≥ 4 years) |
| Tight ULSD specifications in emerging economies | +0.9% | Asia-Pacific core (India, China), spill-over to Southeast Asia | Short term (≤ 2 years) |
| Rising global aviation traffic and jet-fuel demand | +0.7% | Global, with outsized gains in Asia-Pacific and Middle East hubs | Medium term (2-4 years) |
| Surge in demand for VLSFO post-IMO 2020 (marine) | +0.6% | Global maritime routes, concentrated in major bunkering ports (Singapore, Rotterdam, Houston) | Short term (≤ 2 years) |
| Source: Mordor Intelligence | |||
Enactment Of Stringent Environmental Regulations
Implementation of Euro VI in the European Union, Tier 3 gasoline sulfur rules in the United States, and full enforcement of China VI have synchronized global sulfur ceilings at 10 ppm, lowering natural lubricity and driving compulsory dosing of detergents, cetane boosters, and combustion modifiers[1]European Commission, “Vehicle Emission Standards,” ec.europa.eu. Parallel voluntary programs such as the North American “Top Tier” gasoline certification further lift baseline treat rates for deposit control in branded retail fuels. Automakers reference these standards in warranty language, effectively converting a voluntary label into a quasi-mandatory benchmark. Collectively, these converging regulations underpin a structural rise in additive intensity across every liter of finished fuel. They also accelerate product-development cycles for multifunctional packages capable of meeting sulfur, particulate, and octane needs simultaneously.
Degrading Crude-Oil Quality Raising Deposit Issues
Global production is skewing toward heavier, high-metal crude streams from Canadian oil sands and Venezuelan extra-heavy grades, which introduce vanadium and nickel that catalyze high-temperature deposit formation[2]Society of Petroleum Engineers, “Quality Challenges of Heavy-Sour Crudes,” spe.org . Refiners facing these slates often hydrotreat more aggressively, stripping trace lubricants and aromatics and raising downstream reliance on cold-flow and lubricity improvers. In storage, unstable asphaltenes precipitate sludge unless dispersants are present, lengthening the additive value chain from refinery gate to retail rack. Importantly, refiners in Asia-Pacific are blending discounted Russian Urals barrels, resulting in diesel cuts with elevated wax content and poor low-temperature operability, an issue corrected only by higher pour-point-depressant treat rates.
Tight ULSD Specifications In Emerging Economies
India’s Bharat Stage VI and China’s domestic ULSD rollout reduced sulfur in less than five years, stripping natural lubricity and necessitating fatty-acid-ester or synthetic lubricity improvers across the entire highway diesel pool. Regional refiners have installed centralized additive injection manifolds that batch-dose entire cargos before pipeline transfer, guaranteeing uniform treat rates nationwide. Neighboring Thailand, Indonesia, and Vietnam are slated to follow with Euro IV-equivalent caps by 2028, creating sequential demand spikes for cetane and lubricity packages. The net effect is a multi-speed market where premium urban fuels carry complex additive blends, while rural grades remain minimally treated.
Rising Global Aviation Traffic And Jet-Fuel Demand
By late 2024, passenger volumes will have surpassed pre-pandemic levels. This surge is not only increasing jet fuel consumption but also prompting airlines to extend storage intervals as a hedge against price fluctuations. These extended dwell times heighten the need for oxidation and thermal stability, leading to a routine adoption of hindered-phenolic antioxidants and metal deactivators. At the same time, while SAF blends boast varied aromatic profiles, they pose risks to seal-swell properties. This challenge is now addressed by tailored additive packages. Aircraft like the Boeing 787, designed for high-altitude, long-range flights, are pushing fuel systems nearer to icing thresholds. To counteract potential ice crystal formation, there's an uptick in demand for diethylene glycol monomethyl ether (DiEGME).
Restraints Impact Analysis of Fuel Additives Market*
| Restraint | (~) % Impact on CAGR Forecast | Geographic Relevance | Impact Timeline |
|---|---|---|---|
| High research and development costs for multifunctional additive packages | -0.8% | Global, concentrated in North America and Europe where OEM validation cycles are longest | Long term (≥ 4 years) |
| Metal-containing additive bans (e.g., MMT limits) | -0.5% | North America, EU, with gradual adoption in Asia-Pacific | Medium term (2-4 years) |
| Advanced engine efficiencies reducing fuel-bound detergency needs | -0.4% | Global, with peak impact in North America, Europe, and Japan where GDI and common-rail penetration is highest | Medium term (2-4 years) |
| Source: Mordor Intelligence | |||
High Research And Development Costs For Multifunctional Additive Packages
Developing a multifunctional fluid that reduces deposits, enhances cetane levels, boosts lubricity, and decreases pour point demands a lengthy and costly process, effectively sidelining smaller specialty firms. Major OEM protocols, like GM's dexos and Ford's WSS-M2C936-A, mandate rigorous aging tests, extending timelines and inflating budgets. These heightened expenses translate to elevated product prices, curtailing market penetration in price-sensitive areas, despite evident performance benefits. Established players, leveraging global volumes, spread these costs, creating a significant barrier for new entrants. This dynamic not only fosters industry mergers but also intensifies the concentration of intellectual property.
Metal-Containing Additive Bans (e.g., MMT Limits)
Regulators have labeled methylcyclopentadienyl manganese tricarbonyl (MMT) and its counterparts as catalyst poisons. The U.S. Environmental Protection Agency has set a cap on manganese content, California has imposed a complete ban, and the European Union has designated MMT as a Substance of Very High Concern under its REACH regulations. While Asia and Latin America are still catching up, multinational refiners are increasingly adopting global exclusion lists. This move is streamlining logistics and diminishing the demand for metal-bearing antiknock agents. Substitutes like aromatic amines and ferrocene derivatives, while available, provide a lower octane uplift. This shortfall impacts the margin economics for high-RVP gasoline pools. Furthermore, this transition is steering refiners towards more capital-intensive octane processes, such as isomerization and alkylation, which in turn is putting pressure on the market share of fuel additives, especially octane boosters.
*Our forecasts treat driver/restraint impacts as directional, not additive. The impact forecasts reflect baseline growth, mix effects, and variable interactions.
Fuel Additives Market Segment Analysis
By Product Type:
Deposit Control Maintains Lead, Cold-Flow Improvers AccelerateIn 2025, deposit-control chemistries accounted for 28.81% of the revenue, driven by the growing GDI fleet that intensifies combustion residues on injector tips. While pricier, polyether amine (PEA) detergents lead the premium gasoline sector due to their resilience at elevated combustion temperatures and their ability to maintain particulate counts within Euro VI standards. This dominance is evident, with a treat rate integrated into every liter of premium unleaded fuel, highlighting the pivotal role these additives play in the fuel additives landscape.
Cold-flow improvers, despite their smaller sales volume, are projected to grow at a 5.51% CAGR through 2031. This growth is fueled by unconventional shale and oil-sands crudes, introducing elevated wax content into diesel pools. Ethylene-vinyl-acetate copolymers and polymethacrylates modify wax-crystal structure, reducing the cloud point by 5-10 °C and ensuring filterability even in arctic conditions. With Europe and Canada enforcing CFPP thresholds below -20 °C, these additives have become essential. The market's expansion—driven by mature detergents and rapidly growing cold-flow modifiers—highlights the diverse volume and value dynamics at play.
Cetane improvers, chiefly 2-ethylhexyl nitrate (2-EHN), enhance ignition quality in ULSD pools stripped via hydrotreating, boosting cetane numbers with a specific dose. Lubricity additives, whether fatty-acid methyl esters or synthetic variants, are crucial for every 10 ppm sulfur diesel batch, ensuring HFRR wear scars remain within acceptable limits as per ISO 12156-1. This necessity establishes a foundational demand, capturing a significant portion of the fuel additives market. Additionally, antioxidants, anticorrosion agents, antiknock compounds, demulsifiers, and biocides cater to specialized needs, from strategic petroleum reserves to biodiesel blends, creating a balanced portfolio that merges commodity scale with niche margins.



By Application:
Gasoline Still Commands Volume, Diesel Paces GrowthGasoline retained 44.65% of 2025 revenue, buoyed by the global light-duty fleet and the widespread adoption of "Top Tier" detergent standards in North America. By maintaining treat rates for PEA detergents at appropriate levels, automakers can keep valve deposits within warranty thresholds, underscoring the significance of certification labels in driving additive consumption.
Diesel is forecast to post a 5.12% CAGR to 2031, outpacing gasoline because of slower electrification in heavy-duty transport, especially across Asia-Pacific corridors. A fully compliant ULSD package, especially during northern hemisphere winters, incorporates cetane, lubricity, detergency, and cold-flow chemistries into a single dose. Such a concentrated additive approach not only boosts volumetric growth but also translates into significant revenue increases, solidifying diesel's pivotal role in the fuel additives market's expansion through 2031.
While jet fuel accounts for a smaller share of total additive consumption, it's witnessing the fastest growth rate. This surge is driven by airlines not only rebuilding their route networks but also integrating SAF blends. Packages that meld metal deactivators, antioxidants, and static dissipators are essential. They guard against gum formation and filter plugging during extended storage, a necessity heightened by SAF's unique chemical profile in contrast to traditional kerosene. Other applications include marine, heating oil, and fuels for industrial boilers. Notably, the marine sector's VLSFO segment now consistently requires significant levels of additives to prevent sludge formation during extended journeys. This demand secures a reliable revenue stream post-IMO, even as the overall bunker tonnage stabilizes.
Geography Analysis
North America Fuel Additives Market
In 2025, North America captured a 35.57% share of the revenue, bolstered by stringent detergent-centric gasoline standards, high penetration of Gasoline Direct Injection (GDI) in new light-vehicle sales, and its status as the globe's busiest aviation kerosene market. In Canada, frigid winter temperatures elevate cold-flow treat rates in diesel pools. Meanwhile, the U.S. boasts a unique consumption boost for static dissipators and icing inhibitors, thanks to its general-aviation fleet. Mexico, highlighted by the commissioning of the Dos Bocas complex in 2024, is modernizing its refineries. This modernization introduces Ultra-Low Sulfur Diesel (ULSD) and 10 ppm gasoline nationwide, subsequently driving up the initial demand for cetane and lubricity packages.
APAC Fuel Additives Market
Asia-Pacific is projected to be the fastest-growing region at a 5.56% CAGR to 2031. India's Bharat Stage VI initiative mandates a 10 ppm sulfur limit on every liter of on-road diesel, unveiling a multi-billion-liter market for lubricity chemistry. By mid-2023, China mirrored this initiative, with Sinopec and PetroChina establishing additive injection manifolds capable of dosing road fuels. Southeast Asian countries, aiming for Euro IV-equivalent fuel adoption by 2028, are poised for significant surges in cetane and cold-flow demand, especially in Thailand, Indonesia, and Vietnam. Meanwhile, mature markets like Japan and South Korea are focusing on premium additive packs designed for hybrid vehicles. These vehicles, with engines that intermittently run, have heightened oxidation-stability needs during prolonged idle times.
Europe and South America Fuel Additives Market
While Europe's market growth has stabilized, it remains at the forefront of technological advancements. Under the Renewable Energy Directive, biodiesel mandates in key countries require B10 to B15 blends. This regulation bolsters the demand for antioxidant and stability chemistries, essential for curbing microbial growth and preventing oxidative thickening. Germany and France are testing E20 gasoline, necessitating corrosion inhibitors to protect zinc and brass components in older vehicle fleets. In South America, Brazil is set to elevate its biodiesel blend from B12 to B15 by 2026, expanding the market for oxidative-stability solutions. Concurrently, Argentina's Vaca Muerta shale expansion is producing light-sweet barrels. However, these barrels require cold-flow modifications when exported to the high-altitude markets of Chile.
MEA Fuel Additives Market
The outlook for the Middle East and Africa is divided. While refiners in the Gulf Cooperation Council (GCC) are already producing high-quality, low-sulfur fuels with minimal additives, importers in sub-Saharan regions often receive off-spec gasoline and diesel. These fuels, susceptible to microbial contamination in the region's hot and humid storage, create a consistent demand for biocides and antioxidant solutions. Additionally, heavy-sour crudes processed in joint-venture refineries in Saudi Arabia and Kuwait are raising the demand for deposit-control additives in export fuels heading to Asia. This trend underscores the sustained supply linkages for additives, even in areas with more lenient domestic standards.

Regulatory Landscape
Fuel additive manufacture and use are governed by fuel-quality and emissions rules that set practical treat-rate baselines. In the United States, Clean Air Act requirements for fuels and fuel additives (42 U.S.C. 7545) are implemented through EPA regulations in 40 CFR Part 1090, covering product registration and reporting obligations for additive manufacturers. EPA also finalized the Fuels Regulatory Streamlining Amendments Rule in December 2024 to update and correct elements of fuel quality and additive regulations, reinforcing compliance and documentation needs across the supply chain.
Near-term regulatory actions can affect blending practices and the additive mix at the rack. In June 2026, the EPA issued a temporary national fuel waiver to address extreme and unusual fuel supply circumstances, relaxing certain low-volatility gasoline requirements and allowing higher ethanol blending limits, which changes volatility control practices and the associated additive requirements in affected markets. Separately, in July 2026, the EPA proposed amendments affecting Model Year 2027 and later heavy-duty highway engines, including revisions tied to emissions-related warranties and nonconformance penalties, keeping durability and deposit-control performance under scrutiny and influencing how fuel marketers frame detergency and performance packages.
Value Chain Analysis
The fuel additives value chain begins with upstream feedstocks and intermediates, including PIB-based succinimides, alcohols and amines for detergents and dispersants, nitrate chemistries for cetane improvement, and other specialty components. These inputs are then formulated into single-function and multifunctional packages. Production is concentrated in large chemical manufacturing clusters in North America and Western Europe, with a growing footprint in Asia, before bulk logistics moves product to terminals, where additives are injected into finished fuels for distribution through retail networks, commercial fleets, marine bunkering, and aviation supply systems.
Commercialization splits between captive use by integrated oil companies for branded fuels and a merchant market where specialty chemical producers supply refiners, blenders, and terminal operators. Channel access is reinforced through structured partnerships, such as Brenntag Energy Services becoming a designated distributor for BASF Keropur fuel performance additive packages in continental Europe (and select adjacent markets), improving coverage for midstream and downstream customers that do not buy directly from producers. On the demand side, branded programs tighten control from formulation through point-of-sale delivery, exemplified by Chevron rolling out a reformulated next-generation Techron additive across all gasoline grades at U.S. Chevron and Texaco stations.
Competitive Landscape
The fuel additives market is moderately consolidated. Innovation is gravitating toward high-margin niches: SAF antioxidant systems, VLSFO stability packs, and cold-flow modifiers for hydrotreated vegetable oil (HVO) diesel, which gels at higher temperatures than petroleum diesel. Bio-based entrants using lignin-derived antioxidants or algae-sourced lubricity esters pitch lower Scope 3 emissions to oil majors, but they still face scale hurdles and slower OEM validation. Standards bodies such as ASTM, ISO, and the Coordinating European Council (CEC) quietly shape competitive advantage; companies that chair test-method committees often win first-in-class approvals and enjoy multiyear head starts before rivals can certify equivalent products.
Fuel Additives Industry Leaders
The Lubrizol Corporation
AFTON CHEMICAL
Infineum International Limited
BASF
Innospec
- *Disclaimer: Major Players sorted in no particular order
Fuel Additives Market Companies Covered in this Report
- AFTON CHEMICAL
- Baker Hughes Company
- BASF
- Cargill Incorporated
- Chevron Corporation
- Clariant
- Dorf Ketal Chemicals
- Evonik Industries AG
- Exxon Mobil Corporation
- Infineum International Limited
- Innospec
- Lanxess
- The Lubrizol Corporation
- TotalEnergies

Market Opportunities and Future Outlook
Opportunities are emerging where tightening fuel rules, new fuel chemistries, and distribution reconfiguration increase the value of compliant, field-proven additive packages. In the United States, the regulatory framework for fuels and additives under 40 CFR Part 1090 keeps registration and documentation requirements central, favoring suppliers that can support refiners and marketers with compliant formulations and traceable reporting. In Europe, channel expansion is also taking shape, with Brenntag Energy Services designated as a distributor for BASF Keropur fuel performance additive packages across continental Europe and Turkey, highlighting opportunities to improve reach to terminals and support independent blenders that need consistent dosing support and product availability.
The near-term pipeline also includes additive adjacencies linked to emissions control and low-carbon liquid fuels, where new projects change treat needs and procurement patterns. Petrobras selecting Topsoe technology for a major SAF blending component and renewable diesel project at the Boaventura Energy Complex in Itaborai, Brazil (HydroFlex processing of 1,000,000 tons of feedstock annually) points to scaling dynamics for renewable fuels with stability and handling requirements that differ from conventional streams, supporting demand for antioxidants, metal deactivators, and other stability-focused chemistries as blend complexity increases. In parallel, AdvanSix signing a process design and licensing agreement with Stamicarbon to assess expanding its Hopewell, Virginia ammonia platform into domestic diesel exhaust fluid production (a proposed 700 short tons per day unit converting urea melt directly to DEF) signals downstream build-out for emissions-control consumables, which may not be conventional fuel additization but competes for terminal-side customer attention and procurement budgets and can prompt bundling of performance and compliance solutions across diesel value pools.
Recent Industry Developments in Fuel Additives Market
- July 2026: Lubrizol and Tongyi Petrochemical launched Titan King AI low-ash synthetic diesel engine oils, expanding data-driven formulation and positioning around lower-ash performance needs for modern diesel aftertreatment systems. The launch strengthens differentiated product offerings in heavy-duty lubricants and adjacent fuel and engine-fluid ecosystems where deposit and soot control performance is increasingly specified.
- September 2025: BASF announced the Keropur gasoline performance additive series formulated to exceed the U.S. TOP TIER+ detergent standard, with commercial deliveries commencing in the first half of 2026. The introduction raises the competitive bar for deposit-control performance in premium gasolines and supports higher-value additive packages aligned with branded fuel certification programs.
- January 2024: BASF and Lubrizol signed a license agreement for the production and distribution of selected industrial lubricants, effective April 1, 2024, transferring certain BASF EMGARD and Plurasafe products to Lubrizol's CPI Fluid Engineering brand. The agreement reflects portfolio rationalization and channel consolidation, sharpening focus on core additive and fluid-engineering strengths while simplifying product availability for industrial customers.


Fuel Additives Market Report Scope and Research Methodology
Market Definition and Coverage
This market covers the value of chemical additive packages and single additives blended into transportation fuels to improve performance, stability, and compliance, across gasoline, diesel, and aviation fuels. We size demand where additives are commercially supplied into the fuel value chain and priced as additive sales.
Scope exclusions: We exclude finished fuel retail sales and most non-fuel refinery process chemicals that are not sold as fuel additives.
Segments Covered in This Report
- By Product Type
- Deposit Control
- Cetane Improvers
- Lubricity Additives
- Antioxidants
- Anticorrosion
- Cold Flow Improvers
- Antiknock Agents
- Other Product Types
- By Application
- Diesel
- Gasoline
- Jet Fuel
- Other Applications
- By Geography
- Asia-Pacific
- China
- India
- Japan
- South Korea
- Rest of Asia-Pacific
- North America
- United States
- Canada
- Mexico
- Europe
- Germany
- United Kingdom
- France
- Italy
- Rest of Europe
- South America
- Brazil
- Argentina
- Rest of South America
- Middle-East and Africa
- Saudi Arabia
- South Africa
- Rest of Middle-East and Africa
- Asia-Pacific
Data Sources, Market Sizing, and Validation
Desk Research
Desk work starts with mapping the demand pool and the fuel quality rules that govern additive use, because specifications and seasonal requirements often drive when particular chemistries are purchased. Public sources that help here include US Energy Information Administration data and releases, the International Energy Agency, Eurostat, UN Comtrade, and ASTM standards and test-method references.
We then add industry context from company annual reports, investor presentations, technical papers in peer reviewed journals, and trade association websites to understand additive treat rates, fuel mix shifts, and typical price movement. Where needed, paid subscriptions covering company financials and intelligence, news and financials, patent databases, and shipment level trade data are used to cross-check volumes, plant activity, and import-export signals. These examples are not exhaustive, and many other public sources were also used for data collection, validation, and clarification.
Primary Interviews and Surveys
Primary work is used to confirm how additives are purchased and priced across fuel blenders, distributors, and additive suppliers, and to test our assumptions around treat rates and reformulation triggers. Interviews and surveys covered technical and commercial roles across major consuming regions so that secondary signals could be corrected where they did not match on-the-ground blending practice. We also re-contacted experts when a data point moved sharply, for example around specification timing or a sudden change in fuel demand.
Distribution of primary research fieldwork respondents
| Company type | Respondent position | Region |
|---|---|---|
| Top tier: 35% | CXOs: 13% | APAC: 50% |
| Mid tier: 49% | Functional/Unit leaders: 34% | EMEA: 30% |
| Smaller Players: 16% | Managers: 53% | Americas: 20% |
Market-Sizing & Forecasting
Sizing is built using a top-down reconstruction that starts from regional fuel consumption and trade patterns, and then applies additive penetration and average treat-rate ranges by fuel type to reach an addressable additive demand pool. Once the demand pool is formed, average realized pricing is applied using a mix of published chemical pricing signals, fuel specification-driven seasonality, and interview-based checks on typical contract structures.
To keep the model realistic, a selective bottom-up pass is used as a cross-check, where supplier revenue visibility, channel checks, and sampled price-per-ton times estimated tonnage are compared against the top-down totals and adjusted when gaps are repeatedly seen in a region or fuel. Key inputs we track include gasoline and diesel demand by region, jet fuel recovery trends, cold-flow season timing, sulfur and emissions-related specification changes, additive treat-rate shifts tied to engine technology, and the spread between base chemicals that influence additive pricing. Forecasts lean on scenario analysis, where base fuel demand outlooks are combined with expected regulation timing and adoption of higher-performance additive packages, and then the range is narrowed using primary feedback.
Data Validation & Update Cycle
Outputs are triangulated against independent signals such as fuel demand statistics, trade flows for relevant chemical intermediates, and supplier commentary, and then checked for year-to-year jumps that do not match known market events. Variances are reviewed in steps, first at region and fuel level, and then at total market level before sign-off.
The report is refreshed annually, and interim updates are triggered when material events occur, such as a large specification shift, a sharp fuel demand reset, or a sustained pricing swing. Before delivery, we do a final refresh pass so the numbers reflect the latest available public releases and confirmed interview feedback.
Mordor Intelligence's Fuel Additives Market Size Measured Against Other Published Estimates
Published market sizes for fuel additives can look far apart, and the gap is usually not because one math step is wrong, but because the counted item list and the year framing differ. In our checks, scope definitions, fuel coverage, and the way pricing is carried into the base year tend to be the biggest drivers.
Finished fuel retail value sits outside Mordor Intelligence's scope here, which is why estimates that blend additive value into the broader fuel spend can look much larger even when volume assumptions are similar. Differences also show up when a study assumes faster migration to premium additive packages, applies a single global average price without regional mix, or uses older currency and pricing timing that has not been refreshed after a volatility period.
Benchmark comparison
| Source | Market Size | Gaps in Research Methodology |
|---|---|---|
| Mordor Intelligence | USD 7.00 B (2026) | |
| Industry Publisher A | USD 10.29 B (2025) | Higher figure is consistent with a broader value framing and faster premiumization assumptions, and it also uses a different base year which changes the price and volume context. |
| Industry Publisher B | USD 6.71 B (2024) | Lower value aligns with an earlier pricing cycle and a shorter forecast window, and some work in this style relies more on averaged pricing by type rather than region-by-region mix checks. |
Taken together, the spread is mainly explained by what is counted as market value, which base year is used, and how treat-rate and pricing are translated into revenue. By keeping the model tied to fuel demand, specification-linked usage, and repeatable price logic, the estimate stays transparent and easier to update as conditions change.


Key Questions Answered in the Report
How large will global spending on fuel additives be by 2031?
The fuel additives market size is projected to reach USD 8.92 billion by 2031, rising from USD 7.00 billion in 2026, registering a CAGR of 4.97%.
Which additive category holds the highest revenue share today?
Deposit-control additives led with 28.81% of 2025 sales, buoyed by widespread use in gasoline direct-injection engines.
Where is demand for fuel additives expanding fastest?
Asia-Pacific is set to post a 5.56% CAGR through 2031 as India, China, and emerging Southeast Asian nations enforce ultralow-sulfur fuel standards.
Why are cold-flow improvers gaining momentum?
Heavier crude slates and colder operating climates raise diesel wax content, propelling cold-flow improvers at a 5.51% CAGR to 2031.
How are aviation trends influencing additive usage?
Rising passenger traffic and adoption of sustainable aviation fuel are lifting demand for jet-fuel antioxidants, metal deactivators, and icing inhibitors.
Page last updated on:


 Your data is secure and never sold or shared.


