
Market Overview
| Study Period | 2021 - 2031 |
|---|---|
| Forecast Data Period | 2026 - 2031 |
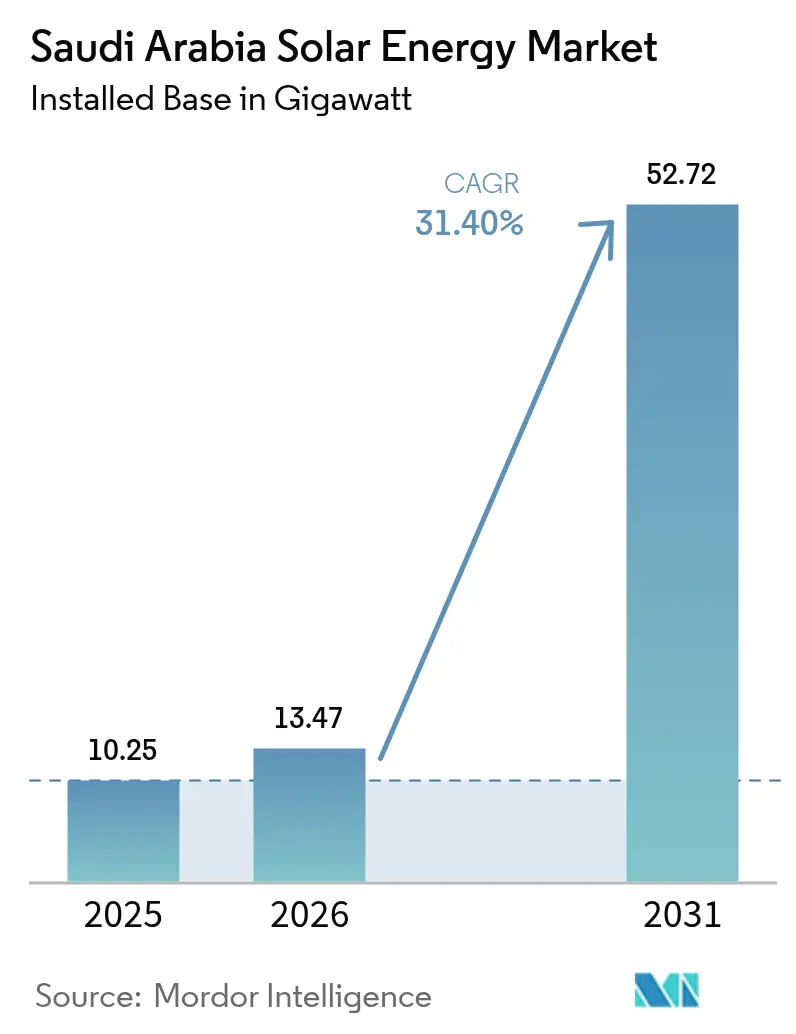
| Base Year Market Size (2025) | 10.25 gigawatt |
| Market Volume (2026) | 13.47 gigawatt |
| Market Volume (2031) | 52.72 gigawatt |
| Growth Rate (2026 - 2031) | 31.40 % |
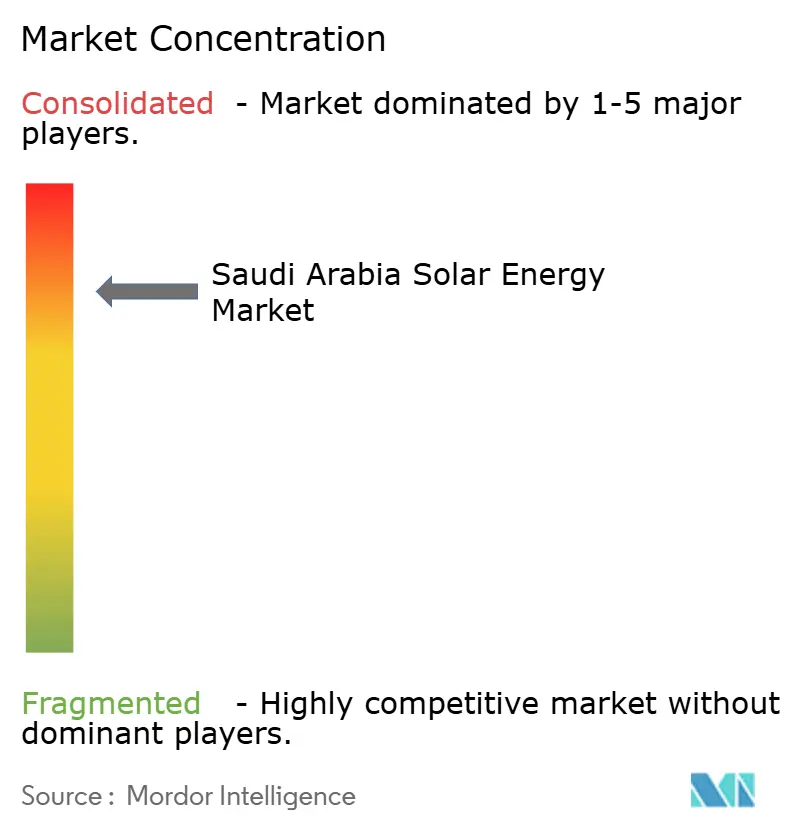
| Market Concentration | High |
Major Players *Disclaimer: Major Players sorted in no particular order Image © Mordor Intelligence. Reuse requires attribution under CC BY 4.0. | |
Saudi Arabia Solar Energy Market Analysis by Mordor Intelligence
Saudi Arabia Solar Energy Market size in 2026 is estimated at 13.47 gigawatt, growing from 2025 value of 10.25 gigawatt with 2031 projections showing 52.72 gigawatt, growing at 31.40% CAGR over 2026-2031.
Demand for clean electricity, Vision 2030 mandates, and record-low auction tariffs keep investor momentum high, while streamlined REPDO tenders slash development risk and financing costs. Utility procurements now embed battery storage and local-content thresholds, aligning climate goals with industrial policy and driving domestic manufacturing. Abundant solar irradiance and available desert land sustain world-leading capacity factors that anchor competitive pricing. At the same time, rising commercial and industrial uptake signals a pivot from purely utility-scale builds toward diverse distributed applications, reinforcing a dynamic, multisegment market framework.
Key Report Takeaways
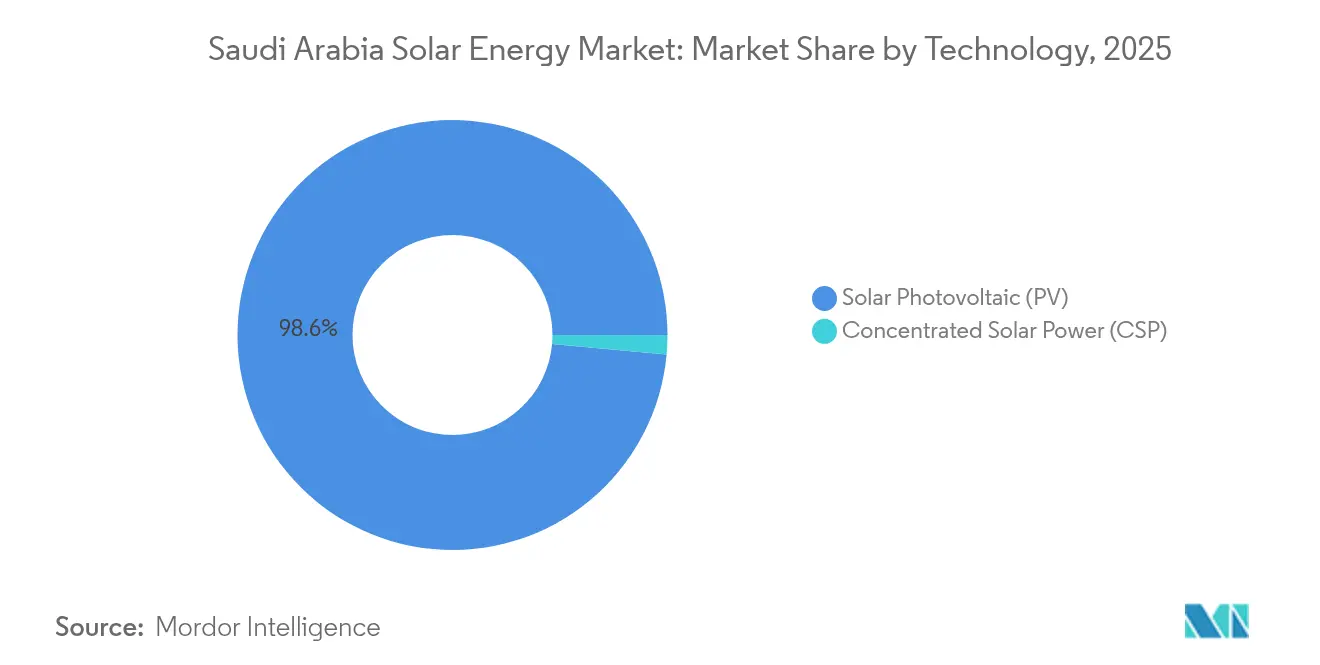
- By technology, solar photovoltaics (PV) led with 98.55% of the Saudi arabia solar energy market share in 2025, while concentrated solar power (CSP) is projected to expand at a 44.3% CAGR to 2031, the fastest among all segments.
- By grid type, on-grid installations held a 89.85% share of the Saudi arabia solar energy market in 2025, and off-grid systems are advancing at a 36.1% CAGR through 2031.
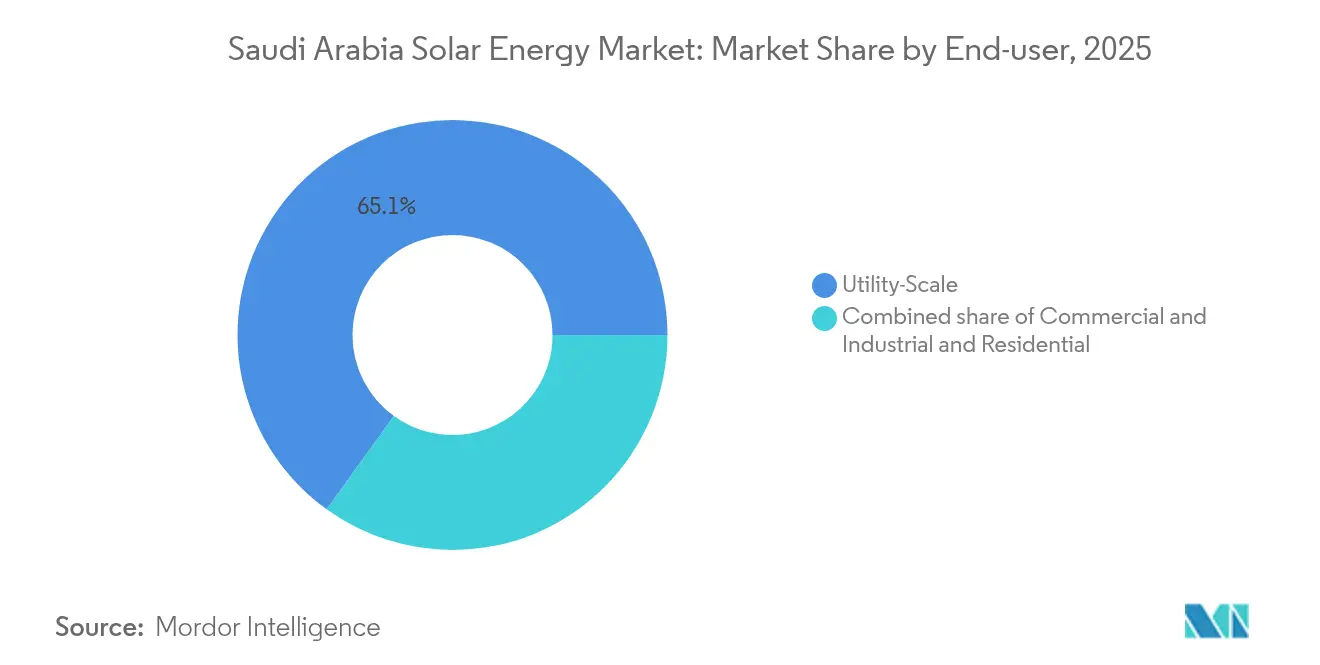
- By end-user, utility-scale projects accounted for 65.05% of the Saudi arabia solar energy market size in 2025, while commercial and industrial installations are forecast to expand at a 38.9% CAGR to 2031.
Note: Market size and forecast figures in this report are generated using Mordor Intelligence’s proprietary estimation framework, updated with the latest available data and insights as of 2026.
Saudi Arabia Solar Energy Market Trends and Insights
Drivers Impact Analysis*
| Driver | (~) % Impact on CAGR Forecast | Geographic Relevance | Impact Timeline |
|---|---|---|---|
| Vision 2030 National Renewable Energy Program targets | +8.50% | Northern and Eastern provinces | Long term (≥ 4 years) |
| Declining levelized cost of solar PV | +6.20% | High-irradiance zones nationwide | Medium term (2-4 years) |
| REPDO utility-scale tender pipeline | +7.10% | Grid-connected areas nationwide | Medium term (2-4 years) |
| Abundant irradiance and land availability | +4.80% | Northern Border and Eastern provinces | Long term (≥ 4 years) |
| Localization incentives for PV manufacturing | +3.40% | Riyadh and Eastern manufacturing hubs | Long term (≥ 4 years) |
| Green-hydrogen export ambitions | +2.80% | NEOM and Red Sea corridor | Long term (≥ 4 years) |
| Source: Mordor Intelligence | |||


Vision 2030 National Renewable Energy Program Targets Drive Systematic Deployment
The government targets 58.7 GW of renewables by 2030, equal to roughly half of expected installed capacity, which reshapes the country's generation portfolio from hydrocarbons to clean power. REPDO's multi-round auctions provide developers with predictable timelines, uniform contract structures, and escalating local-content rules, which increased from 15% to 35% between Round 1 and Round 6. Over 3.3 GW was awarded in the latest rounds at an average tariff of 1.97¢/kWh, underscoring the program's credibility. The tender cadence signals to investors that additional land banks, transmission upgrades, and financing windows will remain in sync. Predictability reduces capital costs and underpins a bankable project pipeline, ensuring that the Saudi Arabia solar energy market continues attracting global and regional developers.
Declining Levelized Cost Creates Grid Parity Advantage
Recent winning bids dipped to 1.67 c/kWh, surpassing natural gas estimates by more than 50% once LNG export opportunity costs are factored in. Module pricing benefits from local fabrication agreements with JinkoSolar and TCL Zhonghuan that eliminate import duties and freight charges. Superior average irradiation of 2,200 kWh/m²/year delivers capacity factors above 28%, enabling fewer panels to deliver more energy and improving project economics.(1) King Abdullah University of Science and Technology, “Solar Atlas for the Kingdom,” kaust.edu.sa Bifacial modules and single-axis trackers extract incremental yield, while risk-based O&M contracts keep downtime low. Combined, these factors lock in grid-parity or better economics, helping the Saudi Arabia solar energy market outcompete conventional assets.
REPDO Tender Pipeline Ensures Market Predictability
Announced tenders cover more than 20 GW through 2030, offering transparency unmatched in many emerging markets. Standardized PPAs, indexed escalation clauses, and new performance-based incentives for grid services make revenue streams highly forecastable. Hybrid solar-storage obligations in upcoming rounds build a procurement bridge between merchant renewables and dispatchable capacity. Local-content uplifts embedded in bid scoring further stimulate supply-chain formation, securing module, tracker, and inverter plants in Riyadh and Eastern Province. These design choices create a virtuous cycle where each auction round tightens pricing while boosting domestic value addition, cementing the Saudi Arabia solar energy market as a regional benchmark for structured renewables growth.
Abundant Solar Resources Enable Competitive Advantage
Northern desert zones post direct normal irradiance of 2,500 kWh/m²/year, surpassing California and Spain by up to 30%. Low land-lease rates and minimal competing land uses limit acquisition friction. Dense networks of pyranometers and satellite-based forecasting reduce interannual yield uncertainty, improving bankability. Multi-gigawatt clusters enable shared infrastructure, such as 380 kV substations and operations centers, thereby reducing per-megawatt balance-of-plant costs. High irradiation also supports emerging CSP designs with longer thermal storage, adding firm capacity without fossil back-up. Together, these resource advantages keep levelized costs trending downward, reinforcing the competitive edge of the Saudi Arabia solar energy market.
Restraints Impact Analysis*
| Restraint | (~) % Impact on CAGR Forecast | Geographic Relevance | Impact Timeline |
|---|---|---|---|
| Grid connection bottlenecks in remote areas | −2.1% | Northern Border and Empty Quarter | Medium term (2-4 years) |
| High upfront cost of CSP versus PV | −1.8% | Nationwide | Short term (≤ 2 years) |
| Water scarcity for panel cleaning | −1.3% | Central and northern deserts | Short term (≤ 2 years) |
| Import dependence for key components | −1.5% | Nationwide | Medium term (2-4 years) |
| Source: Mordor Intelligence | |||
Grid Connection Bottlenecks Constrain Remote Development
Legacy transmission grids radiate from coastal gas-fired hubs toward load centers, leaving northern deserts underserved.(2)Saudi Electricity Company, “Annual Report 2024,” sec.com.sa High-capacity 380 kV lines and flexible AC/DC converters are budgeted, yet construction timelines extend up to five years, outpacing PV build schedules. Interim battery tenders totaling 8 GWh mitigate imbalance risk but cannot substitute for bulk transmission. Developers front-load interconnection studies, sometimes relocating projects nearer to substations, which shifts optimal irradiation trade-offs. Until grid corridors catch up, the Saudi Arabia solar energy market must juggle resource quality against infrastructure readiness.
High Upfront Capital Requirements Limit CSP Deployment
While CSP delivers 12-15 h of stored energy, costs remain USD 3,500–5,000/kW, quadruple utility PV levels. Complex molten-salt loops and specialized turbines need bespoke engineering and higher contingency reserves. Lenders demand stricter technical due diligence, elongating the financial close. Hybrid PV-CSP configurations have slightly lower weighted costs but do not fully bridge the gap. Consequently, CSP is restricted to projects with premium revenues for firm power, capping near-term volume and curbing its share of the Saudi Arabia solar energy market.
*Our forecasts treat driver/restraint impacts as directional, not additive. The impact forecasts reflect baseline growth, mix effects, and variable interactions.
Segment Analysis
By Technology: PV Commands Volume While CSP Gains Strategic Footholds
Solar photovoltaic installations held 98.55% of the Saudi Arabian solar energy market share in 2025, reflecting unmatched cost advantages and modular scalability. Large desert tracts enable gigawatt-scale PV clusters, and single-axis trackers plus bifacial modules push capacity factors past 28%. Falling module prices and standardized EPC contracts drive levelized costs below 2 c/kWh, entrenching PV as the workhorse of new renewable capacity. As more local factories ramp up, project developers anticipate steadier pricing and shorter lead times, deepening PV’s dominance within the Saudi Arabia solar energy market.
Concentrated solar power, though small in absolute volume, is projected to book a 44.3% CAGR during 2026–2031. Storage-equipped CSPs fill late-evening demand and provide inertia, an attribute prized as variable PV penetrates deeper into the grid. Thermal storage up to 15 h allows dispatch beyond sunset, reducing reliance on gas peakers. NEOM, industrial clusters, and remote desalination plants value this dispatchable green heat. As molten-salt technologies and heliostat automation reduce capital expenditures (capex), CSP’s addressable niche widens, ensuring it remains a strategic complement within the Saudi Arabia solar energy market.


By Grid Type: On-Grid Dominates Yet Off-Grid Surges for Remote Demand
On-grid assets comprised 89.85% of installed capacity in 2025, underpinning the centralized generation strategy and benefiting from the Saudi Electricity Company’s bankable PPAs. Gigawatt-sized parks plug into 380 kV backbone lines and benefit from economies of scale in operations and maintenance (O&M), land use, and financing. Robust regulatory oversight enhances certainty, reinforcing the on-grid segment’s central role within the Saudi Arabia solar energy market.
Off-grid systems, although starting from a small base, are projected to register a 36.1% CAGR to 2031, driven by giga-projects such as NEOM and large mines located outside main grid corridors. Microgrids combine PV with batteries and sometimes small wind turbines, slashing diesel costs and curbing emissions. Modular storage containers, fast-tracking EPC, and simplified land permitting make off-grid attractive for time-sensitive developments. As the logistics and remote tourism economies grow, the off-grid share of the Saudi Arabia solar energy market is expected to accelerate, despite its current minor footprint.
By End-User: Utility-Scale Leads While C&I Demand Gains Momentum
Utility-scale projects accounted for 65.05% of the Saudi Arabia solar energy market size in 2025, secured through centrally procured bids ranging from 50 MW to 2 GW. Streamlined environmental reviews and competitive auction designs keep build costs down, anchoring national decarbonization plans. These installations directly connect to high-voltage networks, supplying bulk power that supports peak summer loads.
Commercial and industrial users are forecast to posta 38.9% CAGR, reflecting corporate cost-saving drives and sustainability pledges. Steel, cement, and petrochemical operators benefit from on-site PV arrays linked through net-metering or virtual PPAs. Recent policy tweaks offering bankable contracts and faster interconnection approvals unlock rooftop and carport deployment. While residential uptake remains modest due to subsidized tariffs, pilot programs in smart cities indicate latent potential, adding diversity to the Saudi Arabia solar energy market over time.
Geography Analysis
Northern Border and Eastern provinces capture the bulk of large-scale awards as their irradiance surpasses 2,500 kWh/m²/year and land acquisition is straightforward. Mega-parks, such as the 2 GW Al-Sadawi cluster, co-locate shared substations, cutting grid-tie expenses and boosting overall capacity factors. These regions anchor the national push toward 58.7 GW of renewables, reinforcing the primacy of resource-rich desert corridors within the broader Saudi Arabia solar energy market.
Western provinces are leveraging solar energy to power tourism and desalination. The Red Sea Development Company commissioned a 400 MW solar microgrid paired with 1.3 GWh batteries, supplying 100% renewable power to resorts and airports. NEOM’s northwest location will stack more than 4 GW of PV for hydrogen export, adding strategic depth to the Saudi Arabia solar energy market by coupling electricity with commodity exports.
Distributed solar atop factories and logistics hubs combine energy savings with ESG branding. As electricity demand increases with the development of new data centers and advanced industries, central provinces will integrate rooftop, carport, and ground-mount systems, completing a diversified geographic tapestry for the Saudi Arabia solar energy market.
Regulatory Landscape
Saudi Arabia solar procurement is anchored by the National Renewable Energy Program (NREP) under the Ministry of Energy, with the Saudi Power Procurement Company (SPPC) acting as the principal buyer and counterparty for utility-scale PPAs. This centralized approach supports the REPDO-style competitive tenders referenced across recent rounds, and it has been accompanied by rising localization requirements, with local-content thresholds increasing from 15% in early rounds to 35% by Round 6.
For distributed and self-consumption solar, the Saudi Electricity Regulatory Authority (SERA) sets the regulatory framework for renewable energy generation for self-consumption, while the Saudi Standards, Metrology and Quality Organization (SASO) issues technical regulations for solar photovoltaic systems. On the grid-connection side, Saudi Electricity Company (SEC) publishes connection process documents and connection guidelines for small-scale solar PV, and the Shamsi portal supports the customer-facing pathway for distributed solar participation.
Competitive Landscape
ACWA Power leads with 17.8 GW of contracted capacity across 14 projects, leveraging backing from the Public Investment Fund and its deep project-finance expertise to maintain a first-mover edge. The developer’s portfolio spans PV, CSP, and hybrid configurations, underpinning technology diversification. Partnerships with Saudi Aramco on integrated solar-hydrogen complexes extend its influence beyond power sales, anchoring new value chains inside the Saudi Arabian solar energy market.
Foreign IPPs, such as Masdar, EDF Renewables, and TotalEnergies, secure positions through joint ventures that combine global engineering expertise with local execution networks. Chinese OEMs JinkoSolar, LONGi, and Trina Solar establish factories in Riyadh and the Eastern Province, meeting rising local-content thresholds while seeding after-sales service centers. These moves intensify competition, driving hardware costs lower and accelerating technology transfer across the Saudi Arabia solar energy market.
Technology innovation now defines differentiation. Developers deploy AI-enabled performance monitoring, drone-based inspections, and high-efficiency bifacial modules to squeeze additional yield. As bids inch below 2 c/kWh, O&M optimization and ancillary service offerings around batteries and grid support become new revenue levers. This push for operational excellence underscores a maturing phase for the Saudi Arabian solar energy market, where cost leadership must coexist with technical sophistication.
Saudi Arabia Solar Energy Industry Leaders
Alfanar Group
Abu Dhabi Future Energy Company (Masdar)
EDF Renewables
Saudi Electricity Company
ACWA Power Company
- *Disclaimer: Major Players sorted in no particular order

Market Opportunities and Future Outlook
Utility-scale procurement remains the largest addressable opportunity, supported by SPPC-led PPAs and the Ministry of Energy's stated objective of a 50% renewable and 50% gas electricity mix by 2030. The pipeline and execution emphasis show up in 2025 activity, where five large-scale solar PV plants (Afif 1, Afif 2, Al-Humaij, Bisha, and Khulais) were awarded with a combined capacity of 12 GW. PIF-backed development commitments also position Badeel and its partners as repeat counterparties for multi-project portfolios.
Localization and supply-chain buildout add further whitespace beyond generation assets. The market already has manufacturing investment proof points, including the JinkoSolar and Public Investment Fund joint venture to establish a 10 GW solar cell and module manufacturing facility in Riyadh (production scheduled to commence in 2026), and TCL Zhonghuan's integrated complex in the Eastern Province for ingot and wafer capacity. On the grid-integration side, opportunities also concentrate on enabling capabilities where constraints are documented, including utility-scale battery storage procurement (8 GWh across multiple sites) and the EPC and O&M capacity needed for desert operations (soiling, water-efficient cleaning) and hybridization requirements embedded in upcoming tender rounds.
Recent Industry Developments
- January 2026: Saudi Power Procurement Company (SPPC) announced the list of qualified bidders for the seventh round of the National Renewable Energy Program, covering a combined 5,300 MW of solar and wind projects. The prequalification step narrows the near-term competitive set for utility-scale solar and signals continued reliance on standardized SPPC procurement as the primary route to market for large PV capacity.
- October 2025: Saudi Electricity Company and EDF Power Solutions signed a 25-year power purchase agreement with SPPC for the 600 MW Samtah solar PV project. The long-tenor PPA improves bankability for new PV builds and reinforces the role of SPPC-backed contracts in sustaining international developer participation alongside local utilities.
- December 2024: JinkoSolar and the Public Investment Fund unveiled a USD 1.2 billion joint venture to build a 10 GW solar cell and module manufacturing facility in Riyadh, with production scheduled to commence in 2026. This expands domestic module supply aligned with local-content scoring in tenders and supports shorter lead times and after-sales service capacity for projects executed inside the Kingdom.


Research Methodology Framework and Report Scope
Market Definition and Coverage
For this methodology, the Saudi Arabia solar energy market is defined as solar power capacity added and operating within the country, tracked mainly in installed capacity terms, and tied to grid connection and end-user deployment.
Scope exclusions: We exclude non-solar renewables and any upstream raw-material value chain activity that is not directly linked to solar power deployment and operations in Saudi Arabia.
Segmentation Overview
- By Technology
- Solar Photovoltaic (PV)
- Concentrated Solar Power (CSP)
- By Grid Type
- On-Grid
- Off-Grid
- By End-User
- Utility-Scale
- Commercial and Industrial (C&I)
- Residential
- By Component (Qualitative Analysis)
- Solar Modules/Panels
- Inverters (String, Central, Micro)
- Mounting and Tracking Systems
- Balance-of-System and Electricals
- Energy Storage and Hybrid Integration
Data Sources, Market Sizing, and Validation
Desk Research
Desk work started by building a clean fact base on Saudi power demand, generation mix, and the solar project pipeline, then aligning the timeline to the local policy push for renewables. Public sources were used to anchor assumptions, including Saudi energy and electricity statistics, national procurement and tender notices, regulator and grid-operator publications, and customs or trade statistics where equipment flows help signal build activity.
We also reviewed solar auction announcements, project award disclosures, and press coverage from regional business publications, then cross-checked capacity, commissioning dates, and project ownership clues using company annual reports and investor presentations. In a few places, paid subscriptions were used only to cross-check company financials, monitor major contract wins, and scan patents for technology direction that could affect costs and performance. These desk sources are illustrative and not exhaustive, and many other references were used for data collection, cross-checking, and clarification.
Primary Interviews and Surveys
Primary work focused on validating what is actually moving from announcement to execution, since solar markets can look inflated if delayed projects are counted too early. We spoke with a mix of developers, EPC and component suppliers, financiers, and large buyers across Saudi Arabia, then used their inputs to confirm commissioning schedules, typical capacity factors, and the split between utility and behind-the-meter demand in the country.
Distribution of primary research fieldwork respondents
| Company type | Respondent position |
|---|---|
| Top tier: 25% | CXOs: 12% |
| Mid tier: 57% | Functional/Unit leaders: 28% |
| Smaller Players: 18% | Managers: 60% |
Market-Sizing & Forecasting
Sizing is built mainly through a top-down approach where national generation-planning targets, grid connection cues, and project award pipelines are converted into expected installed capacity additions by year. The totals are then corroborated using selective bottom-up checks, such as rolling up a sample of announced and awarded projects with expected COD timing and applying practical adjustments when projects are likely to slip.
Inputs that most influenced the model include the approved utility-scale tender pipeline, commissioning and grid-connection timelines, typical plant capacity factors under Saudi irradiation conditions, module and BOS price direction, and financing conditions that affect award-to-build conversion. Forecasts were carried using scenario analysis, where base, faster, and delayed build-out paths were set, then narrowed through expert consensus on permitting, supply availability, and grid readiness. Where project data was incomplete, gaps were handled by applying conversion ratios observed in recent tenders and by cross-checking implied equipment demand against reported construction activity.
Data Validation & Update Cycle
Outputs are checked against independent signals, including the visible tender calendar, public award lists, and grid connection and commissioning updates, which helps catch double-counting and unrealistic build rates. If a variance is found, assumptions are reviewed, and follow-up calls are triggered with relevant respondents to confirm whether the issue is timing, scope, or unit conversion.
Before sign-off, the model is reviewed in multiple steps by analysts to confirm the logic, inputs, and arithmetic, and then key results are re-tested with alternative indicators so the final numbers do not depend on a single data point. Reports are refreshed on an annual cycle, with interim updates when material project awards, policy changes, or major delays occur. Right before delivery, a final pass is made so clients receive the most current view available.
Mordor Intelligence's Saudi Arabia Solar Energy Market Size Compared Against Other Published Estimates
Published estimates for Saudi Arabia solar energy often do not match each other because the unit of measurement and what gets counted can shift, even if the market name looks the same. Some sources size the market in USD spend, others in installed capacity, and the timing of when projects are counted also changes the result.
Grid-connection progress and tender award visibility are the checks that keep Mordor Intelligence's figure tied to capacity that is more likely to be built and operated within the stated year, instead of being counted at announcement stage. Gaps also come from how USD numbers are created, since EPC pricing, module price declines, and the exchange-rate timing used for conversion can materially change the reported value in fast-moving build-out years.
Benchmark comparison
| Source | Market Size | Gaps in Research Methodology |
|---|---|---|
| Mordor Intelligence | USD 10.25 B (2025) | |
| Industry Publisher A | USD 8.78 B (2025) | This figure is presented as USD market value and can shift based on assumed EPC pricing, module cost curves, and what is treated as market revenue versus installed base, which makes it hard to reconcile to capacity-led tracking. |
| Regional Consultancy B | USD 6.00 B (2024) | The estimate is for a different year and is stated in USD, which introduces differences from timing, currency conversion, and whether early-stage project intentions are included alongside projects that have secured awards and realistic COD dates. |
Overall, the spread is mostly explained by unit choice and project timing, not only by different growth views. By anchoring the model to observable project awards, commissioning updates, and practical price assumptions, the resulting size can be traced back to clear steps that a buyer can re-check and discuss.


Key Questions Answered in the Report
How fast is solar capacity growing in Saudi Arabia?
Installed capacity is forecast to expand from 13.47 GW in 2026 to 52.72 GW by 2031, reflecting a 31.4% CAGR.
What share of installations use photovoltaic versus CSP technology?
Solar photovoltaic accounts for 98.55% of total capacity, while concentrated solar power holds a niche share but posts the fastest-growing CAGR at 44.3%.
Which regions attract the largest utility-scale solar parks?
Northern Border and Eastern provinces host most large parks due to superior irradiance and available land, supported by 380 kV grid corridors.
Why are off-grid solar systems gaining traction?
Remote giga-projects and industrial sites value off-grid microgrids for cost savings and fast deployment, driving a 36.1% CAGR for the segment.
Who is the leading developer in the country?
ACWA Power leads with 17.8 GW contracted across 14 projects, backed by the Public Investment Fund and strategic ties with Saudi Aramco.
What role does local manufacturing play in cost reduction?
New module and wafer plants in Riyadh and Eastern Province shorten supply chains and meet local-content rules, contributing to record-low auction tariffs under 2 c/kWh.
Page last updated on:




