Sales Performance Management Market Size and Share
Market Overview
| Study Period | 2020 - 2031 |
|---|---|
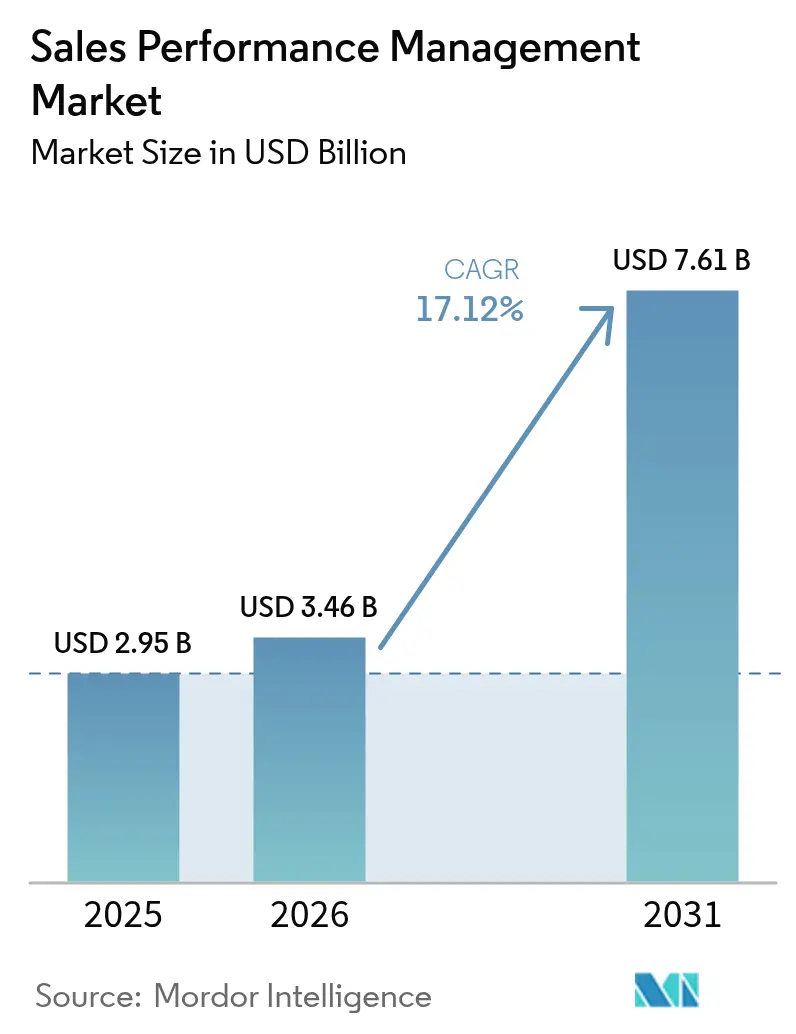
| Market Size (2026) | USD 3.46 Billion |
| Market Size (2031) | USD 7.61 Billion |
| Growth Rate (2026 - 2031) | 17.12% CAGR |
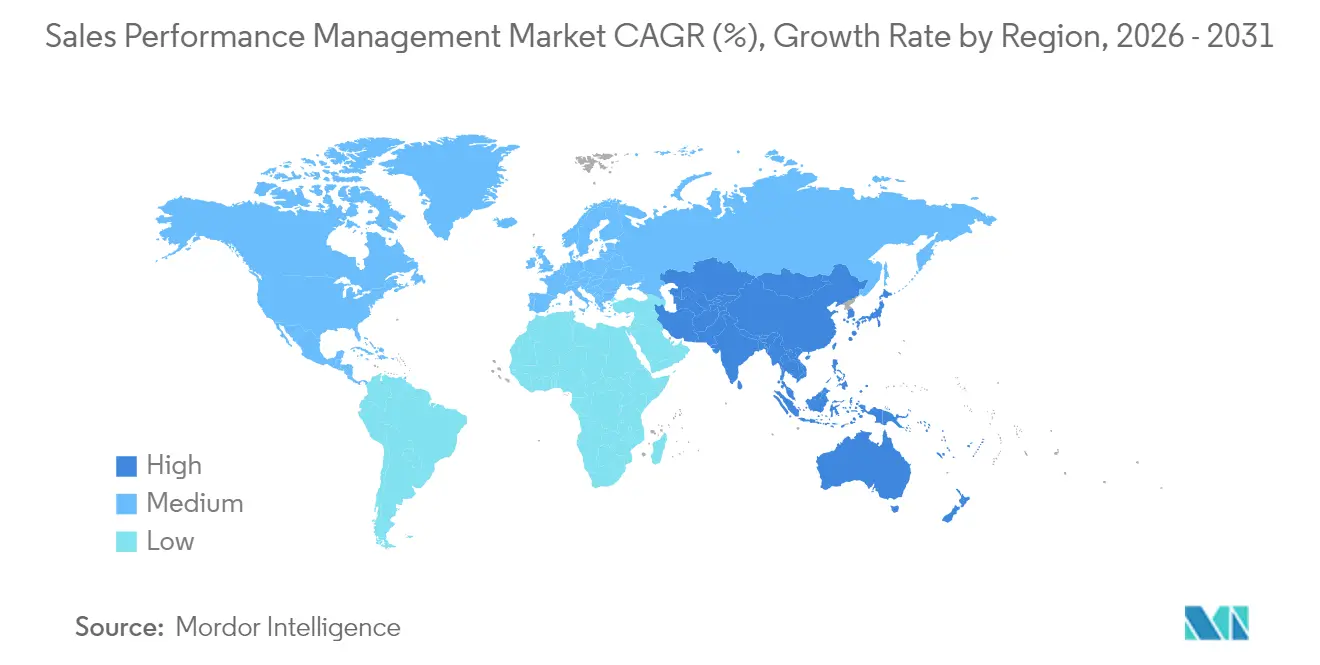
| Fastest Growing Market | Asia Pacific |
| Largest Market | North America |
| Market Concentration | Medium |
Major Players*Disclaimer: Major Players sorted in no particular order Image © Mordor Intelligence. Reuse requires attribution under CC BY 4.0. | |
Sales Performance Management Market Analysis by Mordor Intelligence
The Sales Performance Management Market size is expected to grow from USD 2.95 billion in 2025 to USD 3.46 billion in 2026 and is forecast to reach USD 7.61 billion by 2031 at 17.12% CAGR over 2026-2031.
Sustained momentum is driven by cloud migrations triggered by SAP CallidusCloud’s imminent sunset, rapid adoption of AI-powered territory and quota optimization, and the rising prevalence of usage-based pricing that requires real-time commission calculations.[1]ASUG Staff, “Q4 and FY 2024: SAP Surges as Cloud Revenue Soars in ‘Strong Finish’ to Year,” ASUG, asug.com Converging trends around embedded analytics inside CRM and Revenue Operations stacks, plus no-code configuration for small and midsize organizations, widen the buyer base, while vendors differentiate through API-first architectures and integrated RevOps functionality.[2]CaptivateIQ Marketing, “The Forrester Wave: Sales Performance Management Solutions for Incentive Compensation Q1 2025,” CaptivateIQ, captivateiq.com Competitive intensity is bolstered by strategic acquisitions such as Salesforce-Spiff and the emergence of modern players like Everstage that undercut legacy license models with consumption-aligned pricing.
Key Report Takeaways
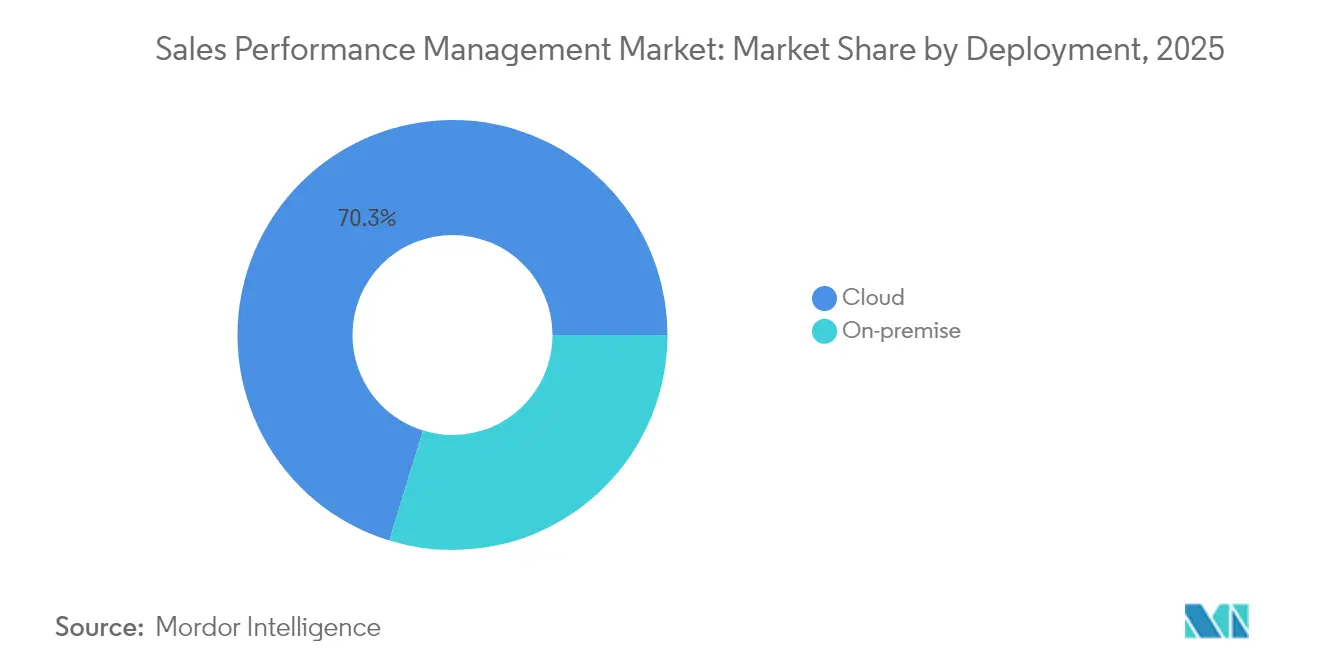
- By deployment, cloud accounted for 70.25% of the Sales Performance Management market share in 2025, while the same segment is projected to record a 15.32% CAGR through 2031.
- By component, software captured 62.10% of the Sales Performance Management market share in while the services segment is forecasted to advance at a 16.55% CAGR to 2031.
- By solution, incentive compensation management led with 37.05% of the Sales Performance Management market share in 2025, while the sales analytics segment is set to expand at an 17.95% CAGR through 2031.
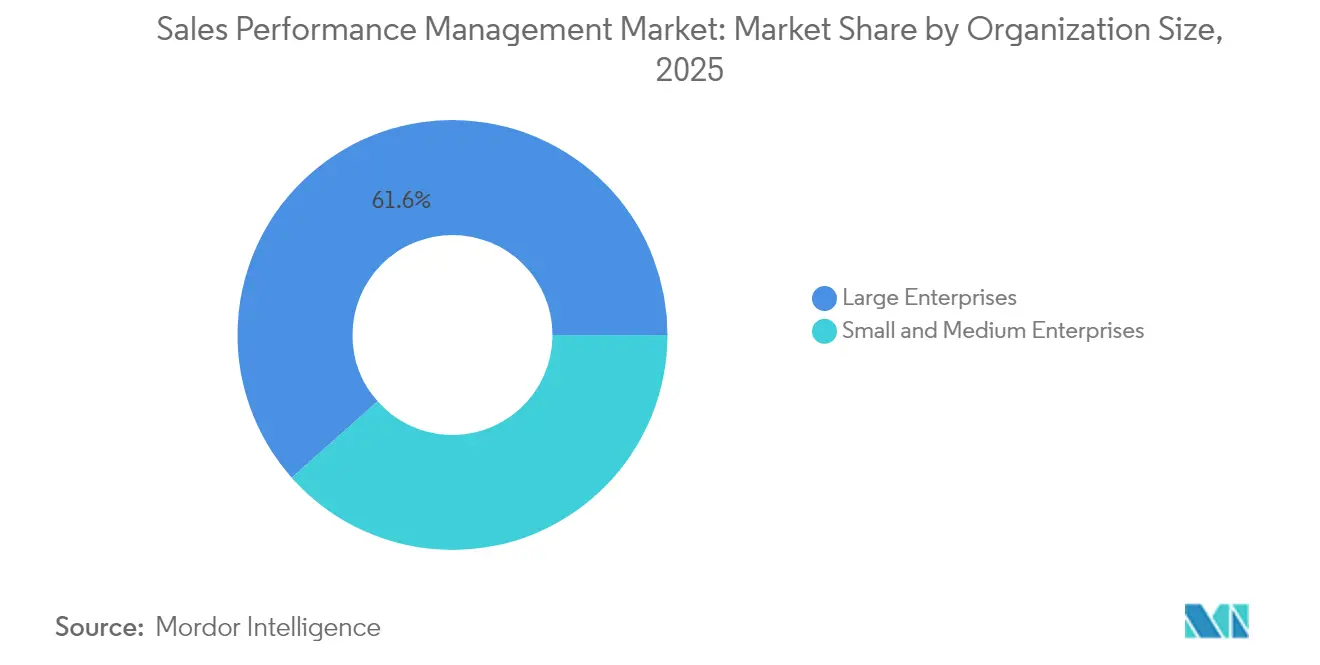
- By organization size, large enterprises held 61.55% of the Sales Performance Management market share in 2025, whereas small and medium enterprises are tracking a 17.55% CAGR to 2031.
- By end-user vertical, BFSI represented 23.55% of the Sales Performance Management market share; IT and telecom is poised to grow at a 15.95% CAGR through 2031.
- By geography, North America contributed 41.10% of the Sales Performance Management market share, while Asia-Pacific is projected to deliver an 17.65% CAGR to 2031.
Note: Market size and forecast figures in this report are generated using Mordor Intelligence’s proprietary estimation framework, updated with the latest available data and insights as of 2026.
Market Trends and Insights
Drivers Impact Analysis of Sales Performance Management Market*
| Driver | (~) % Impact on CAGR Forecast | Geographic Relevance | Impact Timeline |
|---|---|---|---|
| AI-driven quota and territory optimization | +3.2% | Global; early North America and EU | Medium term (2-4 years) |
| Cloud-first upgrades triggered by legacy suite sunset | +4.1% | Global; concentrated North America and EU | Short term (≤ 2 years) |
| Rise of usage-based and subscription pricing | +2.8% | Global; led by North America tech | Medium term (2-4 years) |
| Embedded analytics inside CRM and RevOps | +2.5% | Global; APAC acceleration | Medium term (2-4 years) |
| Gamified seller-engagement add-ons | +1.9% | North America and EU; expanding APAC | Long term (≥ 4 years) |
| Surge in SMB demand for no-code SPM | +2.7% | Global; strong APAC and LATAM | Short term (≤ 2 years) |
| Source: Mordor Intelligence | |||
AI-Driven Quota and Territory Optimization
Machine-learning models now rebalance account assignments continuously, replacing annual spreadsheet exercises that frequently miss emerging pockets of demand. Organizations deploying AI-guided territory design have reported up to 7% annual sales lifts after eliminating workload imbalances and white-space overlap.[3]Xactly Editorial, “How to Optimize Sales Territories for a Strategic Advantage,” Xactly, xactlycorp.com Predictive quota modeling integrates seasonality and individual performance patterns so revenue leaders can adjust goals before pipeline gaps widen. Geolocation data, third-party firmographics, and CRM engagement signals create micro-territories that minimize travel inefficiencies and improve account density. When embedded inside incentive engines, automatic difficulty adjustments maintain rep motivation while keeping payout expense predictable. The capability is particularly valuable for firms managing multi-product lines across expanding regions where manual planning becomes unmanageable.
Cloud-First Upgrades Triggered by Sunset of Legacy ICM Suites
The December 2026 retirement of SAP CallidusCloud obliges thousands of enterprises to re-platform, accelerating cloud adoption beyond organic rates. Buyers confronted with costly on-premises extensions are choosing multi-tenant SPM services that integrate natively with Salesforce, HubSpot, and data-lake architectures. Cloud alternatives reduce custom middleware dependencies and meet audit requirements under ASC 606 with automated documentation, shortening monthly close cycles. Vendors such as Varicent, CaptivateIQ, and Spiff differentiate through rapid migration toolkits and out-of-the-box connectors that compress deployment timelines. For RevOps teams, the shift unlocks elastic scaling and continuous feature updates that on-premises software cannot economically replicate.
Rise of Usage-Based and Subscription Pricing Models
Eighty-five percent of SaaS companies now blend usage-based elements into packaging, driving 38% faster revenue growth than subscription-only peers. Variable consumption tiers and bursty transaction volumes overwhelm legacy batch-processing systems. Modern Sales Performance Management market platforms stream data from billing engines and product analytics to calculate commissions against live consumption, ensuring sellers are compensated on realized revenue rather than contracted values. Technology and telecom providers see particular benefit, reporting 23% higher sales productivity when real-time payout visibility accompanies usage-based deals. These capabilities also support granular claw-back rules that protect margins if customers under-consume.
Embedded Analytics Inside CRM and RevOps Stacks
Revenue leaders want one workspace that blends pipeline health, quota attainment, and commission projections. Contemporary SPM platforms therefore package dashboards directly inside Salesforce, Microsoft Dynamics, and HubSpot, eradicating delays caused by CSV exports. Unified data models let analysts run what-if simulations on plan tweaks and see immediate bottom-line effects without separate BI tools. Predictive algorithms combine historical payout files with open opportunities to surface at-risk territories weeks before quarter-end. For organizations juggling multiple product lines, embedded analytics simplify complex credit-split rules spanning direct, channel, and partner teams.
Restraints Impact Analysis of Sales Performance Management Market*
| Restraint | (~) % Impact on CAGR Forecast | Geographic Relevance | Impact Timeline |
|---|---|---|---|
| Budget compression from efficient-growth mandates | -2.1% | Global; acute North America and EU | Short term (≤ 2 years) |
| Data-quality and integration hurdles | -1.8% | Global; pronounced in legacy enterprises | Medium term (2-4 years) |
| Shortage of incentive-comp-ops talent | -1.3% | North America and EU; emerging APAC | Long term (≥ 4 years) |
| Rising compliance overhead | -1.5% | Global; region-specific | Medium term (2-4 years) |
| Source: Mordor Intelligence | |||
Budget Compression from “Efficient-Growth” Mandates
Macroeconomic caution has boards prioritizing capital efficiency, forcing procurement teams to justify SPM spend through hard ROI. Mid-market buyers that once accepted premium per-seat pricing now demand enterprise-grade capability at SMB budgets, elongating sales cycles and escalating discount pressure. CFO involvement means proof-of-value pilots must quantify quota-attainment lifts and administrative cost reductions before contract signature. As scrutiny rises, vendors respond with modular packaging that allows phased rollouts aligned to quarterly budgets, though this fragments revenue and complicates customer success staffing. Consolidation across the RevOps stack intensifies as firms retire point tools in favor of unified suites that drive faster payback.
Data-Quality and Integration Hurdles Across Siloed GTM Apps
Enterprises often juggle 15–20 disconnected go-to-market applications whose overlapping account hierarchies and inconsistent product catalogs undermine commission accuracy. Duplicate CRM records translate into double payouts, while misaligned opportunity stages delay incentive recognition and erode seller trust. Teams frequently underestimate the data-engineering effort required to harmonize these sources, leading to blown timelines and budget overruns that stall SPM adoption. Complexity worsens after mergers as legacy ERPs, billing engines, and CPQ systems multiply. Vendors that offer pre-built connectors, identity-resolution services, and data-quality dashboards, therefore, gain a competitive advantage among resource-constrained customers.
*Our forecasts treat driver/restraint impacts as directional, not additive. The impact forecasts reflect baseline growth, mix effects, and variable interactions.
Sales Performance Management Market Segment Analysis
By Deployment:
Cloud Acceleration Dominates MigrationThe cloud segment held 70.25% of the Sales Performance Management market in 2025, and it is advancing at a 15.32% CAGR to 2031. Cloud vendors win on API connectivity, elastic scaling, and automatic upgrades that shield users from infrastructure upkeep. On-premises remains relevant in highly regulated environments, yet even those buyers increasingly steer toward hybrid setups that quarantine sensitive data locally while exporting analytics workloads to public clouds. The Sales Performance Management market size for cloud deployments is forecast to almost triple by 2031 as expiring CallidusCloud contracts push laggards to modern SaaS platforms.
Multi-tenant architectures compress per-user costs and democratize advanced capabilities such as AI-assisted territory balancing for mid-market firms. Migration toolkits offering automated data mapping reduce project risk and fuel adoption across North America and Europe first, followed by rapid uptake in Asia-Pacific, where greenfield demand dominates. Vendors that provide sandbox testing and rollback options ease compliance anxiety, accelerating time-to-value for heavily audited sectors like BFSI and healthcare.


By Component:
Services Growth Outpaces SoftwareSoftware retained 62.10% revenue share in 2025, yet services revenue is projected to grow 16.55% annually as implementations widen in scope from commission calculation to holistic revenue optimization. High-value engagements cover data migration, plan architecture, and post-go-live administration that many clients lack in-house. Managed offerings supplying continuous rule adjustments, dispute resolution, and audit support are gaining momentum, especially among SMEs that prefer predictable subscription operating expenses. Implementation partners emphasize change-management training to ensure usability and adoption once the system goes live.
The Sales Performance Management market size tied to consulting and managed services is expected to double by 2031, mirroring increasing platform complexity. Vendors invest in partner ecosystems and accelerator templates to shorten project cycles while capturing recurring services revenue. Compliance with GDPR and ASC 606 further boosts demand for advisory help to embed audit trails and automate documentation.
By Solution:
Analytics Emerges as Growth LeaderIncentive compensation modules delivered 37.05% of 2025 spend, yet sales analytics is on track for an 17.95% CAGR, outpacing all other sub-segments. Customers seek proactive signal detection and prescriptive recommendations rather than retrospective payout accuracy alone. Embedded AI surfaces quota-risk territory clusters and models plan changes across thousands of reps before policies launch. Territory management tools integrate geospatial indexing to balance workload, while planning suites consolidate headcount, pipeline, and capacity metrics into a single workspace.
The Sales Performance Management market share of analytics platforms is expanding as RevOps teams pivot toward unified data models; however, integrated suites that bundle analytics with incentive execution are preferred over standalone BI overlays. Emerging vendors differentiate by embedding real-time dashboards inside seller workspaces, eliminating context switching and boosting adoption rates.
By Organization Size:
SME Acceleration Challenges Enterprise DominanceLarge enterprises controlled 61.55% of 2025 revenues, but small and midsize businesses are growing at a 17.55% CAGR, narrowing the gap. No-code configuration, templated plan libraries, and pay-as-you-grow licensing lower barriers that previously kept SMEs on spreadsheets. For this cohort, the Sales Performance Management market size is forecast to more than double by 2031, aided by localized language packs and simplified billing connectors. Enterprises, meanwhile, deepen deployments through AI modules and cross-functional data unification that justify higher per-seat spend.
Platform vendors court SMEs with guided onboarding, while simultaneously courting Fortune 500 accounts by scaling to millions of transactions per month. The dual-track strategy pressures traditional enterprise incumbents to streamline pricing and UI complexity or cede the mid-market to disruptive entrants.
By End-User Vertical:
IT and Telecom Leads Growth TrajectoryBFSI retained 23.55% revenue share in 2025 thanks to intricate multichannel compensation schemes and stringent audit mandates. Nonetheless, IT and telecom is projected for 15.95% CAGR as SaaS firms gravitate toward consumption-based billing motifs that demand event-level commission engines. For technology vendors, the Sales Performance Management industry requirements extend to split-credit rules across direct and channel routes, making algorithmic flexibility paramount.
Manufacturing, energy, and healthcare sectors adopt SPM for channel partner alignment and complex SKU catalogs yet post steadier single-digit growth. Retail and consumer-goods companies are adopting omnichannel payout logic that credits both online influence and in-store closure to motivate hybrid seller roles. Vertical specialization opens white-space for vendors offering pre-built compliance packs for HIPAA or FINRA scenarios.
Geography Analysis
North America Sales Performance Management Market
North America accounted for 41.10% of 2025 spending, anchored by the United States' technology concentration and advanced RevOps maturity. Adoption growth has slowed as large enterprises complete first-wave migrations, but upgrade cycles add AI and embedded analytics modules to sustain revenue. Canada and Mexico contribute through manufacturing and energy adoptions, while ASC 606 and SOX rules continue to favor automation over spreadsheets.
APAC Sales Performance Management Market
Asia-Pacific is on pace for an 17.65% CAGR through 2031, making it the fastest-expanding region. China leads with central government digitization programs and expanding multinational seller footprints. India adds momentum through IT-services exports and domestic SaaS insurgents that demand sophisticated commission automation. Southeast Asian markets benefit from smartphone diffusion and cross-border e-commerce, prompting firms to seek real-time seller visibility across multiple currencies and languages.
EMEA and South America Sales Performance Management Market
Europe records steady mid-teens growth as GDPR compliance accelerates cloud SPM uptake that embeds privacy-by-design. The United Kingdom, Germany, and France drive demand via the BFSI and manufacturing sectors that need rigorous audit trails and multi-currency support. Brexit-induced trade complexity elevates the value of platforms offering automated FX and tax calculations. South America and the Middle East and Africa remain nascent but promising, where local enterprises aim to match multinational sales discipline without capital-intensive on-premises investments, gravitating toward subscription cloud offers.

Regulatory Landscape
Sales performance management (SPM) platforms sit at the intersection of compensation administration and enterprise data processing, so compliance requirements are shaped by privacy, financial controls, and evolving AI governance. In the EU, the Pay Transparency Directive (2023/970) sets a June 7, 2026 transposition deadline, expanding documentation and disclosure expectations around variable pay elements such as commissions, bonuses, and SPIFFs. That timeline increases demand for auditable plan rules, reporting, and consistent eligibility logic across geographies.
AI regulation and privacy rules also tighten requirements for explainability, data minimization, and notices when incentives are treated as financial benefits. The EU AI Act introduces an August 2, 2026 enforcement milestone that affects how AI-driven forecasting and optimization features are designed and governed in RevOps stacks. In the United States, privacy obligations continue to expand at the state level, including California Consumer Privacy Act (CCPA) regulations effective January 1, 2026, which address treatment and notification obligations around financial incentives and intersect with incentive compensation program administration and employee data handling.
Value Chain Analysis
The value chain starts with SPM software vendors delivering core modules such as incentive compensation management, territory and quota planning, and sales analytics, with most deployments structured as cloud SaaS. Implementation and enablement partners, including consulting firms, systems integrators, and managed services teams, configure plan rules, migrate historical payout data, and operationalize governance processes, while customers provide upstream data from CRM, CPQ, order management, billing, ERP/finance, and HRIS. Cloud infrastructure and marketplaces increasingly function as distribution and procurement channels.
Integration ecosystems provide the connective tissue in this market, with partnerships focused on workflow handoffs and data consistency across RevOps. Examples include Xactly collaborating with ServiceNow to connect intelligent revenue solutions with ServiceNow Sales and Order Management (May 2025) and Varicent collaborating with ServiceNow to embed sales planning and incentive compensation into ServiceNow Customer Workflows (announced July 2025). Varicent was also named a Workday Innovation Partner with certified integration (April 2025). Bottlenecks typically show up in data quality, identity resolution across systems, and change management for new plan designs, so vendors that offer certified connectors, accelerators, and co-sell routes through major platforms tend to reduce deployment friction and shorten time-to-value.
Competitive Landscape
Fragmentation persists as established suites from SAP, Oracle, and Salesforce confront API-first challengers such as CaptivateIQ, Everstage, and Varicent. Incumbents still command broad install bases, yet modern entrants win greenfield deals through rapid deployment, consumption-aligned pricing, and superior user experience.The market witnesses consolidation exemplified by Salesforce’s Spiff buyout, which folds commission automation into Revenue Cloud and pressures independent vendors to secure defensible niches.
AI capability is now table stakes, with vendors layering predictive quota, territory balancing, and generative plan design onto core calculation engines. Those offering embedded analytics inside CRM workflows gain stickiness, as customers resist context switching. Vertical-specific templates for BFSI and healthcare give specialized providers access to regulated industries where horizontal rivals face longer qualification cycles.
Go-to-market strategies bifurcate between enterprise direct sales and product-led growth for SMEs. CaptivateIQ and Everstage leverage self-serve onboarding, while Varicent and Xactly cultivate partner ecosystems to scale implementation capacity. Strategic alliances with integration-platform-as-a-service vendors like Workato further alleviate data-quality pain points, enhancing win rates in complex IT environments.
Sales Performance Management Industry Leaders
Anaplan Inc.
Beqom SA
Varicent Software Inc.
Iconixx Software Corporation
Incentive Solutions Inc.
- *Disclaimer: Major Players sorted in no particular order
Sales Performance Management Market Companies Covered in this Report
- SAP SE
- Oracle Corporation
- Varicent Inc.
- Xactly Corporation
- NICE Ltd.
- Anaplan Inc.
- Salesforce Inc.
- beqom SA
- Optymyze Inc.
- Performio Solutions Inc.
- CaptivateIQ Inc.
- Everstage Inc.
- Forma.ai Inc.
- Spiff Inc.
- Incentive Solutions Inc.
- Iconixx Software Corporation
- Board International S.A.
- Pigment SAS
- Akeron S.p.A.
- Jedox AG

Market Opportunities and Future Outlook
A clear opportunity area is compliance-led modernization of variable pay governance, where SPM platforms can package pay transparency, audit trails, and equity-adjacent reporting into compensation operations workflows. The EU Pay Transparency Directive (2023/970), with a June 7, 2026 national transposition deadline, is pushing multinational organizations to standardize commission and bonus logic, improve traceability of plan decisions, and reduce reliance on spreadsheet-based processes that are hard to defend under disclosure and audit requests. That shift creates whitespace for vendors that provide defensible documentation, policy-based controls, and configurable reporting across multiple countries and currencies without heavy custom development.
Another opportunity centers on tighter integration of SPM with broader enterprise platforms and cloud modernization initiatives, bringing SPM closer to operational systems that generate billable events and support revenue recognition. Enterprise partnerships indicate buyers are prioritizing workflow integration, including Varicent and ServiceNow (July 2025) and Varicent and Workday via certified integration (April 2025), while cloud distribution continues to expand through Xactly’s AWS Marketplace availability (June 2025). Large-scale commission modernization on cloud architectures also points to demand for scalable, near real-time commission reporting and analytics in high-volume environments, as seen in T-Mobile US modernizing sales commissions using AWS services.
Recent Industry Developments in Sales Performance Management Market
- July 2026: Anaplan expanded its collaboration with Google Cloud to deploy its AI-driven planning platform on Google Cloud infrastructure in France, aligning with enterprise requirements around data residency and sovereignty. This strengthens Anaplan's position with regulated and public-sector-adjacent buyers that require tighter control over where planning and performance data is processed. The move also reinforces cloud ecosystem alignment for customers standardizing on Google Cloud.
- January 2026: beqom announced the acquisition of PayAnalytics to integrate pay equity capabilities into its compensation management offering. Bringing pay equity tooling closer to compensation workflows supports organizations that are operationalizing fairness analysis alongside variable pay decisions. The combination also broadens beqom's appeal for enterprises responding to pay transparency and governance requirements across regions.
- July 2025: Varicent announced a collaboration with ServiceNow to integrate its Sales Planning and Incentive Compensation solutions into the ServiceNow Customer Workflows ecosystem, with availability through the ServiceNow Store by Q4 2025. Embedding planning and ICM into a widely used workflow platform reduces friction between revenue operations, order processes, and incentive execution. This partnership also increases Varicent's reach through platform-based distribution and co-selling routes.


Sales Performance Management Market Report Scope and Research Methodology
Market Definition and Coverage
For this study, the sales performance management market covers software and related services used to plan, measure, and improve sales outcomes, including compensation, quota and territory work, sales planning, monitoring, and analytics, across industries and regions.
Scope exclusions: We exclude general CRM licensing, marketing automation, and basic BI tools when they are not used as part of an SPM workflow.
Segments Covered in This Report
- By Deployment
- On-premise
- Cloud
- By Component
- Software
- Services
- By Solution
- Incentive Compensation Management
- Territory Management
- Sales Planning and Monitoring
- Sales Analytics
- Other Solutions
- By Organization Size
- Large Enterprises
- Small and Medium Enterprises
- By End-user Vertical
- BFSI
- Manufacturing
- Energy and Utilities
- Healthcare
- IT and Telecom
- Retail and Consumer Goods
- Others (Transportation, Media, etc.)
- By Geography
- North America
- United States
- Canada
- Mexico
- Europe
- United Kingdom
- Germany
- France
- Italy
- Spain
- Russia
- Rest of Europe
- Asia-Pacific
- China
- Japan
- India
- South Korea
- Australia
- Rest of Asia-Pacific
- South America
- Brazil
- Argentina
- Rest of South America
- Middle East and Africa
- Middle East
- Israel
- Saudi Arabia
- United Arab Emirates
- Turkey
- Rest of Middle East
- Africa
- South Africa
- Egypt
- Rest of Africa
- Middle East
- North America
Data Sources, Market Sizing, and Validation
Desk Research
Desk research was used to build the base structure of the model and to keep assumptions tied to real-world adoption signals. We reviewed public sources such as U.S. SEC filings, annual reports and investor presentations, technology standards and guidance notes from bodies such as NIST, and digital economy datasets from sources such as the World Bank and OECD.
To make sure the market boundaries were applied consistently across regions, we also used association websites, reputable press coverage, and peer-reviewed journals that discuss sales incentive practices and sales analytics usage. In parallel, paid subscriptions for company financials and intelligence, plus news and financials, were used selectively to map revenue exposure and major product launches without relying on a single source. These examples are not exhaustive, and many other sources were referenced for data collection, cross-checking, and clarification during the work.
Primary Interviews and Surveys
Primary work centered on interviews and structured surveys with solution providers, channel partners, and enterprise buyers who manage sales operations, sales compensation, and sales analytics. Inputs were gathered across APAC, EMEA, and the Americas to validate adoption pace, service attach rates, and realistic pricing movement, and then to close gaps where public reporting was not detailed enough.
Distribution of primary research fieldwork respondents
| Company type | Respondent position | Region |
|---|---|---|
| Top tier: 31% | CXOs: 12% | APAC: 43% |
| Mid tier: 55% | Functional/Unit leaders: 37% | EMEA: 35% |
| Smaller Players: 14% | Managers: 51% | Americas: 22% |
Market-Sizing & Forecasting
Sizing started with a top-down build that reconstructs the addressable demand pool from enterprise software spending patterns and the share that typically sits within sales operations and incentive management programs, and then it is split by region and deployment. Once the totals were formed, selective bottom-up approximations were used as a check, such as sampling vendor revenue exposure to SPM, and validating implied user counts through typical price-per-user or price-per-module ranges.
To keep the model practical, a small set of measurable inputs was emphasized, including enterprise headcount in sales functions, cloud adoption in sales tools, average contract values for SPM suites, services attach rates for implementation and managed services, and renewal behavior that changes spend timing. Forecasts were developed using scenario analysis supported by expert views on sales hiring cycles, planned digitization of incentive programs, and procurement shifts toward bundled platforms. Where bottom-up inputs were incomplete, gaps were handled through conservative range-setting and then adjusted after interviews confirmed what portion of spend was truly SPM versus adjacent sales software.
Data Validation & Update Cycle
Outputs were checked through multiple passes, where assumptions were compared against independent signals like reported software growth trends, hiring and pipeline indicators for sales roles, and regional enterprise IT spending movement. When a result looked out of line, the drivers were traced back to pricing, adoption, or scope flags, and then the inputs were re-checked and, when needed, primary respondents were re-contacted to confirm the direction.
Before sign-off, the model and written insights go through analyst review steps so math, scope, and story remain aligned. Reports are refreshed annually, and interim updates are made when material events occur, such as major product changes, regulation impacts on incentive practices, or sharp macro shifts. Right before delivery, a final pass is completed so clients receive the latest updated view.
Mordor Intelligence's Sales Performance Management Market Size Compared With Other Published Estimates
Published market numbers for sales performance management can differ even when the topic label looks the same, because the boundary between SPM, CRM, and broader sales software is not always applied consistently. Differences also show up when services are counted in full, counted partially, or excluded, and when currency timing and base-year choice are not aligned.
By tracking renewal driven revenue timing and checking module level scope rules, Mordor Intelligence keeps the SPM total focused on incentive compensation, territory and quota work, and sales planning and analytics, rather than folding in broader CRM seats or generic BI usage. A second driver is forecasting posture, where some estimates lean on aggressive platform bundling assumptions, and some keep conservative price and adoption paths, which then changes the 2025 starting point and the growth curve.
Key benchmark checks
| Source | Market Size | Gaps in Research Methodology |
|---|---|---|
| Mordor Intelligence | USD 2.95 B (2025) | |
| Global Consultancy A | USD 3.11 B (2025) | Often includes a fuller services layer (professional and managed services) and uses broader end-user mapping, which can lift totals versus a tighter software plus directly tied services view. |
| Industry Research Group B | USD 3.31 B (2025) | Tends to apply a wider functional scope that can pull in adjacent sales software capabilities, and it may assume faster pricing expansion for bundled suites in the base year. |
The spread is explainable once scope and counting rules are placed side by side, especially around what is treated as SPM-specific versus adjacent sales tooling. Our approach stays traceable to clear inputs like adoption, pricing, and services attach rates, which makes the number easier to reproduce and update when market conditions change.


Key Questions Answered in the Report
What is the projected value of the Sales Performance Management market by 2031?
It is forecast to reach USD 7.61 billion, growing at a 17.12% CAGR between 2026 and 2031.
Which deployment model is expanding fastest?
Cloud deployment, already at 70.25% share in 2025, is set for a 15.32% CAGR as enterprises exit on-premises suites.
Which solution area shows the quickest growth?
Sales analytics is expected to post an 17.95% CAGR thanks to embedded AI that predicts quota attainment.
Why is Asia-Pacific considered the growth epicenter?
Digital transformation programs in China, India, and Southeast Asia are driving an 17.65% CAGR through 2031.
Page last updated on:


