
Market Overview
| Study Period | 2021 - 2031 |
|---|---|
| Forecast Data Period | 2026 - 2031 |
| Base Year Market Size (2025) | USD 6.98 Billion |
| Market Size (2026) | USD 7.69 Billion |
| Market Size (2031) | USD 12.14 Billion |
| Growth Rate (2026 - 2031) | 9.56 % |
| Market Concentration | Medium |
Major Players
*Disclaimer: Major Players sorted in no particular order Image © Mordor Intelligence. Reuse requires attribution under CC BY 4.0. |
|
Romania Power EPC Market Analysis by Mordor Intelligence
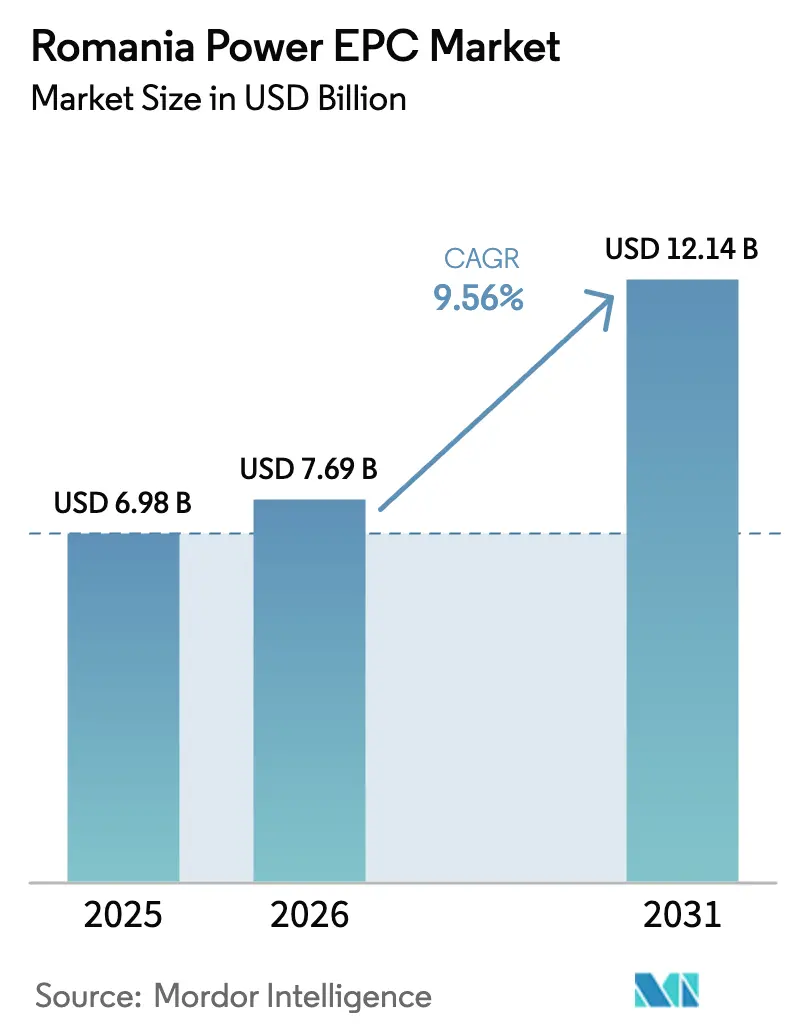
The Romania Power EPC Market size was valued at USD 6.98 billion in 2025 and is estimated to grow from USD 7.69 billion in 2026 to reach USD 12.14 billion by 2031, at a CAGR of 9.56% during the forecast period (2026-2031).
The up-cycle is propelled by a 4.2 GW Contracts for Difference (CfD) pipeline, accelerated coal-unit retirements, and grid-modernization programs jointly financed by the European Union and multilateral lenders. Investment momentum is reinforced by offshore-wind licensing, residential rooftop solar subsidies, and a liberalized bilateral-trading regime that unlocks corporate power-purchase agreements (PPAs). Competition is intensifying as Greek, Austrian, and German EPC majors vie with state-owned incumbents for turnkey contracts, while local integrators exploit distributed-generation niches. Financing conditions continue to ease, sub-5% project debt is now standard for CfD-backed renewables, supporting cash-flow visibility and expanding addressable capacity across wind, solar, gas, and storage.
Key Report Takeaways
- Romania's power EPC market is segmented into power generation EPC and power transmission and distribution (T&D) EPC. Power generation EPC captured 64.6% revenue share in 2025, and the same is projected to grow at 10.15% CAGR through 2031.
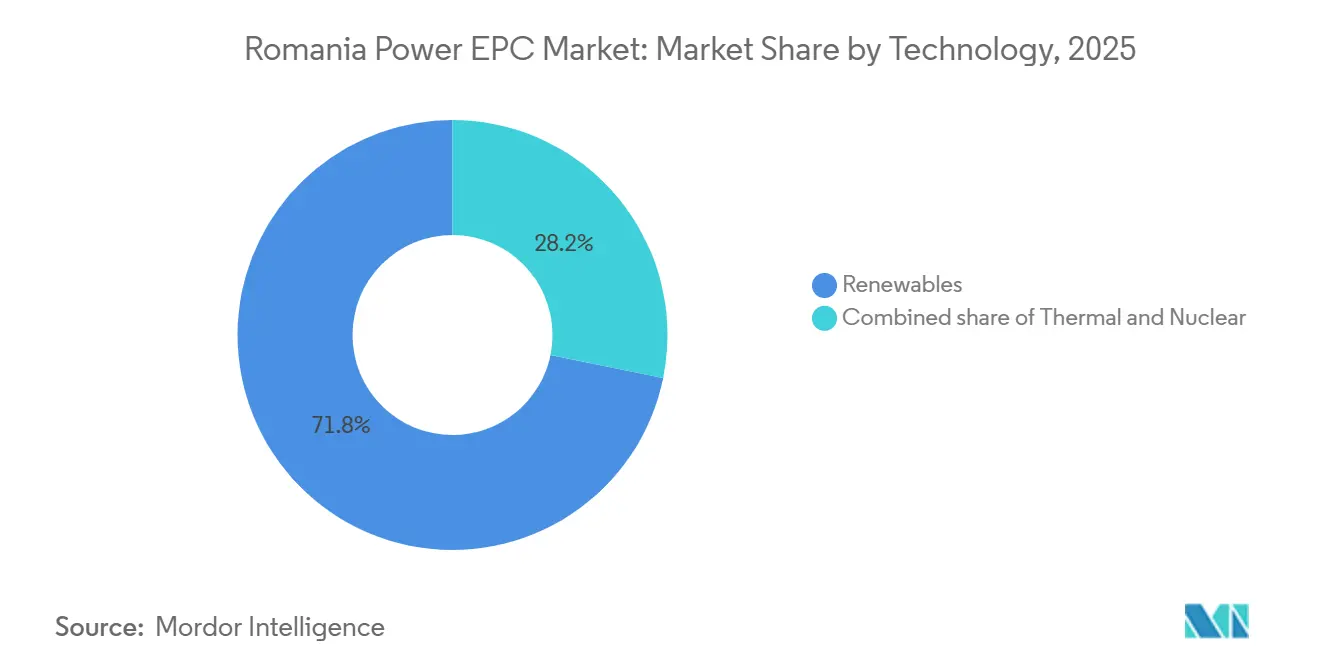
- By technology, renewables led with 71.8% share of the Romania power generation EPC market in 2025 and are advancing at a 10.7% CAGR through 2031.
- By capacity band, the 100–499 MW tier held 65.1% share in 2025; the sub-100 MW distributed-energy segment is forecast to expand at a 12.1% CAGR through 2031.
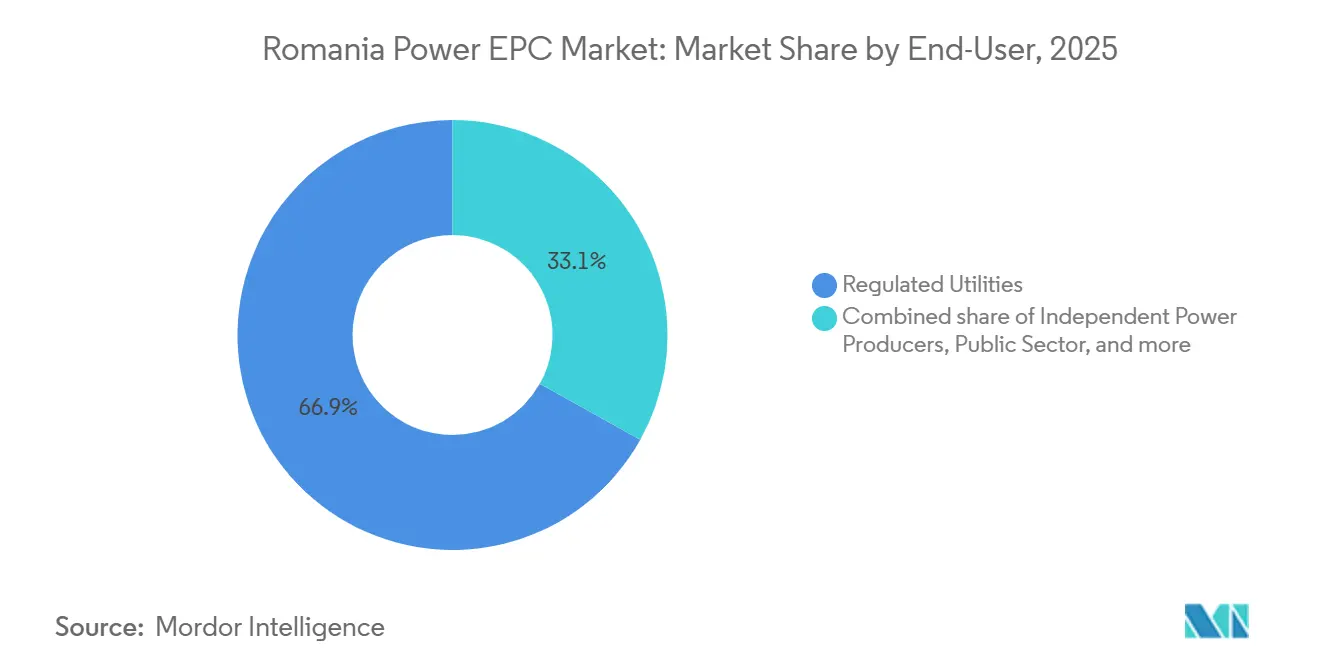
- By end-user, regulated utilities accounted for 66.9% of Romania's power generation EPC market share in 2025, while independent power producers (IPPs) recorded the highest projected CAGR at 11.3% through 2031.
Note: Market size and forecast figures in this report are generated using Mordor Intelligence’s proprietary estimation framework, updated with the latest available data and insights as of January 2026.
Romania Power EPC Market Trends and Insights
Drivers Impact Analysis*
| Driver | (~) % Impact on CAGR Forecast | Geographic Relevance | Impact Timeline |
|---|---|---|---|
| EU-backed 5 GW CfD scheme for on-shore wind & solar | +2.8% | National, concentrated in Dobrogea, Banat, and Oltenia regions | Medium term (2-4 years) |
| Modernisation-Fund-financed grid digitalisation wave | +1.5% | National, with priority corridors in Transylvania and Muntenia | Long term (≥4 years) |
| Accelerated coal phase-out driving replacement CAPEX | +2.1% | Oltenia and Hunedoara coal basins; replacement capacity dispersed nationally | Medium term (2-4 years) |
| Building-renovation program bundling rooftop PV + HVAC EPC | +0.9% | Urban centers (Bucharest, Cluj-Napoca, Timișoara, Iași) and peri-urban municipalities | Long term (≥4 years) |
| Offshore-wind framework unlocking Black Sea pilot farms | +1.2% | Constanța maritime zone, with onshore grid reinforcement in Dobrogea | Long term (≥4 years) |
| Corporate PPAs rising after bilateral-trading reform | +0.7% | Industrial clusters in Prahova, Argeș, Dolj, and Timiș counties | Short term (≤2 years) |
| Source: Mordor Intelligence | |||
EU-Backed 5 GW CfD Scheme Accelerates Renewable Deployment
Romania’s CfD mechanism, capitalized with EUR 3 billion from the EU Modernisation Fund, awarded 4.2 GW across 2024-2025 auctions, surpassing the original 3.5 GW target. Strike prices slid to EUR 35/MWh for solar, underscoring module-cost deflation and lower risk premiums. The 15-year revenue floor enables IPPs to secure project finance below 5%, compressing levelized costs and sharpening competitiveness against regulated utilities. Early movers such as Rezolv Energy and Low Carbon financed the 192 MW Vifor wind farm on these terms, achieving commercial operation by the end of 2025. From January 2026, grid-connection slots above 5 MW are auctioned with financial guarantees, filtering speculative bids and prioritizing shovel-ready assets.[1]
Modernisation-Fund-Financed Grid Digitalisation Unlocks Hosting Capacity
Transelectrica’s 2024-2033 plan allocates EUR 56.2 million to deploy solar-and-storage systems at 29 substations, replacing diesel sets and enabling black-start capability.[2] Complementary distribution upgrades include a EUR 100 million EBRD loan to PPC-owned Rețele Electrice for 500,000 smart meters and a EUR 200 million EIB facility to Electrica Group’s DEER for SCADA rollouts, trimming technical losses below 8%. Four new 400 kV corridors will evacuate offshore wind and integrate CfD-awarded solar, relieving curtailment that currently reaches 12% in Dobrogea. Government targets call for 2 GW of battery storage by 2026, providing frequency services and deferring USD 300 million of transmission CAPEX.
Accelerated Coal Phase-Out Drives Replacement CAPEX Wave
Romania aims to retire 2.25 GW of coal by 2032; interim derogations extend key units to 2029 for grid security. CE Oltenia’s pivot mixes 1,325 MW of gas and 690 MW of solar, although scheduling slippage has shifted gas completions to 2028. Gas backfill also includes Romgaz’s 430 MW Iernut CCGT, featuring 56% efficiency and carbon-capture readiness. Private developers are layering renewables and storage onto legacy coal sites, leveraging extant grid ties while absorbing displaced labor. Coal-reserve refurbishments, exemplified by Rovinari Unit 5’s EUR 100 million overhaul, underscore the urgency for dispatchable gas and storage as renewable penetration deepens.
Building-Renovation Program Bundles Rooftop PV and HVAC EPC
The Casa Verde Fotovoltaica scheme disbursed RON 3 billion to 87,500 households, covering up to 90% of rooftop-solar costs, while REPowerEU added EUR 1.2 billion for 60,000 more systems. Integrating photovoltaics with HVAC upgrades steers procurement toward contractors with dual mechanical-electrical capabilities, prompting Simtel Team and Monsson Group to launch residential divisions. Municipal add-ons such as Bucharest’s RON 150 million battery-plus-solar program aim to co-finance 385 MW and enroll assets in demand-response markets. Vocational partnerships with Transelectrica and Electrica trained 2,400 installers in 2024, narrowing the 40% skilled-labor gap. Yet rural permitting delays of up to 12 months nudge households toward off-grid systems that bypass conventional EPC channels.
Restraints Impact Analysis*
| Restraint | (~) % Impact on CAGR Forecast | Geographic Relevance | Impact Timeline |
|---|---|---|---|
| Chronic grid-connection bottlenecks & curtailment risk | -1.4% | Dobrogea, Banat, and Oltenia renewable-rich zones | Medium term (2-4 years) |
| FDI screening ≥€2 m delaying foreign EPC awards | -0.8% | National, disproportionately affecting Chinese, Russian, and Middle Eastern investors | Short term (≤2 years) |
| Domestic skilled-labour shortage in high-voltage projects | -0.6% | National, acute in Transylvania and Muntenia transmission corridors | Long term (≥4 years) |
| Performance-guarantee escalation squeezing SME cash-flows | -0.5% |
National, concentrated among contractors with |
Short term (≤2 years) |
| Source: Mordor Intelligence | |||
Grid-Connection Bottlenecks and Curtailment Risk Compress Returns
Hosting capacity in Dobrogea is saturated, forcing curtailment of up to 12% of wind output and delaying approvals for the 2.75 GW CfD tranche by as long as 24 months. From 2026, 400 kV build-outs and a financial-guarantee-based queue attempt to triage projects, yet developer capital remains locked for up to 18 months. Battery storage offers a hedge: Nova Power & Gas commissioned a 200 MW/400 MWh standalone system in December 2025, capturing frequency revenues that offset curtailment. National storage targets of 2 GW by 2026 could defer USD 300 million in transmission upgrades, but medium-voltage connection studies in Brăila and Constanța still face 9-12-month backlogs.
FDI Screening Above EUR 2 Million Delays Foreign EPC Awards
Romania’s FDI filter subjects non-EU investors to a 45-day review, extendable to 90 days, delaying financial close by four-to-six months. Mytilineos experienced a four-month lag on a 2 GW project pipeline acquisition in 2024, pushing CODs into 2027. Chinese vendors JinkoSolar and Trina Solar now ship equipment-only packages below the threshold, ceding EPC margin to local firms. Policy debate to lift the cap to EUR 5 million lacks a definitive timetable, keeping deal pipelines vulnerable to administrative drag.
*Our forecasts treat driver/restraint impacts as directional, not additive. The impact forecasts reflect baseline growth, mix effects, and variable interactions.
Segment Analysis
By Technology: Renewables Extend Lead as Grid Bottlenecks Ease
Renewables seized 71.8% of the Romania power generation EPC market in 2025 and are forecast to grow at a 10.7% CAGR through 2031, anchored by the 4.2 GW CfD pipeline. Wind remains dominant at 3 GW installed, but solar is closing fast as OMV Petrom’s Brazi complex adds 400 MW and CE Oltenia’s 690 MW portfolio advances toward 2026 COD. Offshore wind could inject 3-7 GW by 2035 under the new Black Sea framework, dwarfing legacy coal capacities and reshaping dispatch patterns. Gas-fired CCGTs such as Romgaz’s 430 MW Iernut plant provide mid-merit flexibility, while nuclear stays a 1.4 GW baseload anchor through the EUR 1.9 billion Cernavoda Unit 1 overhaul. The Romania power EPC industry is therefore pivoting toward integrated renewable-and-storage portfolios that minimize curtailment and monetize ancillary services.

By Capacity Band: Distributed Energy Surges on Corporate Demand
The 100 to 499 MW tier held 65.1% share in 2025, reflecting utility-scale wind and solar parks tied to CfD awards.[3] Yet sub-100 MW assets are rising at a 12.1% CAGR as industrials deploy captive solar to lock in sub-EUR 40/MWh tariffs; Automobile Dacia’s 36 MW array at Mioveni exemplifies this trend.[4] Hybrid projects co-locating 50 MW wind, 35 MW solar, and 24 MWh batteries highlight evolving design norms aimed at arbitraging day-ahead and balancing markets. Above-500 MW capacity will re-emerge once Black Sea offshore wind enters execution, inserting high-voltage direct-current links into the Romania power generation EPC market roadmap.
By End-User: IPPs Gain Ground Amid PPA Boom
Regulated utilities commanded 66.9% of Romania's power generation EPC market size in 2025, led by Transelectrica, Hidroelectrica, and Nuclearelectrica. IPPs, however, are expanding at 11.3% CAGR, leveraging CfD cash-flow visibility and corporate PPAs to finance pipelines above 3.4 GW. Industrial off-takers embrace self-generation and virtual PPAs, prompting utilities to invest in grid services and reserve margins rather than pure generation.
Geography Analysis
Dobrogea, Banat, and Oltenia dominate project allocation, absorbing most of the 4.2 GW CfD awards because of superior wind and solar resources. Dobrogea already hosts 3 GW of onshore wind and is earmarked for 4.9 GW of offshore capacity; the Constanța Nord–Medgidia Sud 400 kV upgrade, due 2029, will curtail losses now hitting 12%. Oltenia pivots from coal to gas and solar, with CE Oltenia’s 690 MW PV portfolio and Romgaz’s 430 MW Iernut CCGT slated for 2026-2028 completion. Banat and Transylvania are magnets for industrial captive power; OMV Petrom’s Brazi hub in Prahova feeds automobile and petrochemical clusters.
Urban centers, Bucharest, Cluj-Napoca, Timișoara, and Iași, benefit from rooftop solar subsidies and municipal battery schemes that defer distribution upgrades. Muntenia and Moldova lead in smart-meter density as PPC-owned Rețele Electrice deploys 1.7 million meters, while DEER hardens medium-voltage lines across 42 counties with EIB backing. The Black Sea offshore zone promises long-run job creation, port revitalization, and turbine manufacturing, contingent on timely HVDC rollouts and supply-chain localization.
Despite these opportunities, medium-voltage connection studies in Brăila, Constanța, and Tulcea face 9-12-month backlogs, squeezing developer returns and deterring smaller IPPs. Government storage incentives aim to smooth load profiles and postpone expensive transmission expansion, yet administrative friction persists in rural distribution queues.
Regulatory Landscape
Romania's power EPC activity is structured around an EU-aligned electricity market and permitting framework under the National Energy Regulatory Authority (ANRE). ANRE issues the relevant sector licenses and authorizations under its licensing regulation, including updates introduced via ANRE Order 6/2025. In January 2026, grid-connection capacity allocation for projects above 5 MW moved to an auction-based mechanism backed by financial guarantees, which has reshaped how developers secure connection slots and sequence EPC-related milestones with permitting and financing.
ANRE also added secondary measures in 2026 to operationalize participation rules. ANRE Order 9/2026 (April 2026) set rules for renewable energy communities to participate in wholesale markets and clarified storage use, while ANRE Order 16/2026 (May 2026) amended the license and authorization regime for the electricity sector. At the strategy level, Government Decision 1491/2024 approved Romania's Energy Strategy 2025-2035 (with a 2050 perspective), and the updated NECP framework keeps energy-efficiency targets central for program-backed investments that feed into generation and grid EPC tendering.
Competitive Landscape
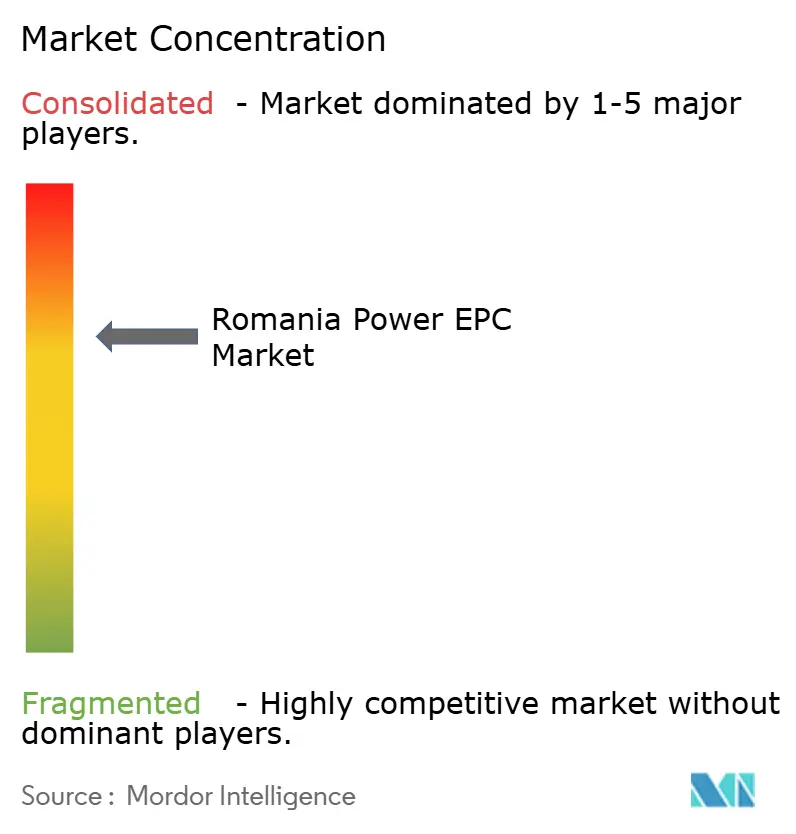
The Romania power EPC market shows moderate concentration: state-owned Transelectrica, Hidroelectrica, Nuclearelectrica, and CE Oltenia account for roughly 40% of CAPEX via captive procurement. European majors Enel, Siemens, ABB, and Schneider Electric command about 25% through technology supply and turnkey services, while Greek entrants Mytilineos and PPC Renewables, and local integrators Simtel Team and Monsson Group split most of the balance. State firms focus on refurbishment, Hidroelectrica’s EUR 188 million Vidraru upgrade, and Nuclearelectrica’s EUR 1.9 billion Cernavoda overhaul, whereas IPPs chase greenfield renewables funded by CfDs and PPAs.
Large-scale storage signals a white-space opportunity; Nova Power & Gas’s 200 MW/400 MWh system in Cluj sets a domestic benchmark. Offshore wind, led by Bluebridge Energy, Parkwind, and Ocean Winds, remains unconsolidated, providing entry for specialized marine EPC contractors. Bond-requirement hikes to 10-15% accelerate consolidation, favoring firms with robust balance sheets. Chinese module suppliers pivot to equipment-only contracts to bypass FDI filters, ceding EPC margin to local firms yet retaining module share via competitive pricing.
Technology differentiation is sharpening: Siemens and GE Vernova vie for gas-turbine orders that replace coal, while ABB and Schneider Electric deploy grid-automation suites aligned with Transelectrica’s digitalization drive. Nuclearelectrica’s merger with SNN introduces North American EPC standards, potentially disrupting established European nuclear contractors.
Romania Power EPC Industry Leaders
-
Transelectrica SA
-
Electrica SA (DEER & Sunwind)
-
Mytilineos SA
-
Hidroelectrica SA
-
Siemens AG
- *Disclaimer: Major Players sorted in no particular order
Market Opportunities and Future Outlook
The near-term execution pool for EPC contractors is expanding as utilities move from approvals into tenders and contract awards across renewables, storage, and gas flexibility. In May 2026, Hidroelectrica published tender documentation for floating solar of around 90 MW together with 200 MW/800 MWh of battery storage across five Lower Olt River locations, which typically favors EPCs that can bundle civil scope, electrical work, and grid-interface design into a single delivery plan. In June 2026, Electrica (via New Trend Energy) signed an EPC contract for the 62.5 MWp Satu Mare 3 photovoltaic project, and in July 2026 Electrica secured grid approvals for a 700 MWh BESS portfolio, reinforcing demand for storage-ready designs and connection-study capability.
On the generation side, EPC scope is widening beyond pure renewables toward dispatchable replacement capacity and hybridization aimed at curtailment and connection constraints. Romania's CfD-driven renewables pipeline, combined with the January 2026 shift to auction-based grid capacity allocation above 5 MW, is pushing developers toward PV plus BESS offerings with more bankable grid-access pathways. Gas-fired execution is also generating larger EPC packages: Romgaz reiterated end-2026 commissioning for the 430 MW Iernut plant, while government-level discussions in February 2026 around the 1,700 MW Mintia gas-fired project pointed to 2026 test commissioning and a September 2026 start date target for electricity production, supporting demand for EPC services that cover complex commissioning and grid synchronization.
Recent Industry Developments
- June 2026: Electrica SA, through its subsidiary New Trend Energy, signed an EPC contract worth around EUR 27.9 million for the 62.5 MWp Satu Mare 3 photovoltaic project. The award moved the asset from development into construction and added near-term EPC volume tied to a utility-backed pipeline.
- April 2026: Transelectrica operationalized a new data center to strengthen cybersecurity for the National Electricity Transmission Network, financed with EUR 8.44 million through the PNRR program. The project supports grid digitalization and raises requirements for secure data and communications integration across transmission EPC works.
- June 2024: Rezolv Energy and Low Carbon, via First Look Solutions, placed an order with Vestas for the 192 MW Vifor onshore wind project in south-eastern Romania, including 30 V162-6.2 MW EnVentus turbines configured in 6.4 MW mode. The order underlined continued execution of utility-scale wind packages and sustained demand for balance-of-plant EPC services in Romania's high-resource regions.
Research Methodology Framework and Report Scope
Market Definition and Coverage
For this study, the market is defined as revenue generated from engineering, procurement, and construction services delivered for Romania's electricity infrastructure. This includes both power generation facilities and transmission and distribution network projects.
Scope exclusions: We exclude routine operations and maintenance, electricity trading, and pure equipment sales that are not part of an EPC or turnkey project contract.
Segmentation Overview
-
Power Generation EPC
-
By Technology
- Thermal
- Nuclear
- Renewables
-
By Capacity Band
- Up to 100 MW (DER, micro-grid)
- 100 to 499 MW
- Above 500 MW
-
By End-User
- Regulated Utilities
- Independent Power Producers
- Industrial Captive Power
- Public Sector and SOE
-
By Technology
- Power Transmission and Distribution (T&D) EPC
Data Sources, Market Sizing, and Validation
Desk Research
Desk research helped us build the starting structure for the model and align project activity with Romania level power indicators. We referenced public sources such as the National Energy Regulatory Authority (ANRE) publications, the national transmission system operator updates, Eurostat energy and construction output series, and European Commission energy policy and funding notes, which were then cross-checked against tender notices and project announcements.
To keep the sizing realistic, we also reviewed company annual reports, investor presentations, and reputable press coverage to map typical EPC contract content and timing. Where available, paid subscription sources covering company financials and those covering public tenders were used to confirm order intake patterns and award values at a high level. The desk sources mentioned are illustrative, and additional public documents and publications were used for clarification and cross-checking.
Primary Interviews and Surveys
Interviews and surveys with CXOs, functional and unit leaders, managers, utilities, independent power producers, contractors, equipment providers, and public-sector project stakeholders in Romania clarify project timing, EPC scope, pricing, procurement delays, and cost assumptions. Follow-up checks are used when respondent input differs from desk data, particularly for project schedules and investment values.
Distribution of primary research fieldwork respondents
| Company type | Respondent position |
|---|---|
| Top tier: 28% | CXOs: 18% |
| Mid tier: 47% | Functional/Unit leaders: 32% |
| Smaller Players: 25% | Managers: 50% |
Market-Sizing & Forecasting
Sizing starts from a top-down build where national generation additions and grid investment signals are translated into an EPC demand pool for Romania, then split across generation EPC and transmission and distribution EPC. After that first pass, we corroborate it using selective bottom-up approximations, including sampling announced project capex, applying typical EPC share of total capex, and running supplier and channel checks on large awarded packages.
Model inputs include planned capacity additions by technology, grid reinforcement and interconnection project pipelines, tender award values and timing, typical EPC scope share versus owner-supplied equipment, and the average construction cycle by project type. Because project timing is a recurring gap area, we used a simple scenario analysis to bracket commissioning slippage and procurement lead time shifts, then selected a central case based on interview consensus. Where public project values were missing, gap handling used proxy ranges from similar Romania projects, followed by adjustment when new tenders or award disclosures were found.
Data Validation & Update Cycle
Outputs were checked against independent signals such as annual power sector investment patterns, major grid upgrade milestones, and the pace of renewable and conventional project awards. When variances looked unusual, we reviewed them in a second pass, and we made follow-up calls when a single project or policy update could materially change the annual total.
Before sign-off, the full model and assumptions go through multi-step internal review so the logic and math remain consistent across segments and years. The report is refreshed annually, with interim updates when material events occur, such as large tender waves, major permitting changes, or shifts in funding program execution. Right before delivery, an analyst does a final verification sweep so clients receive the latest view available.
Mordor Intelligence's Romania Power Epc Market Size Measured Against Other Published Estimates
Published market values can differ because the scope line is not identical and because project timing is handled differently across sources. In EPC, a single year can swing when large grid packages slip, or when a few generation projects reach financial close and start booking engineering and procurement work.
Standalone equipment sales and routine O&M sit outside Mordor Intelligence's scope here, which is one reason the 2025 value can look larger or smaller versus estimates that mix EPC with broader power construction spending or equipment revenue. Other gaps typically come from how generation versus T&D is split, whether announced projects are counted before award, and whether currency conversion uses a single-year average rate or a multi-year smoothing approach.
Benchmark comparison
| Source | Market Size | Gaps in Research Methodology |
|---|---|---|
| Mordor Intelligence | USD 6.98 B (2025) | |
| Global Consultancy A | USD 0.16 B (2024) | This figure appears to size a narrower spend pool, where only select EPC service lines or a subset of project types are counted, and large T&D packages are not fully reflected in the same way. |
| Industry Publisher B | USD 1.80 B (2026) | This estimate is anchored to a different base window and may emphasize forward pipeline conversion, so multi-year tender waves and schedule assumptions can shift value into later years compared with a revenue recognition view. |
The spread across the three numbers mainly traces back to what is included as EPC revenue and how project timing is mapped into calendar years. When the same scope and timing rules are applied consistently, the totals become easier to reconcile with Romania's visible project pipeline and grid investment signals.
Key Questions Answered in the Report
How large is Romania's power EPC opportunity today and what is its growth pace through 2031?
Total EPC spending reached USD 7.69 billion in 2026 and is projected to climb to USD 12.14 billion by 2031, equal to a 9.56% compound annual growth rate.
Which project-types capture the majority of current engineering, procurement, and construction spending?
Power-generation work accounts for 64.6% of 2025 activity, led by renewables that already hold 71.8% share and are expanding at a 10.7% CAGR.
How is the Contracts for Difference scheme reshaping investment decisions?
The EU-backed CfD program has awarded 4.2 GW of capacity across two auctions with 15-year revenue guarantees; the visibility allows developers to raise sub-5% project debt and bid solar as low as EUR 35/MWh, accelerating project pipelines to 2028.
What role will battery storage play over the next five years?
Government targets call for 2 GW of storage operating by end-2026, highlighted by Nova Power & Gas's 200 MW/400 MWh system commissioned in 2025; storage earns frequency-regulation revenue, mitigates curtailment, and can defer roughly USD 300 million in grid upgrades.
How significant are coal-replacement and gas projects in maintaining grid stability?
Romania plans to retire 2.25 GW of coal by 2032; replacement includes 1,325 MW of gas-fired capacity from CE Oltenia and Romgaz's 430 MW Iernut CCGT, both designed for fast-ramp and black-start capability that complements intermittent renewables.
What administrative or financial hurdles could slow project execution?
Grid-connection studies can stretch 9-12 months in high-resource zones, foreign-investment reviews over EUR 2 million add up to 90 days, and banks now require 10-15% performance bonds, all of which raise working-capital needs and lengthen construction schedules.