
Reverse Factoring Market Size and Share
Market Overview
| Study Period | 2020 - 2031 |
|---|---|
| Market Size (2026) | USD 0.74 Trillion |
| Market Size (2031) | USD 1.09 Trillion |
| Growth Rate (2026 - 2031) | 8.12 % |
| Fastest Growing Market | Asia-Pacific |
| Largest Market | Europe |
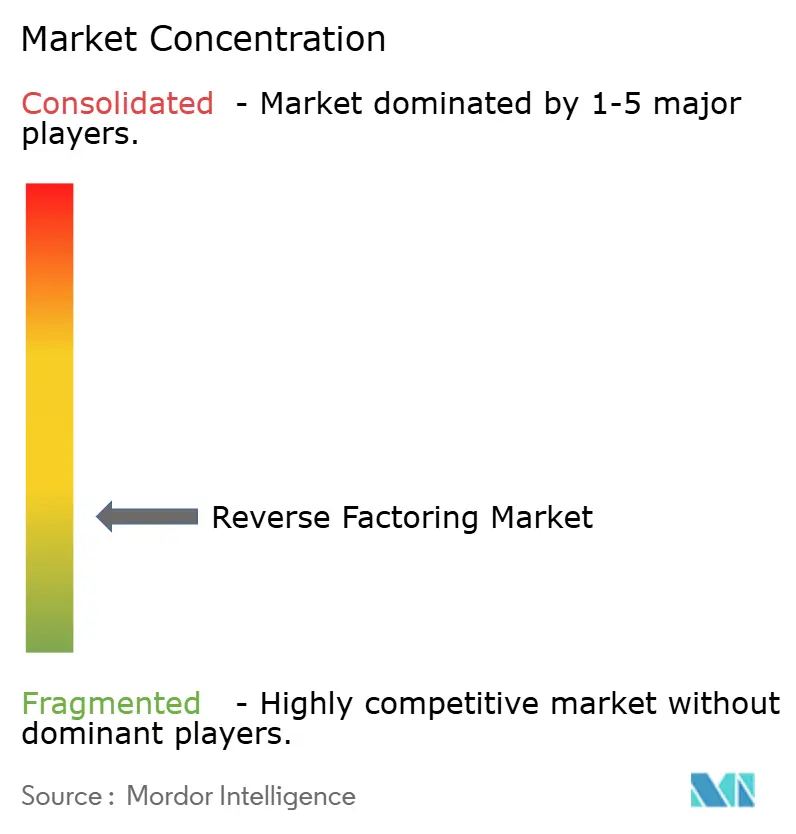
| Market Concentration | Low |
Major Players *Disclaimer: Major Players sorted in no particular order Image © Mordor Intelligence. Reuse requires attribution under CC BY 4.0. | |
Reverse Factoring Market Analysis by Mordor Intelligence
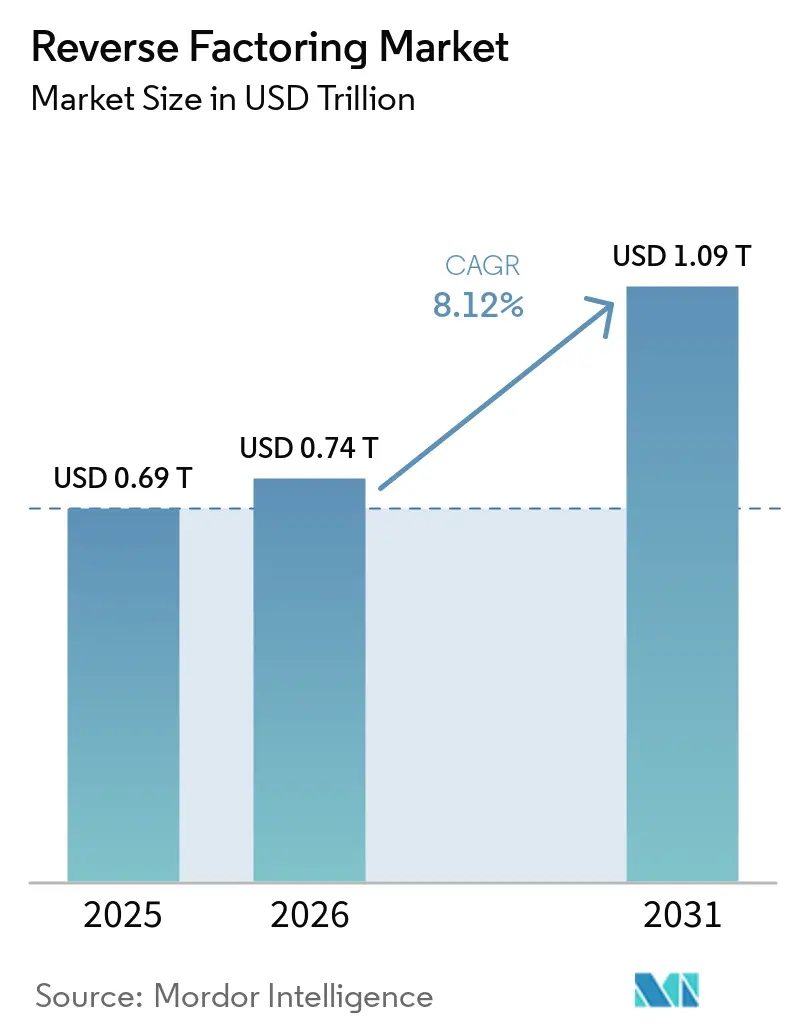
The Reverse Factoring Market size is expected to increase from USD 0.69 trillion in 2025 to USD 0.74 trillion in 2026 and reach USD 1.09 trillion by 2031, growing at a CAGR of 8.12% over 2026-2031.
The reverse factoring market is moving beyond its earlier role as a treasury tool, as large buyers now use these programs to support supplier liquidity within procurement and accounts payable workflows. Global approved payables finance volume reached USD 2,462 billion in 2024, up 8% year over year, indicating that the demand base supporting the reverse factoring market remained firm even as traditional trade finance conditions remained uneven. Working capital pressure has remained a major driver, as average accounts payable payment terms among large corporates reached 41 days by late 2024, widening the funding gap for suppliers and strengthening demand for buyer-backed liquidity programs in the reverse factoring market. Europe led the reverse factoring market with 39.12% revenue share in 2025, while Asia-Pacific is set to post the fastest regional growth at 10.27% through 2031, which shows that mature banking systems still anchor volume while export-led Asian economies are driving the next phase of expansion. Competition in the reverse factoring market remains active across global banks and digital platform providers, and that balance is creating room for multi-funder models, ERP-linked onboarding, and ESG-linked financing structures to scale through the forecast period.
Key Report Takeaways
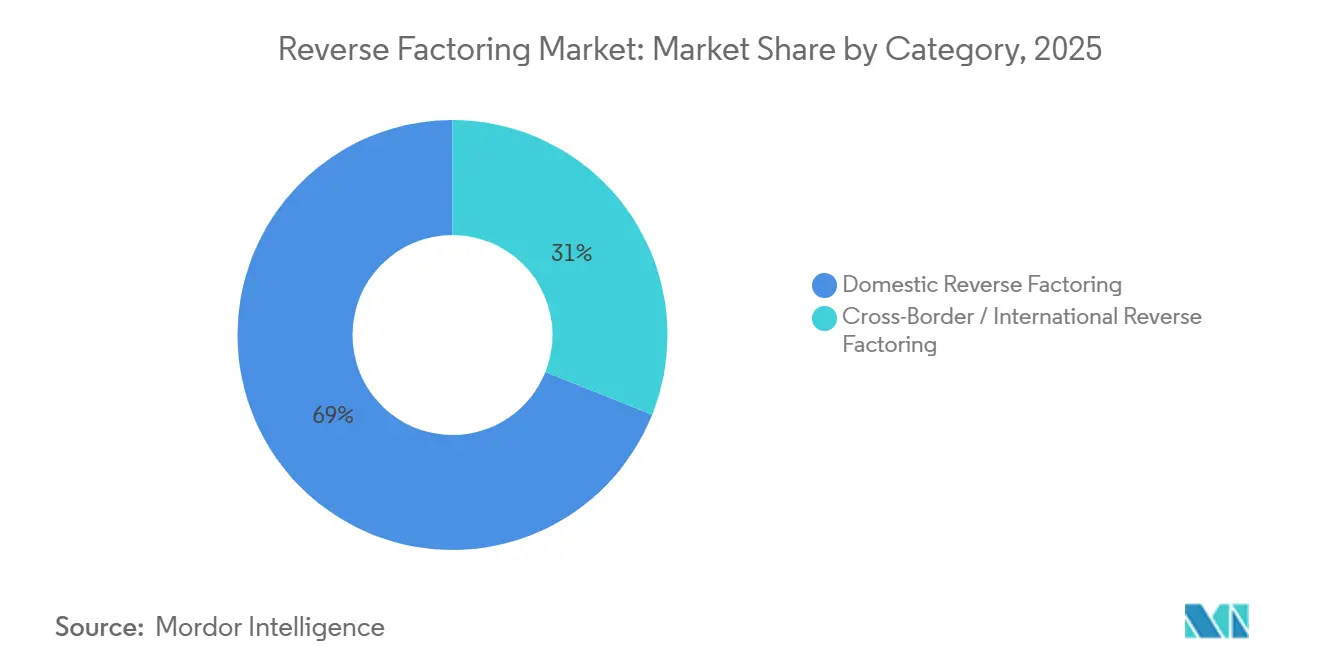
- By category, domestic programs held 68.96% of the reverse factoring market share in 2025, while cross-border and international programs are forecast to grow at 10.77% CAGR through 2031.
- By end-use industry, manufacturing accounted for 21.03% of the reverse factoring market size in 2025, while retail and e-commerce are projected to expand at 11.43% CAGR through 2031.
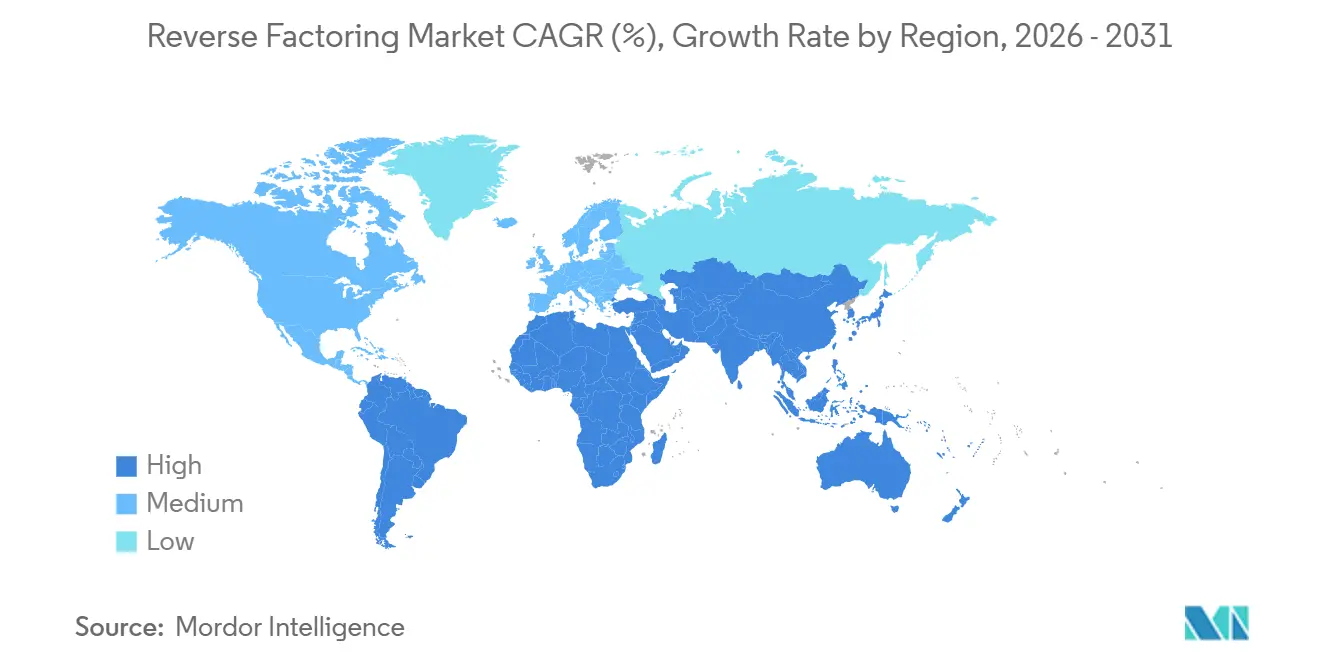
- By geography, Europe captured 39.12% of the reverse factoring market share in 2025, while Asia-Pacific is forecast to grow at 10.27% CAGR through 2031.
Note: Market size and forecast figures in this report are generated using Mordor Intelligence’s proprietary estimation framework, updated with the latest available data and insights as of January 2026.
Market Trends and Insights
Drivers Impact Analysis of Reverse Factoring Market*
| Driver | (~) % Impact on CAGR Forecast | Geographic Relevance | Impact Timeline |
|---|---|---|---|
| Rising Working Capital Pressure Across Supplier Networks | +2.0% | Global, with concentrated impact in North America and Europe | Short term (≤ 2 years) |
| Buyer-Led Liquidity Programs Embedded in Procurement and AP Workflows | +1.8% | Global, with early gains in North America and Western Europe | Medium term (2-4 years) |
| Expansion of Fintech-Enabled Multi-Funder Platforms | +1.5% | Global, accelerating in Asia-Pacific and Middle East and Africa | Medium term (2-4 years) |
| Digitization of Invoice Validation and Risk Scoring | +1.3% | Global, with Asia-Pacific spillover into the Middle East and Africa | Medium term (2-4 years) |
| ESG and Sustainable Supplier Finance Programs | +0.9% | Europe and North America, with emerging adoption in the Asia-Pacific | Long term (≥ 4 years) |
| Cross-Border Trade Complexity and Extended Payment Cycles | +0.8% | Asia-Pacific, with spillover to South America and Middle East and Africa | Long term (≥ 4 years) |
| Source: Mordor Intelligence | |||
Rising Working Capital Pressure Across Supplier Networks
The reverse factoring market is benefiting from a clear rise in supplier funding pressure because payment terms at large enterprises reached 41 days by late 2024[1]C2FO, “Record-Breaking Year for C2FO Marks Shift in Trade Finance Landscape,” C2FO Newsroom, c2fo.com. The same environment has left many smaller suppliers with fewer low-cost credit options, which makes buyer-backed early payment programs more relevant across the reverse factoring market. The World Supply Chain Finance Report 2025 also showed that approved payables finance volume grew to USD 2,462 billion in 2024, indicating that buyers and suppliers continued to use structured payables finance even under tighter liquidity conditions. This matters for the reverse factoring market because the product directly aligns the supplier’s access to funds with the buyer’s credit standing rather than the supplier’s standalone borrowing profile. As a result, the reverse factoring market is seeing demand driven by a real operating need rather than short-term treasury experimentation.
Buyer-Led Liquidity Programs Embedded in Procurement and AP Workflows
The reverse factoring market is also supported by the shift from stand-alone treasury tools to embedded workflow solutions within enterprise software. J.P. Morgan Payments launched a supply chain finance solution integrated with Oracle Fusion Cloud ERP in July 2025, and the company said that the model reduced a typical six-month implementation to a simpler activation process for buyers and suppliers[2]J.P. Morgan Payments, “J.P. Morgan Payments Launches Cutting-Edge Supply Chain Finance Solution with Oracle,” BusinessWire, businesswire.com. SAP Taulia then announced in May 2026 that it had surpassed USD 1.2 trillion in annual transaction volume and introduced an AI-powered Working Capital Agent embedded in SAP Joule, demonstrating how the reverse factoring market is moving closer to native workflow execution within ERP systems. The reverse factoring program adoption is tied to financing costs, fairness, and standardization, and the ERP-linked structures favor standardization because invoice and payment data are already within the operating system. This is raising switching costs for buyers and gradually making platform integration a bigger competitive factor in the reverse factoring market.
Expansion of Fintech-Enabled Multi-Funder Platforms
The reverse factoring market is gaining capacity from multi-funder models, which reduce the constraints that single-bank programs can face during periods of higher demand or tighter credit conditions. C2FO surpassed USD 500 billion in cumulative working capital funding in March 2026, and the company tied that scale to a partner network that included 16 bank partners and 17 new Dynamic Supplier Finance programs signed in 2024. The IFC recognized this model in April 2026, naming C2FO its Best Supply Chain Trade Partner for 2026 and highlighting the platform’s role in closing financing gaps in emerging markets. FIS Supply Chain Finance Platform was also selected by Glencore in May 2026 for a USD 2.55 billion trade receivables securitization, demonstrating that platform-led models are now participating in structures operating at a very large scale[3]FIS, “FIS Supply Chain Finance Platform Powers Landmark $2.55 Billion Glencore Oil and Gas Trade Receivables Securitization,” BusinessWire, businesswire.com. These developments are narrowing the practical gap between bank-led and platform-led execution across the reverse factoring market.
Digitization of Invoice Validation and Risk Scoring
The reverse factoring market is becoming easier to scale as invoice validation and credit screening move toward more automated digital processes. FCI reported that 50% of financial institutions now accept e-invoicing, and that more than 61% of invoices within those systems are processed electronically, indicating a stronger operating base for supplier finance workflows. The World Supply Chain Finance Report 2025 also cited an early 2024 analysis showing that AI adoption in supply chain and inventory management reduced costs by 63% for early adopters, supporting the case for lower operating costs in digital onboarding and invoice handling[4]BCR Publishing and Citi, “World Supply Chain Finance Report 2025,” Citi, citigroup.com. The same report cited a Bank of England survey showing that 16% of financial services firms already used AI for credit risk assessment, and another 19% planned to adopt it, indicating that risk automation is moving into mainstream financial workflows. SAP Taulia’s Extended Flow with Payables release in May 2026 further illustrated how the reverse factoring market is shifting toward invoice-level optimization that can defer buyer payments while still funding suppliers early.
Restraints Impact Analysis of Reverse Factoring Market*
| Restraint | (~) % Impact on CAGR Forecast | Geographic Relevance | Impact Timeline |
|---|---|---|---|
| Supplier Dependence on Buyer-Nominated Funding Partners | -0.5% | Global, more acute in Asia-Pacific and emerging markets | Short term (≤ 2 years) |
| Disclosure, Accounting, and Reputational Sensitivity Around Supply Chain Finance Structures | -0.4% | Europe and North America, mainly in IFRS-adopting markets | Medium term (2-4 years) |
| Onboarding Friction for Smaller Suppliers and Low-Digital-Maturity Networks | -0.4% | Asia-Pacific, the Middle East and Africa, and South America | Medium term (2-4 years) |
| Legal and Operational Complexity in Multi-Jurisdiction Programs | -0.3% | Cross-border programs globally, with a concentration in Asia-Pacific and Middle East and Africa | Long term (≥ 4 years) |
| Source: Mordor Intelligence | |||
Supplier Dependence on Buyer-Nominated Funding Partners
The reverse factoring market still carries concentration risk when a buyer relies on a sole or primary funding partner for supplier payments. In that structure, suppliers depend on a financing relationship they did not choose and cannot easily replace, which can weaken program resilience if capacity tightens or pricing changes. Multi-funder structures offer a practical response to this issue, but the adoption among mid-market buyers remains slower than broad industry commentary sometimes suggests. This means the reverse factoring market still faces a meaningful execution gap between the largest, better-diversified programs and the rest of the addressable buyer base.
Disclosure, Accounting, and Reputational Sensitivity Around Supply Chain Finance Structures
The reverse factoring market is also being shaped by tighter scrutiny of disclosure and classification for supplier finance arrangements. Companies now have stronger incentives to review whether program liabilities belong in trade payables or borrowings, and that issue matters because balance sheet treatment can affect how investors and lenders interpret liquidity quality. The IFRS Foundation noted in its January 2026 IASB update that classification and related guidance issues were still under discussion, suggesting that the policy-setting for the reverse factoring market remains active rather than settled. For large multinational buyers, that uncertainty can slow expansion, reshape program communication, and increase caution around the visible scaling of the reverse factoring market.
*Our forecasts treat driver/restraint impacts as directional, not additive. The impact forecasts reflect baseline growth, mix effects, and variable interactions.
Reverse Factoring Market Segment Analysis
By Category:
Domestic Programs Anchor Market, Cross-Border Volume AcceleratesDomestic programs accounted for 68.96% of the reverse factoring market share in 2025, which kept this category in the leading position across the full segment mix. That outcome reflected the simpler setup of single-jurisdiction structures, the deeper banking relationships available in mature markets, and the lower legal and operating burdens associated with domestic execution. The reverse factoring market has therefore continued to rely on domestic programs as the main revenue base, especially in Europe and North America, where buyer-led payables finance is already integrated into large enterprise finance operations. A March 2026 analysis of Germany’s DAX-40 companies described reverse factoring as a treasury standard among large corporates, which supports the view that domestic programs remain deeply embedded in mature enterprise environments. This category continues to benefit from fewer cross-border legal variables, fewer foreign exchange complications, and faster program deployment cycles than international structures.
Cross-border and international reverse factoring is projected to grow at 10.77% CAGR between 2026 and 2031, making it the fastest-growing category in the reverse factoring market. This growth path reflects the financing needs of supplier networks that now stretch across export-oriented manufacturing corridors, especially in Southeast Asia. FCI reported that international factoring grew by 12% in 2024, while global trade volumes rose by only 2%, suggesting a stronger role for financing-led trade support. Drip Capital also surpassed USD 9 billion in cumulative cross-border trade finance transactions by April 2026, across more than 11,000 businesses in 100+ countries, showing that digital players are capturing a share of the volume that traditional bank structures have not served efficiently. The reverse factoring industry is therefore seeing the category shift toward international use cases, even as domestic programs still account for most current revenue.


By End-Use Industry:
Manufacturing Leads, Retail and E-Commerce Reshape DemandManufacturing held 21.03% of the reverse factoring market share in 2025, which made it the largest end-use segment in the report. The segment’s lead came from long procurement cycles, large supplier bases, and high invoice values, all of which improve the economic fit of buyer-led liquidity programs. The reverse factoring market has remained especially relevant for manufacturers because original equipment makers often manage large vendor networks that need predictable cash conversion and orderly receivables treatment. The active participation from transport and logistics, healthcare, IT and telecommunications, construction, automotive, and energy and utilities shows that adoption is already broad, even though manufacturing leads.
Retail and e-commerce are projected to expand at 11.43% CAGR from 2026 to 2031, making it the fastest-growing end-use segment in the reverse factoring market. This reflects the operating model of digital-native retailers that work with very large supplier networks and often manage thin margins across high transaction volumes. Large retailers have extended payment terms to 60 to 90 days or more, increasing the need for structured supplier funding that can preserve network stability without altering buyer liquidity objectives. The rise of B2B e-commerce and omnichannel retail is also strengthening demand for embedded supplier finance tools that activate at invoice approval inside the transaction flow. The reverse factoring industry is therefore seeing retail and e-commerce become a major growth engine, even though manufacturing still anchors the largest installed base.
Geography Analysis
Europe Reverse Factoring Market
Europe accounted for 39.12% of the reverse factoring market in 2025, maintaining its leading position by revenue. This lead reflects a mix of market maturity, established buyer-led programs, regulatory attention to payment terms, and the strong role of European banks in approved payables finance. Assifact reported that Italy’s factoring turnover reached EUR 289.1 billion (USD 340.07 billion) in 2025 and that supply chain finance operations grew 6.91% year over year through April 2026, which supports the view that core European markets remained active in 2026. The European Investment Bank and Santander also signed guarantee agreements in March 2026 that enabled EUR 900 million (USD 1,058.7 million) in new supply chain finance for companies in strategic sectors, showing that public-backed capital support is reinforcing commercial program activity. Europe’s scale in the reverse factoring market, therefore, still rests on both private banking depth and supportive institutional capital channels.
APAC Reverse Factoring Market
Asia-Pacific is forecast to grow at a 10.27% CAGR through 2031, making it the fastest-growing region in the reverse factoring market. The region’s volume base remains concentrated in China, Japan, and South Korea, while Southeast Asian economies such as Vietnam, Indonesia, Thailand, and Malaysia have a sharper adoption edge due to their export-oriented manufacturing structures. India stood out because factoring volumes surged 120% in the 2024 reporting period, making it the fastest-growing major factoring market referenced in the report. India’s program universe is also expanding, as the Reserve Bank of India’s TReDS mandate, effective from March 2025, requires Central Public Sector Enterprises and companies with annual revenues above INR 250 crore (USD 29 million) to register. Singapore and Australia continue to serve as important regional hubs for cross-border administration and program management across the wider Asia-Pacific corridor.
The Americas and MEA Reverse Factoring Market
North America maintains a large installed base in the reverse factoring market, as the World Supply Chain Finance Report 2025 noted that the region accounted for 49% of global approved payables finance volume in 2024. The same source showed that regional growth was 4% year over year through November 2024, which suggests that North America is now in a later-stage upgrade cycle rather than a first-wave adoption phase. South America is benefiting from multilateral capital support, including the IFC and Santander facility announced in June 2025, which is expected to support USD 1.5 billion in supply chain finance transactions over 3 years. The Middle East and Africa remain earlier-stage markets, but Africa delivered the strongest regional performance globally in 2024, with supply chain finance volume growth of 14% to 15% from a low base. The reverse factoring market is therefore split between mature regions that are upgrading their operating models and emerging regions that are still building capacity through digital platforms and development finance support.

Competitive Landscape
The reverse factoring market is divided between 2 broad groups. One group comprises global transaction banks that anchor large buyer programs with balance-sheet funding. The other group is made up of technology-led platforms that compete on onboarding speed, multi-funder access, and enterprise software integration. JPMorgan Chase, HSBC, BNP Paribas, Citigroup, Santander, Barclays, Deutsche Bank, Standard Chartered, and Bank of America are major names in bank-led competition. It also identifies SAP Taulia, C2FO, and PrimeRevenue as important platform-led participants that are expanding program origination through faster onboarding and stronger workflow connectivity.
Strategic execution in the reverse factoring market is increasingly defined by integration and product design. J.P. Morgan Payments launched an Oracle Fusion Cloud ERP-integrated supply chain finance solution in July 2025, with FedEx as the first deployment, and the company said the integration cut implementation timelines from months to a much simpler activation process. SAP Taulia announced in May 2026 that it had exceeded USD 1.2 trillion in annual transaction volume and introduced new AI-enabled working capital tools, demonstrating a clear focus on turning supplier finance into a deeper operating capability within enterprise systems. C2FO crossed USD 500 billion in cumulative funding in March 2026 and then expanded further in emerging markets through the April 2026 launch of CycleFlow in Nigeria with the IFC. These moves show that scale, workflow integration, and geographic expansion are now central to competitive positioning in the reverse factoring market.
Recognition and regional adaptation are also shaping leadership in the reverse factoring market. Global Finance Magazine named Societe Generale Best Supply Chain Finance Provider, Bank, for 2025, while Santander received Best Sustainable SCF Program and Best Customer Implementation, and MUFG won Best Dynamic Discounting Solution. SAP Taulia also launched a Shariah-compliant supply chain finance program for the Saudi Electricity Company in February 2026 with Manafa, which shows how tailored compliance design can help platform providers gain share in the GCC. FIS Supply Chain Finance Platform’s role in Glencore’s USD 2.55 billion receivables securitization also showed that platform providers are moving into larger and more complex structures that were once more closely associated with investment banking channels. The competitive picture in the reverse factoring market, therefore, remains active rather than closed, with large banks still holding deep buyer relationships and digital platforms gaining ground where onboarding speed, product flexibility, and compliance customization matter most.
Reverse Factoring Industry Leaders
SAP Taulia
C2FO
PrimeRevenue
HSBC
FIS Supply Chain
- *Disclaimer: Major Players sorted in no particular order
Reverse Factoring Market Companies Covered in this Report
- C2FO
- SAP Taulia
- PrimeRevenue
- FIS Supply Chain
- Tradeshift
- Finastra
- HSBC
- JPMorgan Chase
- BBVA
- Barclays
- Deutsche Bank
- Societe Generale
- Standard Chartered
- BNP Paribas
- Bank of America
- Citi
- Wells Fargo
- Mizuho Financial Group
- MUFG Bank
- Santander

Recent Industry Developments in Reverse Factoring Market
- May 2026: SAP Taulia announced AI-powered working capital innovations at SAP Sapphire, including a Working Capital Agent embedded in SAP Joule and a new Extended Flow with Payables feature that uses AI to identify optimal invoice mixes for deferred payment and early supplier funding. The company simultaneously disclosed it had surpassed USD 1.2 trillion in annual transaction volume through its platform. General availability of the Working Capital Agent is planned for Q4 2026.
- May 2026: FIS Supply Chain Finance Platform, formerly Demica, was selected by Glencore PLC to support the inaugural trade receivables securitization program for its oil and gas commodity business, with a deal value of USD 2.55 billion. The transaction demonstrated how specialized supply chain finance platforms are participating in large-scale capital markets structures previously dominated by investment banks.
- April 2026: Drip Capital surpassed USD 9 billion in cumulative cross-border trade finance transactions since its founding, serving over 11,000 businesses across 100+ countries. The milestone was announced as United States mid-market businesses accelerated supplier diversification away from China, positioning Drip’s AI-native underwriting platform as a key enabler of this reorientation.
- April 2026: C2FO and the IFC officially launched CycleFlow, a supply chain finance platform for Nigerian MSMEs, representing the first phase of a Nationwide Working Capital Platform strategy for Africa and other emerging markets. The platform had already secured multinational and local customers at launch.


Global Reverse Factoring Market Report Scope
| Domestic Reverse Factoring |
| Cross-Border / International Reverse Factoring |
| Manufacturing |
| Transport and Logistics |
| Information Technology and Telecommunications |
| Healthcare |
| Construction |
| Retail and E-Commerce |
| Automotive |
| Energy and Utilities |
| Other End-Use Industries |
| North America | United States |
| Canada | |
| Mexico | |
| South America | Brazil |
| Argentina | |
| Rest of South America | |
| Europe | United Kingdom |
| Germany | |
| France | |
| Italy | |
| Spain | |
| Rest of Europe | |
| Asia-Pacific | China |
| Japan | |
| India | |
| South Korea | |
| Australia | |
| Indonesia | |
| Thailand | |
| Malaysia | |
| Singapore | |
| Vietnam | |
| Rest of Asia-Pacific | |
| Middle East and Africa | Saudi Arabia |
| United Arab Emirates | |
| Turkey | |
| South Africa | |
| Egypt | |
| Rest of Middle East and Africa |
| By Category | Domestic Reverse Factoring | |
| Cross-Border / International Reverse Factoring | ||
| By End-Use Industry | Manufacturing | |
| Transport and Logistics | ||
| Information Technology and Telecommunications | ||
| Healthcare | ||
| Construction | ||
| Retail and E-Commerce | ||
| Automotive | ||
| Energy and Utilities | ||
| Other End-Use Industries | ||
| By Geography | North America | United States |
| Canada | ||
| Mexico | ||
| South America | Brazil | |
| Argentina | ||
| Rest of South America | ||
| Europe | United Kingdom | |
| Germany | ||
| France | ||
| Italy | ||
| Spain | ||
| Rest of Europe | ||
| Asia-Pacific | China | |
| Japan | ||
| India | ||
| South Korea | ||
| Australia | ||
| Indonesia | ||
| Thailand | ||
| Malaysia | ||
| Singapore | ||
| Vietnam | ||
| Rest of Asia-Pacific | ||
| Middle East and Africa | Saudi Arabia | |
| United Arab Emirates | ||
| Turkey | ||
| South Africa | ||
| Egypt | ||
| Rest of Middle East and Africa | ||


Key Questions Answered in the Report
What is the expected value of reverse factoring by 2031?
The reverse factoring market is forecast to reach USD 1,089.93 billion by 2031, up from USD 737.68 billion in 2026, at an 8.12% CAGR over 2026 to 2031.
Which region leads reverse factoring activity today?
Europe led with 39.12% revenue share in 2025, supported by mature banking infrastructure, payment-term regulation, and established buyer-led finance programs.
Which region is growing the fastest through 2031?
Asia-Pacific is projected to grow at a 10.27% CAGR through 2031, with India and export-oriented Southeast Asian markets driving much of the momentum.
Which category is expanding faster, domestic or cross-border programs?
Domestic programs remained larger with 68.96% revenue share in 2025, but cross-border and international programs are growing faster at a 10.77% CAGR through 2031.
Which end-use segment is the largest in this space?
Manufacturing was the largest end-use segment, accounting for 21.03% of revenue in 2025, driven by long procurement cycles, large supplier networks, and high invoice values.
What is pushing adoption among retailers and online sellers?
Retail and e-commerce is the fastest-growing end-use segment, with an 11.43% CAGR through 2031, driven by large supplier networks and longer payment terms, which increase demand for embedded supplier funding.
Page last updated on:





