
Revenue-Based Financing Market Size and Share
Market Overview
| Study Period | 2020 - 2031 |
|---|---|
| Market Size (2026) | USD 21.10 Billion |
| Market Size (2031) | USD 56.70 Billion |
| Growth Rate (2026 - 2031) | 21.90 % |
| Fastest Growing Market | Asia-Pacific |
| Largest Market | North America |
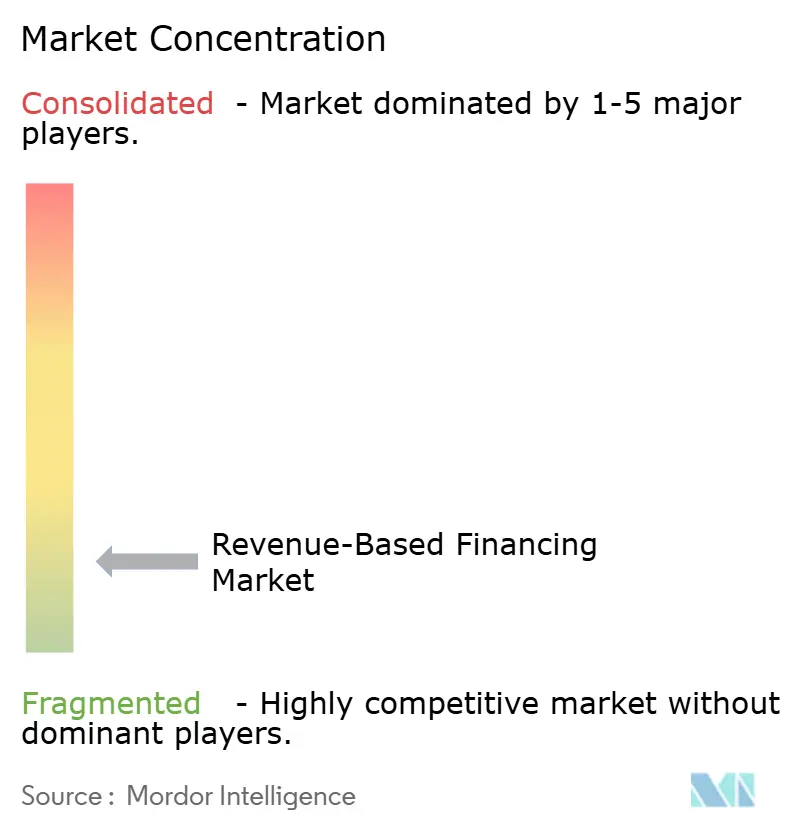
| Market Concentration | Low |
Major Players *Disclaimer: Major Players sorted in no particular order Image © Mordor Intelligence. Reuse requires attribution under CC BY 4.0. | |
Revenue-Based Financing Market Analysis by Mordor Intelligence
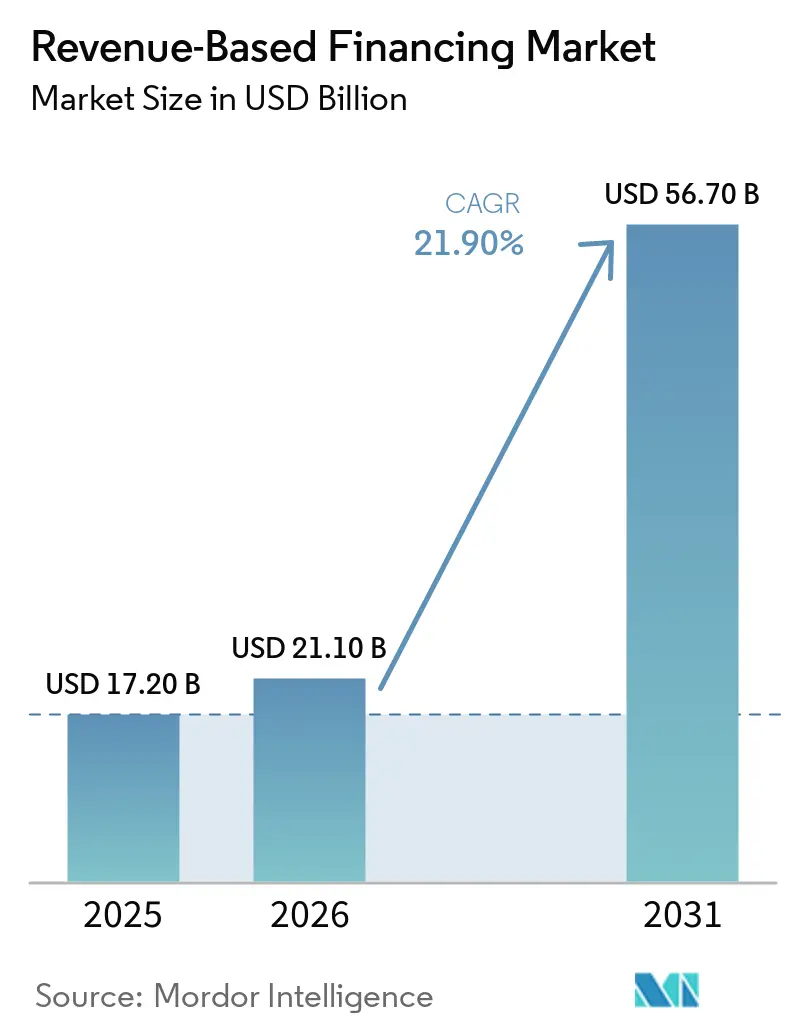
The revenue-based financing market size is projected at USD 17.20 billion in 2025, USD 21.10 billion in 2026, and is expected to reach USD 56.70 billion by 2031 at a CAGR of 21.90% over 2026 to 2031. The revenue-based financing market is expanding as more founder-led businesses seek growth capital without giving up ownership, especially as equity funding is becoming more selective. The revenue-based financing market is also benefiting from open banking connections and direct links to payments, accounting, and commerce systems, which shorten underwriting timelines and improve decision speed. The revenue-based financing market is gaining support from subscription and recurring revenue models because predictable monthly cash flow is easier to underwrite than asset-backed borrowing for many digital businesses. The revenue-based financing market is also shifting toward embedded distribution, where capital is delivered inside the software and commerce platforms that businesses already use every day. The revenue-based financing market still faces limits from disclosure requirements across jurisdictions and from underwriting exposure when a borrower relies too heavily on a single platform or sales channel.
Key Report Takeaways
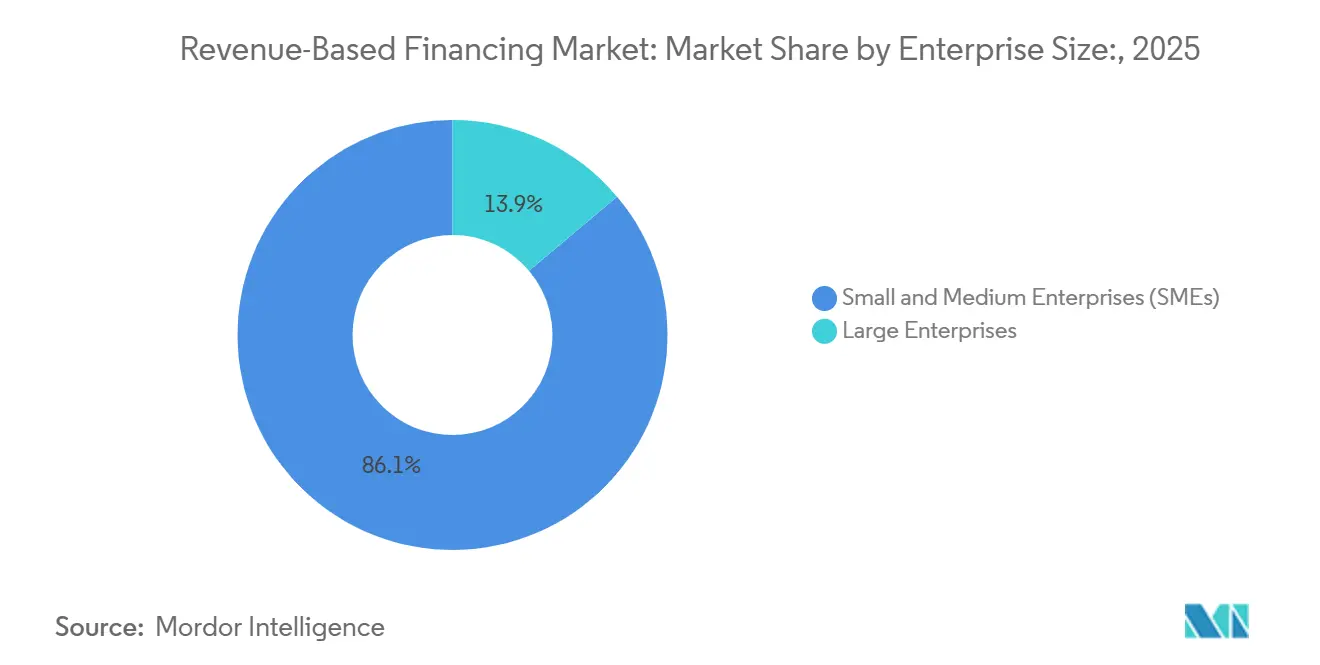
- By enterprise size, SMEs held 86.1% of the revenue-based financing market share in 2025, while large enterprises recorded the highest projected CAGR at 25.8% through 2031.
- By industry vertical, retail and e-commerce accounted for 38.3% of the revenue-based financing market share in 2025, while healthcare and digital health are forecast to expand at a 26.6% CAGR through 2031.
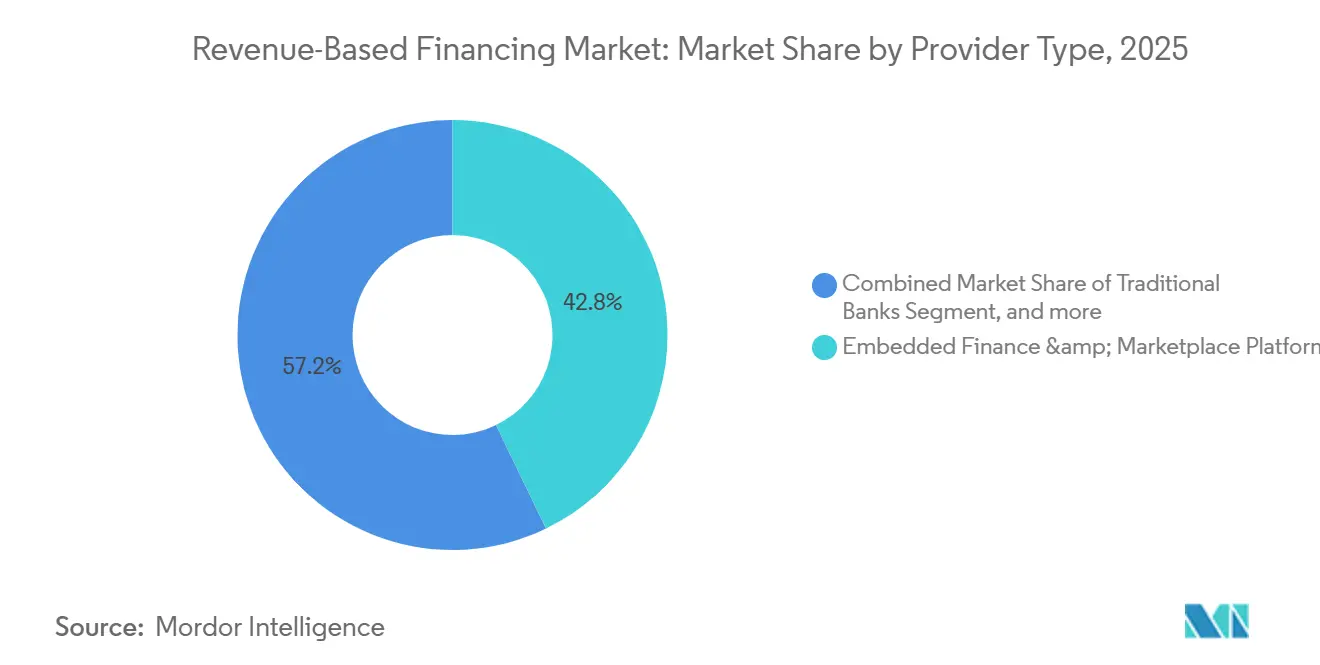
- By provider type, embedded finance and marketplace platforms held 42.8% of the revenue-based financing market share in 2025 and also posted the highest projected CAGR at 24.9% through 2031.
- By channel, marketplace and platform-based origination led with 47.1% of the revenue-based financing market share in 2025, while embedded finance partnerships are projected to advance at a 27.8% CAGR through 2031.
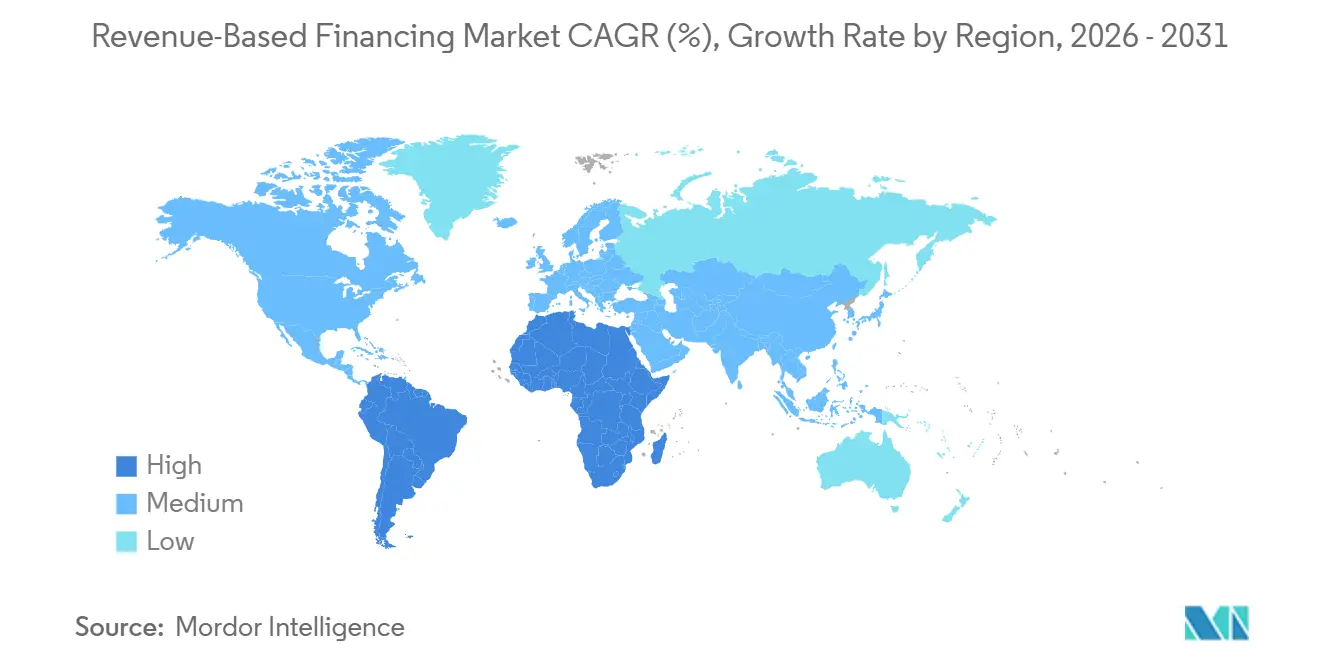
- By geography, North America held 57.3% of the revenue-based financing market share in 2025, while Asia-Pacific recorded the fastest projected CAGR at 24.9% through 2031.
Note: Market size and forecast figures in this report are generated using Mordor Intelligence’s proprietary estimation framework, updated with the latest available data and insights as of January 2026.
Global Revenue-Based Financing Market Trends and Insights
Drivers Impact Analysis*
| Driver | (~) % Impact on CAGR Forecast | Geographic Relevance | Impact Timeline |
|---|---|---|---|
| Faster Underwriting Through Embedded Financial Data | +4.8% | Global, Asia-Pacific core with spillover to MEA | Medium term (2-4 years) |
| Rising Demand for Non-Dilutive Capital | +4.2% | Global | Short term (≤ 2 years) |
| Growth of Subscription and Recurring Revenue Models | +3.5% | North America and Europe, with early gains in India and Southeast Asia | Medium term (2-4 years) |
| Expansion of Asset-Light Digital Commerce and Creator Businesses | +3.1% | Asia-Pacific, North America, Europe | Medium term (2-4 years) |
| Shift Toward Performance-Aligned Capital in Uncertain Funding Cycles | +2.8% | Global | Short term (≤ 2 years) |
| Secondary Distribution and Warehouse Financing for Scalable Origination | +2.4% | North America and Europe | Long term (≥ 4 years) |
| Source: Mordor Intelligence | |||
Rising Demand for Non-Dilutive Capital
The revenue-based financing market is seeing stronger demand because many founders now treat ownership retention as a core financing priority rather than a secondary preference. This shift matters most for businesses that already generate revenue and want to fund customer acquisition, inventory, or expansion without adding fixed repayment pressure or accepting dilution. The appeal is stronger in uncertain funding cycles because companies can more closely match repayments to business performance rather than locking themselves into conventional debt structures. The revenue-based financing market is therefore reaching firms that are too advanced for friends-and-family funding but still reluctant to accept venture terms that reduce control. This demand is broadening the market beyond venture-backed software startups and pushing providers to build products that serve a wider set of growth-stage businesses.
Growth of Subscription and Recurring Revenue Business Models
The revenue-based financing market is supported by the spread of recurring revenue models beyond software into healthcare, media, education, and consumer services. This change reduces dependence on any one vertical because underwriting methods developed for SaaS can now be used in other categories with steady monthly collections. It also improves provider confidence because recurring billing data gives a clearer view of repayment capacity than one-time transactions or seasonal cash flows. The revenue-based financing market gains from this shift because providers can standardize underwriting, automate monitoring, and expand into new categories without rebuilding the full credit process each time. As more sectors adopt subscription, usage-based, or repeat-service revenue models, the addressable borrower pool becomes broader and more stable.
Faster Underwriting Through Embedded Financial Data Integration
The revenue-based financing market is being reshaped by direct access to live financial data from bank accounts, payment systems, accounting software, and commerce platforms. This model lets providers assess current business performance rather than relying solely on lagging indicators, improving both speed and pricing accuracy. Businesses also respond well to this approach because applications become shorter and funding decisions can align with the operating pace, such as inventory purchases or marketing spend. The revenue-based financing market is therefore moving closer to workflow software, where offers appear inside the systems merchants already use to sell, collect, and reconcile revenue. That shift strengthens providers that control distribution through platforms and weakens lenders that still depend on slower external acquisition funnels.
Expansion of Asset-Light Digital Commerce and Creator Businesses
The revenue-based financing market is attracting more borrowers from asset-light digital businesses, including direct-to-consumer brands, app developers, creator-led ventures, and online service providers. These businesses often have limited physical collateral, yet still generate visible, measurable revenue streams that can support flexible repayment structures. Their financing need is also frequent because cash must be deployed quickly for inventory, advertising, fulfillment, or customer acquisition. The revenue-based financing market fits these models well because repayment can align with sales performance rather than following a fixed schedule that ignores revenue volatility. As digital commerce expands and more individuals or small teams monetize through platforms, providers gain access to a large pool of small-ticket and medium-ticket opportunities.
Restraints Impact Analysis*
| Restraint | (~) % Impact on CAGR Forecast | Geographic Relevance | Impact Timeline |
|---|---|---|---|
| Jurisdictional Ambiguity in Product Classification and Disclosure | -2.3% | North America, expanding to Europe | Medium term (2-4 years) |
| Limited Fit for Pre-Revenue and Irregular-Revenue Businesses | -1.8% | Global | Short term (≤ 2 years) |
| Data Access Friction Across Bank, Accounting, and Platform Ecosystems | -1.5% | Asia-Pacific, MEA, Europe | Medium term (2-4 years) |
| Underwriting Sensitivity to Revenue Concentration on a Few Platforms | -1.2% | North America | Short term (≤ 2 years) |
| Source: Mordor Intelligence | |||
Jurisdictional Ambiguity in Product Classification and Disclosure
The revenue-based financing market is facing a more complex compliance environment as disclosure rules and product classifications develop unevenly across jurisdictions. This creates operating pressure because providers may need to redesign contracts, disclosures, and onboarding processes for different states or countries. Larger platform providers can manage this burden more easily because they have legal resources, broader compliance teams, and deeper budgets for system updates. Smaller specialists face a harder tradeoff because compliance costs can rise faster than origination volume in newly regulated markets. The revenue-based financing market could therefore see an advantage shift toward larger embedded players if regulatory patchworks continue to expand without clear harmonization.
Limited Fit for Pre-Revenue and Irregular-Revenue Businesses
The revenue-based financing market cannot serve every borrower because it depends on visible, reasonably consistent revenue streams. Pre-revenue companies, project-based firms, and highly seasonal operators often fall outside normal underwriting thresholds, even when their long-term business prospects are strong. This narrows effective addressable demand in regions where many small businesses still operate with informal or inconsistent revenue records. It also means headline SME counts do not directly translate into qualified borrower volume in the revenue-based financing market. Providers can extend reach through hybrid products or predictive models, but those approaches add servicing complexity and can reduce the efficiency advantages of pure revenue-share structures.
*Our forecasts treat driver/restraint impacts as directional, not additive. The impact forecasts reflect baseline growth, mix effects, and variable interactions.
Segment Analysis
By Enterprise Size: SME Scale Continues to Anchor Demand
SMEs held 86.1% of the revenue-based financing market share in 2025, which confirms that the product still serves businesses that often sit outside traditional institutional credit channels. This position is reinforced by the structure of the revenue-based financing market, where many offers are embedded inside merchants and software platforms already used by small businesses every day. That lowers acquisition costs for providers and makes the funding process feel more like an operating tool than a separate borrowing event. The small-ticket end of the market has also become more accessible as specialist lenders lower minimum revenue thresholds and simplify approval processes. Founderpath stated that it had funded USD 271 million to more than 724 software founders by 2026, demonstrating how specialized models continue to expand access for smaller recurring-revenue companies [1]Founderpath, “Revenue-Based Financing for SaaS Founders,” Founderpath, founderpath.com.
The revenue-based financing market is likely to continue to prioritize SMEs, as these businesses value flexibility, speed, and control more than conventional loan structures often offer. At the same time, large enterprises are forecast to grow at a 25.8% CAGR through 2031, suggesting a widening use case for revenue-linked capital within more structured treasury strategies. In this part of the revenue-based financing industry, capital is often used for clearly defined growth programs where a fixed debt schedule would create unnecessary pressure on cash flow. The distribution model also changes at this level because larger transactions tend to move through private credit funds, warehouse facilities, and structured investors rather than through mass-market platform interfaces. This pattern shows that the revenue-based financing market is expanding from small-business working capital to larger, more deliberate growth financing decisions.


By Industry Vertical: Retail Leads Volume While Healthcare Builds Momentum
Retail and e-commerce accounted for 38.3% of the revenue-based financing market share in 2025, making it the largest vertical. This lead reflects a practical fit between the product and the operating cycle of online merchants, where capital is needed before sales are realized and repayment can be linked to visible transaction flow. Platform data also makes underwriting easier because merchants generate continuous signals on sales, returns, and order patterns. That combination has kept retail and e-commerce at the center of the revenue-based financing market even as providers expand into other sectors. The category also benefits from the embedded lending strategies of commerce platforms that can present financing natively at the point of business activity.
The revenue-based financing market is also broadening beyond commerce, as the underwriting logic now applies to more service-led and recurring-revenue categories. Technology and software remain important because annual or monthly recurring revenue is easy to monitor, and that still shapes underwriting standards across much of the revenue-based financing industry. Healthcare and digital health are projected to grow at a 26.6% CAGR through 2031, which makes it the fastest-growing vertical in the current outlook. Its momentum reflects the rise of subscription care, recurring visits, digital care delivery, and reimbursement models that create more predictable monthly cash flows than earlier healthcare business structures. Food and beverage, manufacturing, consumer goods, and education remain smaller today, but they are becoming easier for providers to underwrite as standardized integrations and cash flow models spread across sectors.
By Provider Type: Embedded Platforms Hold the Strongest Structural Position
Embedded finance and marketplace platforms held a 42.8% of the revenue-based financing market share in 2025 and recorded the fastest projected CAGR of 24.9% through 2031, making them the strongest provider category in the revenue-based financing market. This leads to a structural advantage because platforms already own the merchant relationship, the payment flow, and much of the data needed for underwriting and repayment. Capital can therefore be offered inside the same environment where a business already manages orders, settlements, or customer acquisition. That gives embedded providers stronger distribution economics than standalone lenders, which must source, onboard, and monitor borrowers outside the core workflow. Liberis and Deliveroo launched Deliveroo Capital in the United Kingdom in February 2026, using real-time platform sales data to provide pre-approved funding to restaurant partners through the Deliveroo Partner Hub [2]Deliveroo, “Deliveroo Partners with Liberis to Launch ‘Deliveroo Capital’, Offering Restaurants Access to Funding,” Deliveroo, deliveroo.co.uk.
The revenue-based financing market still gives specialized providers an important role because they often move faster in product design and can serve verticals that are not yet fully captured by large platforms. Wayflyer, for example, launched an Innovation Fund in October 2025 to move beyond e-commerce into retail, SaaS, consumer services, and healthcare, signaling a clear attempt to defend growth amid platform expansion. Traditional banks and financial institutions remain more selective, and they are more likely to participate through partnership structures than through broad direct origination in the revenue-based financing market. Alternative investment funds matter because they provide warehouse funding and secondary capital that help originators scale without bearing all the risk on their balance sheets. This layered structure suggests that origination power may concentrate with embedded platforms, while funding depth continues to depend on cooperation between specialists and institutional capital providers.

By Channel: Platform-Based Origination Leads While Embedded Partnerships Accelerate
Marketplace and platform-based origination accounted for 47.1% of the revenue-based financing market share in 2025, making it the largest channel in the revenue-based financing market. This channel works well because financing can be surfaced to merchants at the right operating moment, often before they actively begin a separate funding search. Automated deduction from settlements also simplifies repayment and reduces friction for both providers and borrowers. These features have enabled platform-based models to take a leading role in the revenue-based financing market, especially for small- and medium-sized business borrowers. Shopify Capital originated USD 1.4 billion in business loans and merchant cash advances in Q1 2026, demonstrating how quickly a platform-native model can scale when distribution and repayment sit within the same ecosystem.
The revenue-based financing market is also seeing embedded finance partnerships emerge as the fastest-growing channel, with a projected CAGR of 27.8% through 2031. This model expands reach because capital providers can plug into payment facilitators, vertical software platforms, and operating systems that already serve business users. Pipe raised USD 16 million in April 2026 and said it had tripled revenue in 2025 while extending its Victory Park Capital warehouse facility to USD 225 million, highlighting the investment in embedded origination models [3]Pipe, “Pipe Raises USD 16 Million in New Funding Round Led by Fin Capital and MaC Venture Capital,” BusinessWire, businesswire.com. Direct origination still matters for larger or more customized transactions where human review and structuring remain necessary, but its relative weight is likely to ease as automated underwriting improves. The revenue-based financing market, therefore, appears to be moving from standalone lead generation toward integrated distribution networks that combine data access, native placement, and automated repayment.
Geography Analysis
North America held 57.3% of the revenue-based financing market share in 2025, making it the leading regional base. The region benefits from a dense mix of SaaS firms, digital commerce sellers, and creator-led businesses that generate recurring, platform-visible revenue streams, which this model requires. It also has stronger warehouse funding infrastructure than other regions, which helps originators scale and recycle capital more efficiently. Wayflyer secured a USD 250 million, 2-year credit facility with ATLAS SP Partners in February 2026 to support the United States expansion, which underlines continued institutional appetite for structured funding behind origination platforms[4]Wayflyer, “Wayflyer Secures USD 250M Credit Facility with ATLAS SP Partners to Expand SME Funding Capacity,” Wayflyer, wayflyer.com.
Europe remains important to the revenue-based financing market because open banking rules and the adoption of digital payments support data access and platform-led underwriting. The United Kingdom stands out because embedded finance partnerships are already moving into hospitality and merchant ecosystems rather than staying confined to software-only channels. Deliveroo Capital is one visible example of this trend, and it shows how revenue-linked advances can sit directly inside operating platforms that already manage daily business activity. South America is less mature, but the revenue-based financing market has room to grow there because many SMEs still face tight credit access and may benefit from flexible structures tied to actual collections.
Asia-Pacific is projected to expand at a 24.9% CAGR through 2031, making it the fastest-growing regional segment of the revenue-based financing market. Growth is being supported by large SME populations, rising digital commerce activity, and the gradual buildout of open finance infrastructure across key countries. Australia is attracting specialist attention, and Lighter Capital extended a USD 30 million facility in January 2025 through a partnership with the Victorian Government and iPartners to support Australian tech startups. Japan also shows that embedded credit is spreading beyond English-speaking markets, as PayPay launched an invitation-only merchant loan product for its merchant base in April 2025 using platform transaction data and bank-grade lending infrastructure. The Middle East and Africa remain early-stage markets for revenue-based financing. Still, regulatory sandboxes and fintech policy support in the Gulf are laying the groundwork for more formal launches during the forecast period.

Competitive Landscape
The revenue-based financing market is fragmented across platform-embedded lenders, specialist originators, and regional challengers. Large platforms such as Shopify, Amazon, Stripe, and PayPal have a clear distribution advantage because they already control merchant traffic, payment visibility, and repayment rails. Specialists such as Wayflyer, Clearco, Lighter Capital, and Pipe compete by going deeper into underwriting, broader into product design, or faster into new vertical expansion. This makes the revenue-based financing market competitive in practice, where data access and embedded placement often matter as much as pricing.
A key shift in the revenue-based financing market is that specialists are no longer defending only one niche; they are expanding into adjacent sectors and into partnership-led delivery. Wayflyer launched its Innovation Fund in October 2025 to move beyond e-commerce and test financing across retail, SaaS, consumer services, and healthcare. Pipe raised USD 16 million in April 2026 and tied that funding to the scale-up of its embedded financing product, showing that providers see partnership distribution as central to future growth. Liberis also deepened its embedded strategy through Deliveroo in the United Kingdom and Elavon in Canada, demonstrating how providers are building reach through payment and merchant networks rather than solely through direct sales.
The revenue-based financing market is also opening space for regional specialists who can tailor products to local platforms, policy settings, and borrower behavior. Lighter Capital’s Australian facility shows how market entry can be supported through partnership structures that reduce funding friction and improve local relevance. PayPay’s merchant loan launch shows that major digital ecosystems can extend into revenue-linked working capital without first building a full, standalone lender brand. The revenue-based financing market, therefore, appears to be moving toward a model in which winning providers combine data access, native distribution, and flexible capital structures within the tools businesses already use. Providers that rely solely on direct origination may still play a role in larger, more customized deals, but they face greater pressure as automated and embedded models scale. The next stage of competition is likely to depend less on simple origination volume and more on who can hold durable access to borrower workflows, repayment signals, and funding capacity.
Revenue-Based Financing Industry Leaders
Clearco
Pipe Technologies Inc.
Capchase Inc.
Wayflyer Ltd.
Liberis Ltd.
- *Disclaimer: Major Players sorted in no particular order

Recent Industry Developments
- April 2026: Pipe raised USD 16 million in an equity round led by Fin Capital and MaC Venture Capital, its first equity raise since relaunching its embedded financing product in 2024. The company tripled revenue in 2025, raised over USD 300 million in advances to 15,000+ small businesses globally, and extended its Victory Park Capital warehouse facility to USD 225 million. The raise signals investor confidence in platform-embedded origination as a scalable, path-to-profitability model.
- March 2026: Liberis and Elavon expanded their revenue-based financing partnership to Canada, giving 202,000 Canadian SMBs access to flexible capital originating through Elavon’s merchant portal with decisions powered by real-time transaction data. The expansion followed a successful United States launch in 2025 and confirms Liberis’s strategy of scaling embedded capital through payment processor distribution.
- February 2026: Wayflyer secured a USD 250 million, two-year credit facility with ATLAS SP Partners, majority-owned by Apollo funds, to accelerate United States market expansion, opening a new United States headquarters in Charlotte, North Carolina. Wayflyer surpassed USD 6 billion in cumulative deployments and USD 100 million in annual revenues prior to this facility's close.
- February 2026: Liberis and Deliveroo launched Deliveroo Capital in the United Kingdom, providing pre-approved merchant cash advances to over 5,000 United Kingdom restaurant partners via the Deliveroo Partner Hub, with expansion to thousands more planned through Q1 2026. Funding decisions are based on real-time Deliveroo sales data, eliminating the need for traditional credit checks.


Global Revenue-Based Financing Market Report Scope
| Small and Medium Enterprises |
| Large Enterprises |
| Technology and Software |
| Retail and E-Commerce |
| Healthcare and Digital Health |
| Media and Entertainment |
| Manufacturing |
| Food and Beverage |
| Consumer Goods |
| Education |
| Energy and Utilities |
| Other Industry Verticals |
| Specialized Revenue Financing Providers |
| Embedded Finance & Marketplace Platforms |
| Traditional Banks and Financial Institutions |
| Alternative Investment Funds and Institutional Capital Providers |
| Direct Origination |
| Marketplace / Platform-Based Origination |
| Embedded Finance Partnerships |
| North America | United States |
| Canada | |
| Mexico | |
| South America | Brazil |
| Argentina | |
| Rest of South America | |
| Europe | United Kingdom |
| Germany | |
| France | |
| Italy | |
| Spain | |
| Rest of Europe | |
| Asia-Pacific | China |
| Japan | |
| India | |
| South Korea | |
| Australia | |
| Indonesia | |
| Thailand | |
| Malaysia | |
| Singapore | |
| Vietnam | |
| Rest of Asia-Pacific | |
| Middle East and Africa | Saudi Arabia |
| United Arab Emirates | |
| Turkey | |
| South Africa | |
| Egypt | |
| Rest of Middle East and Africa |
| By Enterprise Size | Small and Medium Enterprises | |
| Large Enterprises | ||
| By Industry Vertical | Technology and Software | |
| Retail and E-Commerce | ||
| Healthcare and Digital Health | ||
| Media and Entertainment | ||
| Manufacturing | ||
| Food and Beverage | ||
| Consumer Goods | ||
| Education | ||
| Energy and Utilities | ||
| Other Industry Verticals | ||
| By Provider Type | Specialized Revenue Financing Providers | |
| Embedded Finance & Marketplace Platforms | ||
| Traditional Banks and Financial Institutions | ||
| Alternative Investment Funds and Institutional Capital Providers | ||
| By Channel | Direct Origination | |
| Marketplace / Platform-Based Origination | ||
| Embedded Finance Partnerships | ||
| By Geography | North America | United States |
| Canada | ||
| Mexico | ||
| South America | Brazil | |
| Argentina | ||
| Rest of South America | ||
| Europe | United Kingdom | |
| Germany | ||
| France | ||
| Italy | ||
| Spain | ||
| Rest of Europe | ||
| Asia-Pacific | China | |
| Japan | ||
| India | ||
| South Korea | ||
| Australia | ||
| Indonesia | ||
| Thailand | ||
| Malaysia | ||
| Singapore | ||
| Vietnam | ||
| Rest of Asia-Pacific | ||
| Middle East and Africa | Saudi Arabia | |
| United Arab Emirates | ||
| Turkey | ||
| South Africa | ||
| Egypt | ||
| Rest of Middle East and Africa | ||


Key Questions Answered in the Report
What is the expected size of the revenue-based financing market by 2031?
The revenue-based financing market is forecast to reach USD 56.7 billion by 2031, rising from USD 21.1 billion in 2026 at a 21.9% CAGR.
Which region leads revenue-based financing adoption?
North America led with 57.3% share in 2025 because it has the deepest mix of SaaS, digital commerce, and platform-based lending ecosystems.
Which borrower group uses revenue-based financing the most?
SMEs remained the main borrower base, holding 86.1% share in 2025, largely because the model fits businesses that need flexible growth capital without dilution.
Which vertical is growing the fastest in revenue-based financing?
Healthcare and digital health is projected to grow the fastest at a 26.6% CAGR through 2031 as recurring care and digital service models create steadier revenue visibility.
Why are embedded finance partnerships becoming more important?
Embedded partnerships are forecast to grow at 27.8% CAGR because capital can be offered inside platforms where merchants already sell, get paid, and manage operations.
What is changing competition in this space the most?
Competitive strength is shifting toward providers that combine direct data access, embedded distribution, and warehouse funding, rather than relying only on standalone origination.
Page last updated on:





