Residential Battery Market Size and Share
Market Overview
| Study Period | 2021 - 2031 |
|---|---|
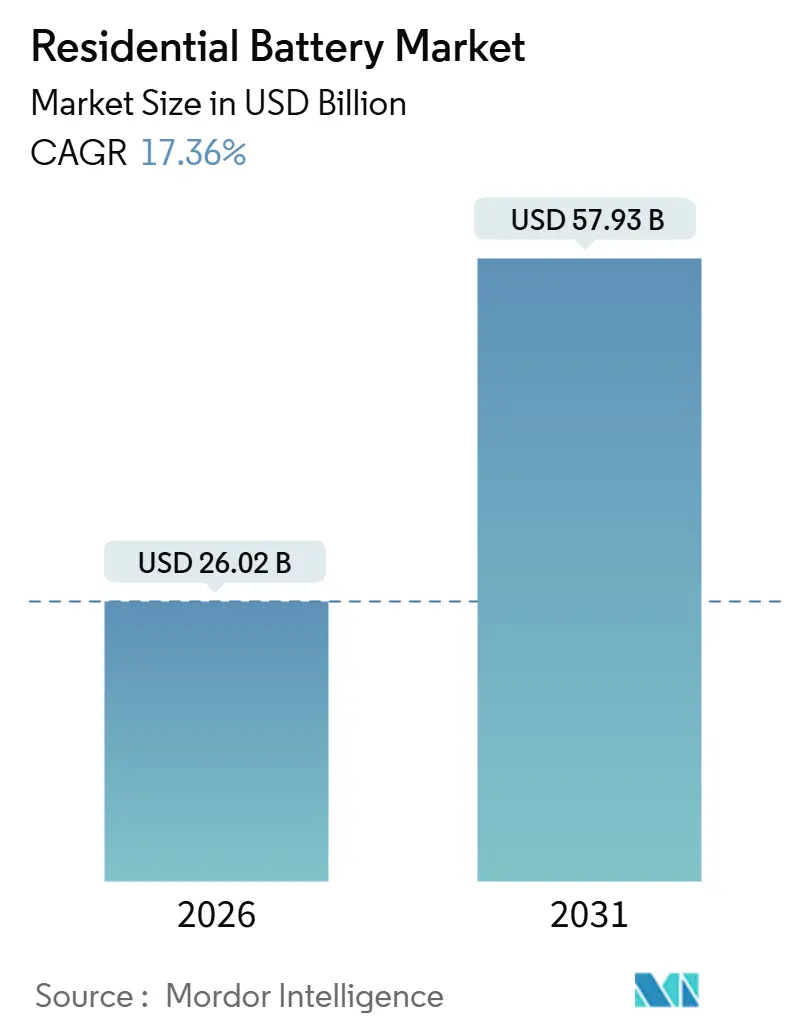
| Market Size (2026) | USD 26.02 Billion |
| Market Size (2031) | USD 57.93 Billion |
| Growth Rate (2026 - 2031) | 17.36% CAGR |
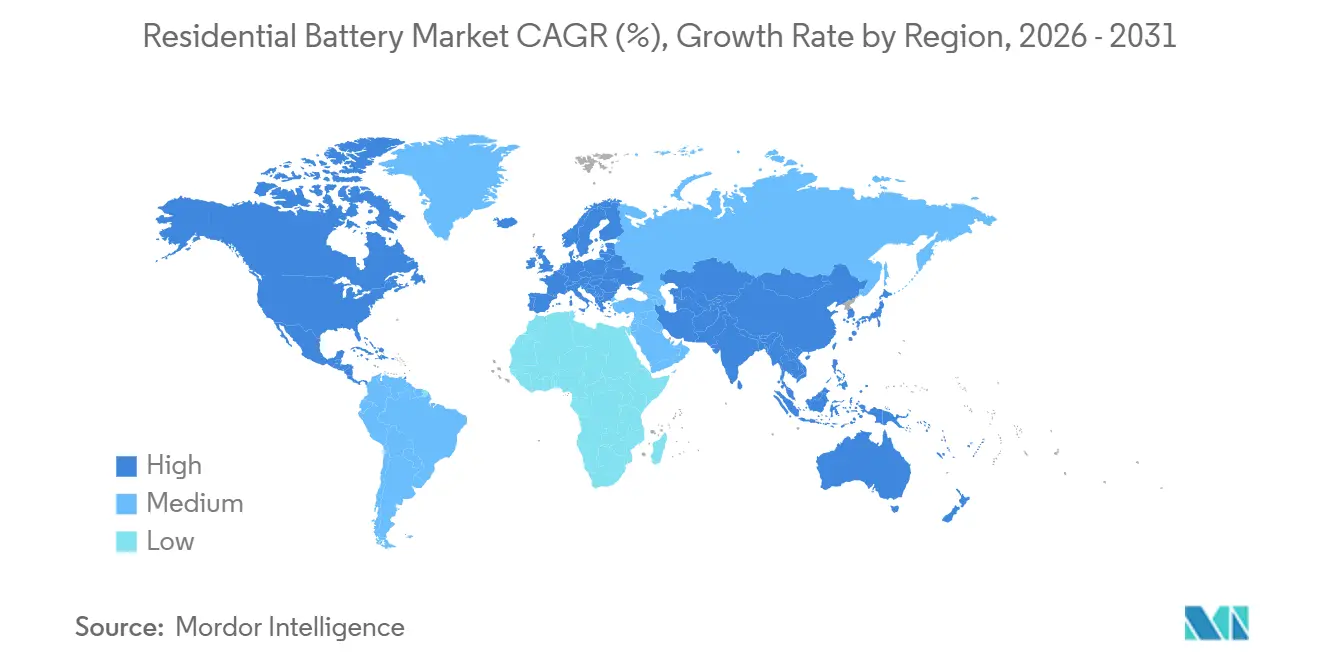
| Fastest Growing Market | Asia Pacific |
| Largest Market | Asia Pacific |
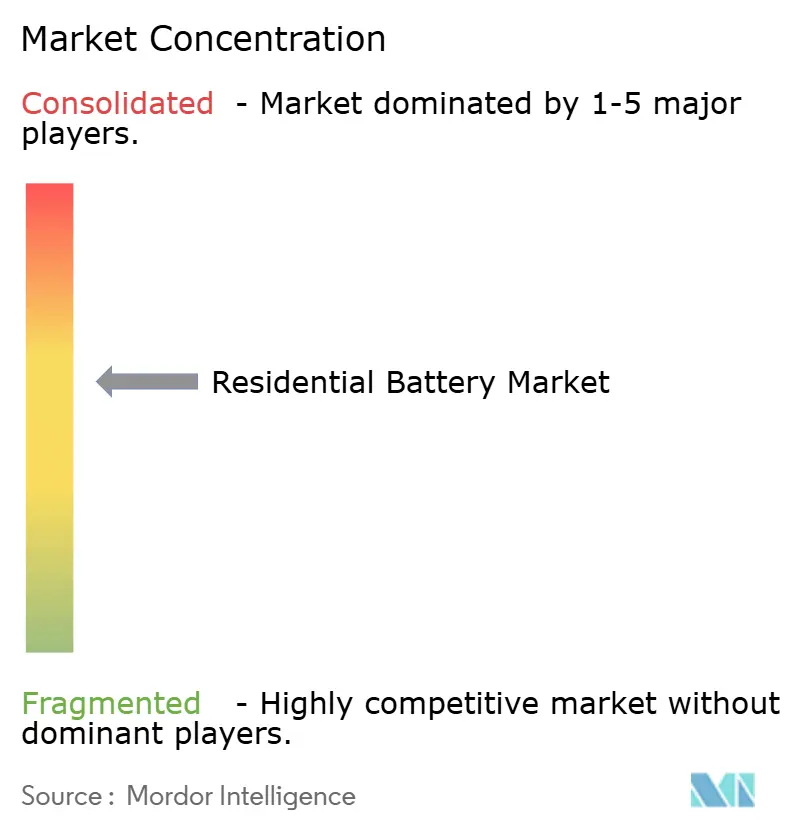
| Market Concentration | Medium |
Major Players
*Disclaimer: Major Players sorted in no particular order Image © Mordor Intelligence. Reuse requires attribution under CC BY 4.0. |
|
Residential Battery Market Analysis by Mordor Intelligence
The Residential Battery Market size is estimated at USD 26.02 billion in 2026, and is expected to reach USD 57.93 billion by 2031, at a CAGR of 17.36% during the forecast period (2026-2031).
In the near term, California’s NEM 3.0 tariff, Germany’s KfW 442 rebates, Japan’s feed-in-premium (FIP) scheme, and South Korea’s renewable-energy-certificate (REC) multipliers collectively tilt household economics toward self-consumption and virtual-power-plant (VPP) participation. Over the medium term, lithium-iron-phosphate (LFP) cost declines below USD 250 per kWh, a nationwide 30% U.S. investment-tax credit (ITC), and sodium-ion R&D advances widen access to cost-sensitive segments. In the long term, aggregator-led grid-services revenue, evolving fire-safety standards, and a maturing second-life battery stream recalibrate competitive strategies, driving consolidation among inverter makers, automotive cell suppliers, and software-centric startups. Altogether, these forces position the residential battery market as a cornerstone of distributed-energy resource portfolios worldwide.
Key Report Takeaways
- By battery type, lithium-ion systems held 72.9% residential battery market share in 2025, while sodium-ion and nickel-based alternatives exhibit a 19.4% CAGR to 2031.
- By application, self-consumption and backup commanded 68.4% residential battery market share in 2025; VPP and grid-services use cases are advancing at a 17.8% CAGR through 2031.
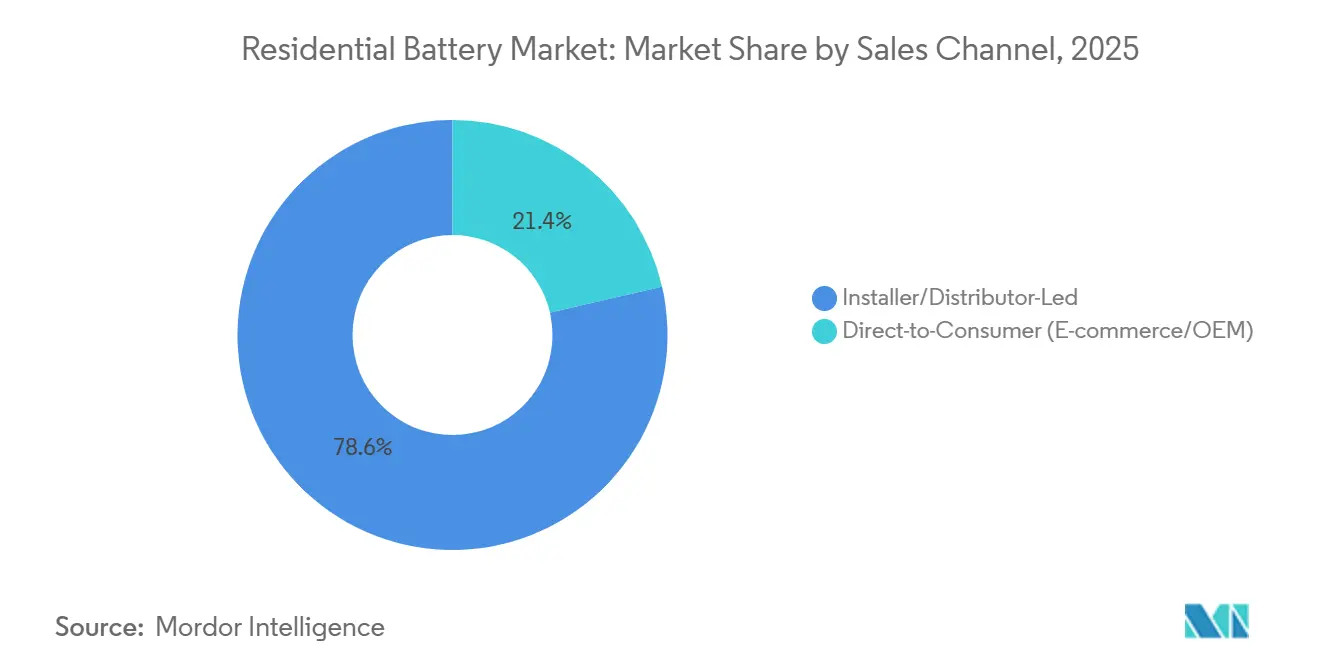
- By sales channel, installer- and distributor-led routes captured 78.6% residential battery market share in 2025, whereas direct-to-consumer models show an 18.3% CAGR to 2031.
- By geography, Asia-Pacific accounted for 53.3% of the residential battery market size in 2025 and is set to grow at an 18.8% CAGR, the fastest regional pace to 2031.
Note: Market size and forecast figures in this report are generated using Mordor Intelligence’s proprietary estimation framework, updated with the latest available data and insights as of January 2026.
Global Residential Battery Market Trends and Insights
Drivers Impact Analysis*
| Driver | (~) % Impact on CAGR Forecast | Geographic Relevance | Impact Timeline |
|---|---|---|---|
| Surging rooftop-PV pairing mandates in Germany & Australia | 2.8% | Germany, Australia, with spillover to Austria and Netherlands | Medium term (2-4 years) |
| U.S. Inflation Reduction Act 30% ITC extension to batteries | 3.2% | United States, with indirect influence on Canadian provincial programs | Long term (≥ 4 years) |
| California NEM 3.0 sharpening self-consumption economics | 1.9% | California, with replication in Hawaii and Massachusetts | Short term (≤ 2 years) |
| Japanese FIP scheme rewarding behind-the-meter VPP aggregation | 1.4% | Japan, with pilot extensions in South Korea and Taiwan | Medium term (2-4 years) |
| South Korean REC multipliers for residential ESS | 1.1% | South Korea, with policy learning in Southeast Asian markets | Medium term (2-4 years) |
| Dramatic Li-ion $/kWh cost drop below USD 250 for <15 kWh packs | 4.5% | Global, led by China manufacturing scale and LFP chemistry adoption | Long term (≥ 4 years) |
| Source: Mordor Intelligence | |||


Surging Rooftop-PV Pairing Mandates in Germany & Australia
Germany’s KfW 442 allocated EUR 10.2 billion (USD 11.1 billion) for solar-battery bundles in 2024, lowering the net cost of a 10 kWh system by roughly 25% and shortening payback from 12 to 7 years.[1]German Federal Ministry for Economic Affairs and Climate Action, “KfW 442 Program Details,” bmwk.de Australia’s South Australia VPP and New South Wales peak-demand scheme together recoup 15%–20% of the upfront battery cost within three years. These incentives convert batteries from optional resilience tools into revenue-generating grid assets, a template Austria and the Netherlands are already replicating. Germany’s Bundesnetzagentur notes grid-service batteries earn feed-in tariffs 40% above solar-only arrays, pushing installers to standardize bidirectional inverters. As a result, Bavarian installers report battery attachment rates rising from 38% in 2023 to 71% in 2025, marking a decisive inflection in the residential battery market.
U.S. Inflation Reduction Act 30% ITC Extension to Batteries
The Internal Revenue Service processed 48,840 standalone battery claims under the extended 30% ITC in 2023, excluding solar-paired units.[2]Internal Revenue Service, “Form 5695 Residential Clean Energy Credit Statistics,” irs.gov With credit certainty until 2032, manufacturers such as Tesla ramped Powerwall 3 output to a 500,000-unit annual rate at Gigafactory Nevada by Q4 2024. Generac recorded USD 157 million in Q3 2024 storage revenue, a 76% year-on-year jump, attributing growth to ITC-eligible PWRcell systems. The standalone credit uncorks demand among northern-latitude homeowners who favor backup over rooftop solar, while Canada’s Ontario and British Columbia launched 20%–25% matching rebates that piggyback on U.S. volume scaling. Consequently, the residential battery market sees a wider geographic spread of installations, smoothing production cycles and inventory planning.
California NEM 3.0 Sharpening Self-Consumption Economics
Implemented in 2023, NEM 3.0 slashed daytime export rates by about 75%, lifting battery attachment for new solar systems from 10% in 2022 to 60% in 2024. Time-of-use export values now range USD 0.05–0.08 /kWh at noon and USD 0.30–0.40 /kWh in the evening, enabling 5-to-8-fold arbitrage spreads.[3]California Public Utilities Commission, “Time-of-Use Export Tariffs,” cpuc.ca.gov Installers report 17% price premiums for solar-plus-storage bundles, yet lower customer-acquisition costs because value is self-evident. Hawaii and Massachusetts are drafting analogous export penalties, suggesting NEM 3.0’s logic will diffuse nationally. Products such as Enphase’s modular IQ Battery 5P are expressly designed to align capacity additions with evolving arbitrage literacy.
Japanese FIP Scheme Rewarding Behind-the-Meter VPP Aggregation
Japan replaced its feed-in tariff with a feed-in premium in 2022, paying a premium above wholesale prices for residential discharge during high-demand windows. Aggregators like ENERES combine hundreds of home batteries into VPP bids on the Japan Electric Power Exchange, earning JPY 30,000–50,000 (USD 200–340) per home annually.[4]ENERES Corporation, “Residential VPP Aggregation Results,” eneres.co.jp The premium spikes during winter LNG-import peaks, aligning private dispatch with national energy-security priorities. Panasonic’s EverVolt integrates auto-dispatch features so homeowners can enroll with minimal effort. South Korea and Taiwan are piloting similar compensation curves, bolstering the residential battery market across East Asia.
Restraints Impact Analysis*
| Restraint | (~) % Impact on CAGR Forecast | Geographic Relevance | |
|---|---|---|---|
| Rising grid-connection & permitting queues across EU | -1.8% | Germany, Netherlands, Spain, with emerging bottlenecks in Poland | Short term (≤ 2 years) |
| Fire-safety codes tightening for indoor installations (UL 9540A, IEC 63056) | -1.2% | Global, with strictest enforcement in North America and Western Europe | Medium term (2-4 years) |
| Limited second-life battery availability until 2027 | -0.8% | Global, with pilot concentrations in Germany, Japan, and California | Long term (≥ 4 years) |
| Li-ion supply-chain exposure to critical-minerals price shocks | -1.4% | Global, with acute sensitivity in cobalt (Congo) and nickel (Indonesia) sourcing | Medium term (2-4 years) |
| Source: Mordor Intelligence | |||
Rising Grid-connection & Permitting Queues across EU
Germany’s Bundesnetzagentur logged a 300,000-application backlog in 2024, stretching median approvals to 28 weeks. Distribution operators cite feeder overloads in Bavaria and North Rhine-Westphalia, often demanding transformer upgrades that inflate project cost. Spain and the Netherlands face similar standstills; Dutch operator Liander paused new residential interconnections in 12 municipalities during 2024. Installers now carry inventory for up to nine months, raising working-capital needs and squeezing thin-margin players out of the residential battery market.
Fire-safety Codes Tightening for Indoor Installations (UL 9540A, IEC 63056)
UL 9540A’s 5th edition in 2025 introduced propagation tests requiring adjacent modules to stay below 150 °C for two hours, adding USD 15,000–25,000 per product variant. IEC 63056 mandates gas-emission profiling, lengthening certification cycles. Insurers in California and Germany now make UL 9540A a prerequisite for indoor systems, effectively sidelining non-compliant brands. Larger manufacturers absorb these costs; smaller ones delay launches, conceding share in the residential battery market to incumbents.
*Our forecasts treat driver/restraint impacts as directional, not additive. The impact forecasts reflect baseline growth, mix effects, and variable interactions.
Segment Analysis
By Battery Type: LFP Chemistry Anchors Li-ion Dominance
Lithium-ion variants secured 72.9% residential battery market share in 2025, with the segment’s pivot toward LFP elevating safety compliance under UL 9540A and IEC 63056 norms. LFP’s 6,000–8,000-cycle life and cobalt-free bill of materials reduce levelized storage cost, so the residential battery market size for LFP arrays is set to widen steadily through 2031. BYD and LG Energy Solution transitioned flagship lines to LFP in 2024, undercutting nickel-manganese-cobalt rivals by 15% while meeting fire-marshal spacing codes.
Sodium-ion and nickel-rich chemistries, though holding modest base shares, are slated for a 19.4% CAGR, the swiftest in the battery-type spectrum. CATL’s 200 Wh/kg sodium-ion cells, announced in 2024, promise a lithium-free hedge against critical-mineral risk, although current density caps limit packs to 8–10 kWh for typical enclosures. Flow batteries remain below 2% share, reserved for multi-day rural off-grid uses, and lead-acid’s 18% share continues its attrition trajectory as the residential battery market tightens payback thresholds.


By Application: VPP Integration Unlocks New Revenue Streams
Self-consumption and backup solutions attracted 68.4% of the residential battery market share in 2025, as households hedge outage risk and rising tariffs. Nevertheless, VPP and grid-service deployments are expanding at 17.8% annually, reflecting aggregator-enabled access to frequency-regulation and demand-response revenue. Australia’s South Australia VPP pays participating homes AUD 400–600 (USD 270–405) each year, equal to 8%-12% of installed cost, compressing payback to well under seven years.
California’s Demand Side Grid Support program and Japan’s FIP have similar payout ratios, propelling the residential battery market size for grid-service applications to scale quickly by 2031. Off-grid and rural electrification still capture roughly 14% demand, notably in India, sub-Saharan Africa, and remote Brazil, yet gradual lithium price declines and mobile-money-enabled financing are expected to tilt this niche toward lithium technologies by the late decade.
By Sales Channel: Installer Networks Retain Control, DTC Gains Traction
Installer-driven distribution commanded 78.6% residential battery market share in 2025, leveraging licensed-electrician requirements and bundled financing. Certified networks exceed 10,000 integrators apiece for SolarEdge and Enphase, with gross margins of 30%-40% reflecting warranty management and permitting labor.
Direct-to-consumer (DTC) sales, however, are the fastest-growing route at 18.3% CAGR. Tesla’s online Powerwall configurator lowers system cost 15%-20% versus third-party installers, while Sonnen’s sonnenCommunity aligns battery ownership with peer-to-peer energy trading revenue. Amazon and Home Depot pilot marketplace models that outsource commissioning to local electricians, compressing installer margins yet expanding geographic reach. Regulatory reforms that enable pre-certified plug-and-play kits could further reshape the residential battery market landscape after 2028.
Geography Analysis
Asia-Pacific dominated the residential battery market size with a 53.3% revenue share in 2025 and is heading for an 18.8% CAGR through 2031. China alone installed more than 3 GWh of household storage in 2024, buoyed by sub-USD 220 /kWh LFP packs from PylonTech and Alpha-ESS. Japan’s aggregators enrolled 80,000 batteries into VPPs by mid-2024, earning JPY 30,000–50,000 (USD 200–340) per home annually. South Korea’s 5.5× REC multiplier compresses payback to seven years in Seoul, while Australia’s VPP model defers peaker-plant investments, underscoring the residential battery market’s policy-driven momentum across the region.
North America captured a roughly 28% share in 2025. The IRS recorded 48,840 standalone ITC claims in 2023, and California’s battery attachment rate surged sixfold post-NEM 3.0. Texas followed with 25,000 home batteries in 2024, propelled by real-time tariffs from ERCOT. Canada’s more modest 20%-25% rebates still yielded up to 10,000 installs in 2024. Mexico and the Caribbean remain nascent but display early pilot activity.
Europe held about a 16% share in 2025. Germany’s EUR 10.2 billion KfW 442 subsidy quickened adoption, but grid-connection queues lengthen commissioning times. The U.K.’s Smart Export Guarantee offers softer economics, totaling only 15,000 installs in 2024. Spain’s grid moratorium in eight provinces diverts demand to off-grid schemes. Nonetheless, peer-to-peer models such as SonnenCommunity reach 50,000 households, showcasing alternative revenue pathways amid fragmented regulation.
South America and the Middle East & Africa jointly remain under 3% market share but record rapid localized growth. Brazil’s attachment rate moved from 5% to 12% in 2024 after net-metering reforms, and South Africa’s load-shedding crisis convinced urban homeowners to adopt Tesla Powerwall and Huawei LUNA2000 units despite premium pricing. Gulf Cooperation Council pilot programs continue at a small scale due to low retail tariffs.

Regulatory Landscape
Residential battery adoption is being shaped by tighter safety and installation requirements, along with policy mechanisms that improve self-consumption economics. In the United States, building and fire code pathways increasingly condition permitting on system-level fire testing and listed equipment, including 2024 IRC Section 330 provisions for residential energy storage systems (ESS) in habitable spaces. NFPA issued the 2026 edition of NFPA 855 in October 2025, which shifts many projects toward a default expectation of Hazard Mitigation Analysis (HMA), raising the engineering burden for indoor and attached-garage installations.
Standards evolution is also accelerating product qualification cycles. UL Solutions published the 6th edition of ANSI/CAN/UL 9540A in March 2026, reinforcing thermal runaway propagation scrutiny at the system level and adding compliance work for manufacturers managing multiple pack and enclosure variants. In Europe, Regulation (EU) 2023/1542 adds a compliance layer that extends beyond safety into sustainability documentation, with carbon footprint declaration requirements becoming active on 18 February 2026 for batteries above 2 kWh. This timing encourages residential stationary storage suppliers to prepare earlier for data readiness, including digital documentation workflows, to support market access.
Competitive Landscape
The top five vendors, Tesla, LG Energy Solution, BYD, Enphase, and Panasonic, control nearly half of the residential battery market, confirming moderate concentration. Tesla’s Powerwall 3 integrates a 13.5 kWh LFP pack and 11.5 kW inverter, slashing installation labor by 20%–30%, and production hit a 500,000-unit annual run rate by Q4 2024. LG Energy Solution’s USD 1.4 billion Arizona expansion adds 11 GWh of RESU capacity by 2026, pivoting entirely to LFP to satisfy UL 9540A criteria. BYD leveraged automotive scale to price Battery-Box Premium 30% below incumbents in Europe and Australia, onboarding 200 installers across the two regions.
Enphase’s modular IQ Battery 5P aligns with its microinverter fleet but saw a short-term revenue dip in Q3 2024 due to European destocking. SolarEdge lost share after a 64% revenue fall and subsequent restructuring, underscoring the residential battery industry’s sensitivity to inventory cycles. White-space competition centers on second-life packs, sodium-ion commercialization, and DTC ecosystems. BMW’s pilot repurposed i3 modules for home storage, but certification costs hamper rapid scaling. CATL’s sodium-ion technology targets 2026 residential rollout, while Sonnen’s community energy-trading model monetizes software layers, reinforcing the importance of recurring revenue streams.
Residential Battery Industry Leaders
-
Tesla Inc.
-
LG Energy Solution Ltd
-
Panasonic Holdings Corp.
-
BYD Co. Ltd
-
Sonnen GmbH
- *Disclaimer: Major Players sorted in no particular order

Market Opportunities and Future Outlook
A key opportunity is software-defined residential storage that monetizes dynamic tariffs and grid programs, beyond backup alone. The market already shows momentum toward grid-interactive use cases, with U.S. residential battery installations reaching 673 MW in Q1 2026, supported by high-retail-price states and local incentive structures, while policy levers like California's NEM 3.0 continue to reward self-consumption behavior. Pay-for-performance program design also strengthens the revenue linkage between battery capability (kW) and incentives, as seen in April 2026 when Connecticut's Energy Storage Solutions moved residential incentives from upfront payments to a 10-year performance framework ($300 to $550 per kW-year).
Hardware whitespace is clustering around integrated systems that simplify permitting and installation while meeting stricter safety verification. Product roadmaps emphasize higher-integration architectures (PV plus hybrid inverter plus BMS plus load control), paired with standardized LFP cell formats such as 314 Ah designs that installers can deploy in modular, stackable configurations to reduce balance-of-system complexity. Vendor direction reinforces this shift, with Enphase outlining in May 2026 an expanded roadmap that includes next-generation residential batteries and bidirectional EV chargers. This aligns home storage with EV loads and supports broader participation in behind-the-meter flexibility programs under interconnection rules such as IEEE 1547-2018 and state variants, including California Rule 21.
Recent Industry Developments
- July 2026: Tesla launched Tesla Home, a home energy management platform powered by Opticaster AI that integrates solar, battery, and smart breaker control in a unified interface. The launch emphasizes differentiation from hardware-only storage toward software-driven load orchestration and program participation, including virtual power plant and time-of-use optimization use cases.
- September 2025: LG Energy Solution announced a six-year supply agreement with EG4 Electronics to provide 13.3 GWh of residential energy storage battery modules through 2030. This contract strengthens module supply availability for U.S. residential channels and reinforces the shift toward scaled, standardized LFP-based offerings for installer and distribution networks.
- September 2024: Tesla expanded Powerwall 3 production to a 500,000-unit annual run rate at Gigafactory Nevada by Q4 2024. Higher output supports broader installer coverage and helps stabilize availability for solar-plus-storage bundles as attachment rates rise in markets reshaped by export compensation changes such as California NEM 3.0.


Research Methodology Framework and Report Scope
Market Definition and Coverage
For this study, the residential battery market is counted as the annual revenue generated from rechargeable batteries installed in homes to store electricity from rooftop solar or the grid for later use, backup, or limited grid support.
Scope exclusions: It excludes batteries used mainly for commercial buildings, utility-scale storage, and portable consumer electronics.
Segmentation Overview
-
By Battery Type
- Li-ion (LFP, NMC)
- Lead-acid (AGM, GEL)
- Flow Batteries (Vanadium, Zinc-Br)
- Sodium-ion and Nickel-based
-
By Application
- Self-Consumption and Backup
- Virtual Power Plant/Grid Services
- Off-Grid/Rural Electrification
-
By Sales Channel
- Direct-to-Consumer (E-commerce/OEM)
- Installer/Distributor-Led
-
By Geography
-
North America
- United States
- Canada
- Mexico
-
Europe
- United Kingdom
- Germany
- France
- Spain
- Nordic Countries
- Russia
- Rest of Europe
-
Asia-Pacific
- China
- India
- Japan
- South Korea
- ASEAN Countries
- Rest of Asia-Pacific
-
South America
- Brazil
- Argentina
- Colombia
- Rest of South America
-
Middle East and Africa
- United Arab Emirates
- Saudi Arabia
- Egypt
- South Africa
- Rest of Middle East and Africa
-
North America
Data Sources, Market Sizing, and Validation
Desk Research
Desk research started with building a clear view of the demand pool and the policy setting that shapes home storage adoption. Public sources such as the International Energy Agency, the US Energy Information Administration, Eurostat, national energy regulators, and customs and trade statistics were used to understand electricity prices, solar additions, grid events, and import trends that often pull storage demand forward.
We also reviewed company filings, investor presentations, press releases, and installer and association websites to cross-check product positioning and the typical configuration of residential systems. Patent databases were used selectively to track chemistry and safety-related direction, and a paid subscription for company financials and news helped validate revenue exposure and capacity announcements without leaning too heavily on press statements. These sources are illustrative, and we also referred to other public documents and datasets during data collection, validation, and research clarification.
Primary Interviews and Surveys
Primary work focused on interviews and structured surveys with battery and component suppliers, system integrators and installers, distributors, and energy-sector advisors who track residential adoption. Because this is a global market, we tested assumptions across APAC, EMEA, and the Americas, and used respondent input to confirm pricing movement, attachment rates with rooftop solar, and how backup-driven demand changes during grid stress events.
Distribution of primary research fieldwork respondents
| Company type | Respondent position | Region |
|---|---|---|
| Top tier: 25% | CXOs: 13% | APAC: 47% |
| Mid tier: 59% | Functional/Unit leaders: 40% | EMEA: 32% |
| Smaller Players: 16% | Managers: 47% | Americas: 21% |
Market-Sizing & Forecasting
Sizing was first built using a top-down logic where residential solar additions, household backup adoption, and country-level storage support policies were translated into an addressable install base. We then converted that base into yearly battery revenue using typical system size and blended pricing.
To keep totals realistic, we corroborated results with selective bottom-up checks, including sampled installer quotes, announced shipment and capacity signals, and channel feedback on mix shifts. Where the checks created a gap, we made adjustments based on the discrepancy.
Key inputs used in the model included rooftop solar installation volumes, average residential storage system capacity ranges, battery chemistry mix (since pricing differs by chemistry), typical replacement and warranty cycles, and residential electricity price levels that influence payback. For forecasting, scenario analysis was used because incentive structures and grid reliability vary by country. Scenario weights were refined using expert views on policy continuity and expected price declines. Where bottom-up signals were missing for smaller markets, we used proxy adoption curves from comparable countries and then sanity-checked the implied per-household penetration before finalizing.
Data Validation & Update Cycle
Validation was done by triangulating model outputs against independent signals such as residential solar deployment trends, import and production movement for relevant battery chemistries, and installer-reported backlog direction. If a country result looked out of line with these signals, we rechecked the drivers and re-contacted respondents to confirm whether the difference reflected a real change or a data issue.
Before sign-off, the model goes through a step-by-step review by another analyst who checks assumptions, units, and currency conversions, followed by a final variance scan across regions and years. The report is refreshed annually, and interim updates are made when major policy changes, supply disruptions, or sharp pricing moves occur. Right before delivery, a fresh pass is done so clients receive the latest updated view.
Mordor Intelligence's Residential Battery Market Size Measured Against Other Published Estimates
Published market values for residential batteries can look far apart because each publisher chooses its own rules for what counts as residential, how pricing is averaged, and which year is treated as the starting point for the forecast.
The spread usually comes from scope decisions, such as whether the count includes complete home energy storage systems versus just the battery pack, and whether virtual power plant participation is treated as part of residential revenue. Differences also show up when aggressive price-drop curves are used without sufficient checks from installer pricing, and when currency conversion is applied using a single point-in-time rate rather than an average over the year.
Benchmark comparison
| Source | Market Size | Gaps in Research Methodology |
|---|---|---|
| Mordor Intelligence | USD 26.02 B (2026) | |
| Industry Publisher A | USD 20.66 B (2026) | Often relies on a narrower definition closer to behind-the-meter home energy storage systems, and may apply more conservative blended ASP assumptions without explicitly testing installer-led pricing dispersion across countries. |
| Industry Publisher B | USD 21.47 B (2026) | May anchor the model on 2025 as the base year and roll forward with a different adoption curve, which can understate 2026 when solar-plus-storage attachment and backup-driven demand are accelerating in specific markets. |
The table shows that a few practical choices, such as whether battery-only revenue is counted versus full installed system revenue and how ASPs are carried forward, can move the 2026 number by several billions. By keeping the scope centered on factory-built residential batteries used in homes and cross-checking pricing and uptake with installer and policy signals, the estimate stays more repeatable across countries, a modeling choice applied by Mordor Intelligence.


Key Questions Answered in the Report
How large is the residential battery market in 2026?
The residential battery market size stood at USD 26.02 billion in 2026.
What CAGR is expected for residential battery installations to 2031?
Market revenue is forecast to rise at a 17.36% CAGR from 2026 to 2031.
Which region leads current adoption of home batteries?
Asia-Pacific holds 53.3% of global revenue, the largest regional share.
Which battery chemistry dominates household storage?
Lithium-ion, especially LFP variants, captured 72.9% residential battery market share in 2025.
What policy most accelerates U.S. residential storage uptake?
The 30% investment-tax credit extension through 2032 under the Inflation Reduction Act.
Page last updated on:


