
Technology, Media and Telecom
5th MayPricing Strategy for Semiconductor Components
3 Min Read
Reed Sensor Market is Segmented by Mounting Type (Surface Mount, PCB Through-Hole, and More), Contact Position (Form A (SPST-NO), Form B (SPST-NC), and More), Switching Capability (Low-Voltage/Signal (<30 V), Medium-Voltage (30–200 V), and More), Application (Automotive, Consumer Electronics and Home Appliances, and More), and Geography. The Market Forecasts are Provided in Terms of Value (USD).
Market Overview
| Study Period | 2020 - 2031 |
|---|---|
| Market Size (2026) | USD 2.15 Billion |
| Market Size (2031) | USD 2.98 Billion |
| Growth Rate (2026 - 2031) | 6.78 % CAGR |
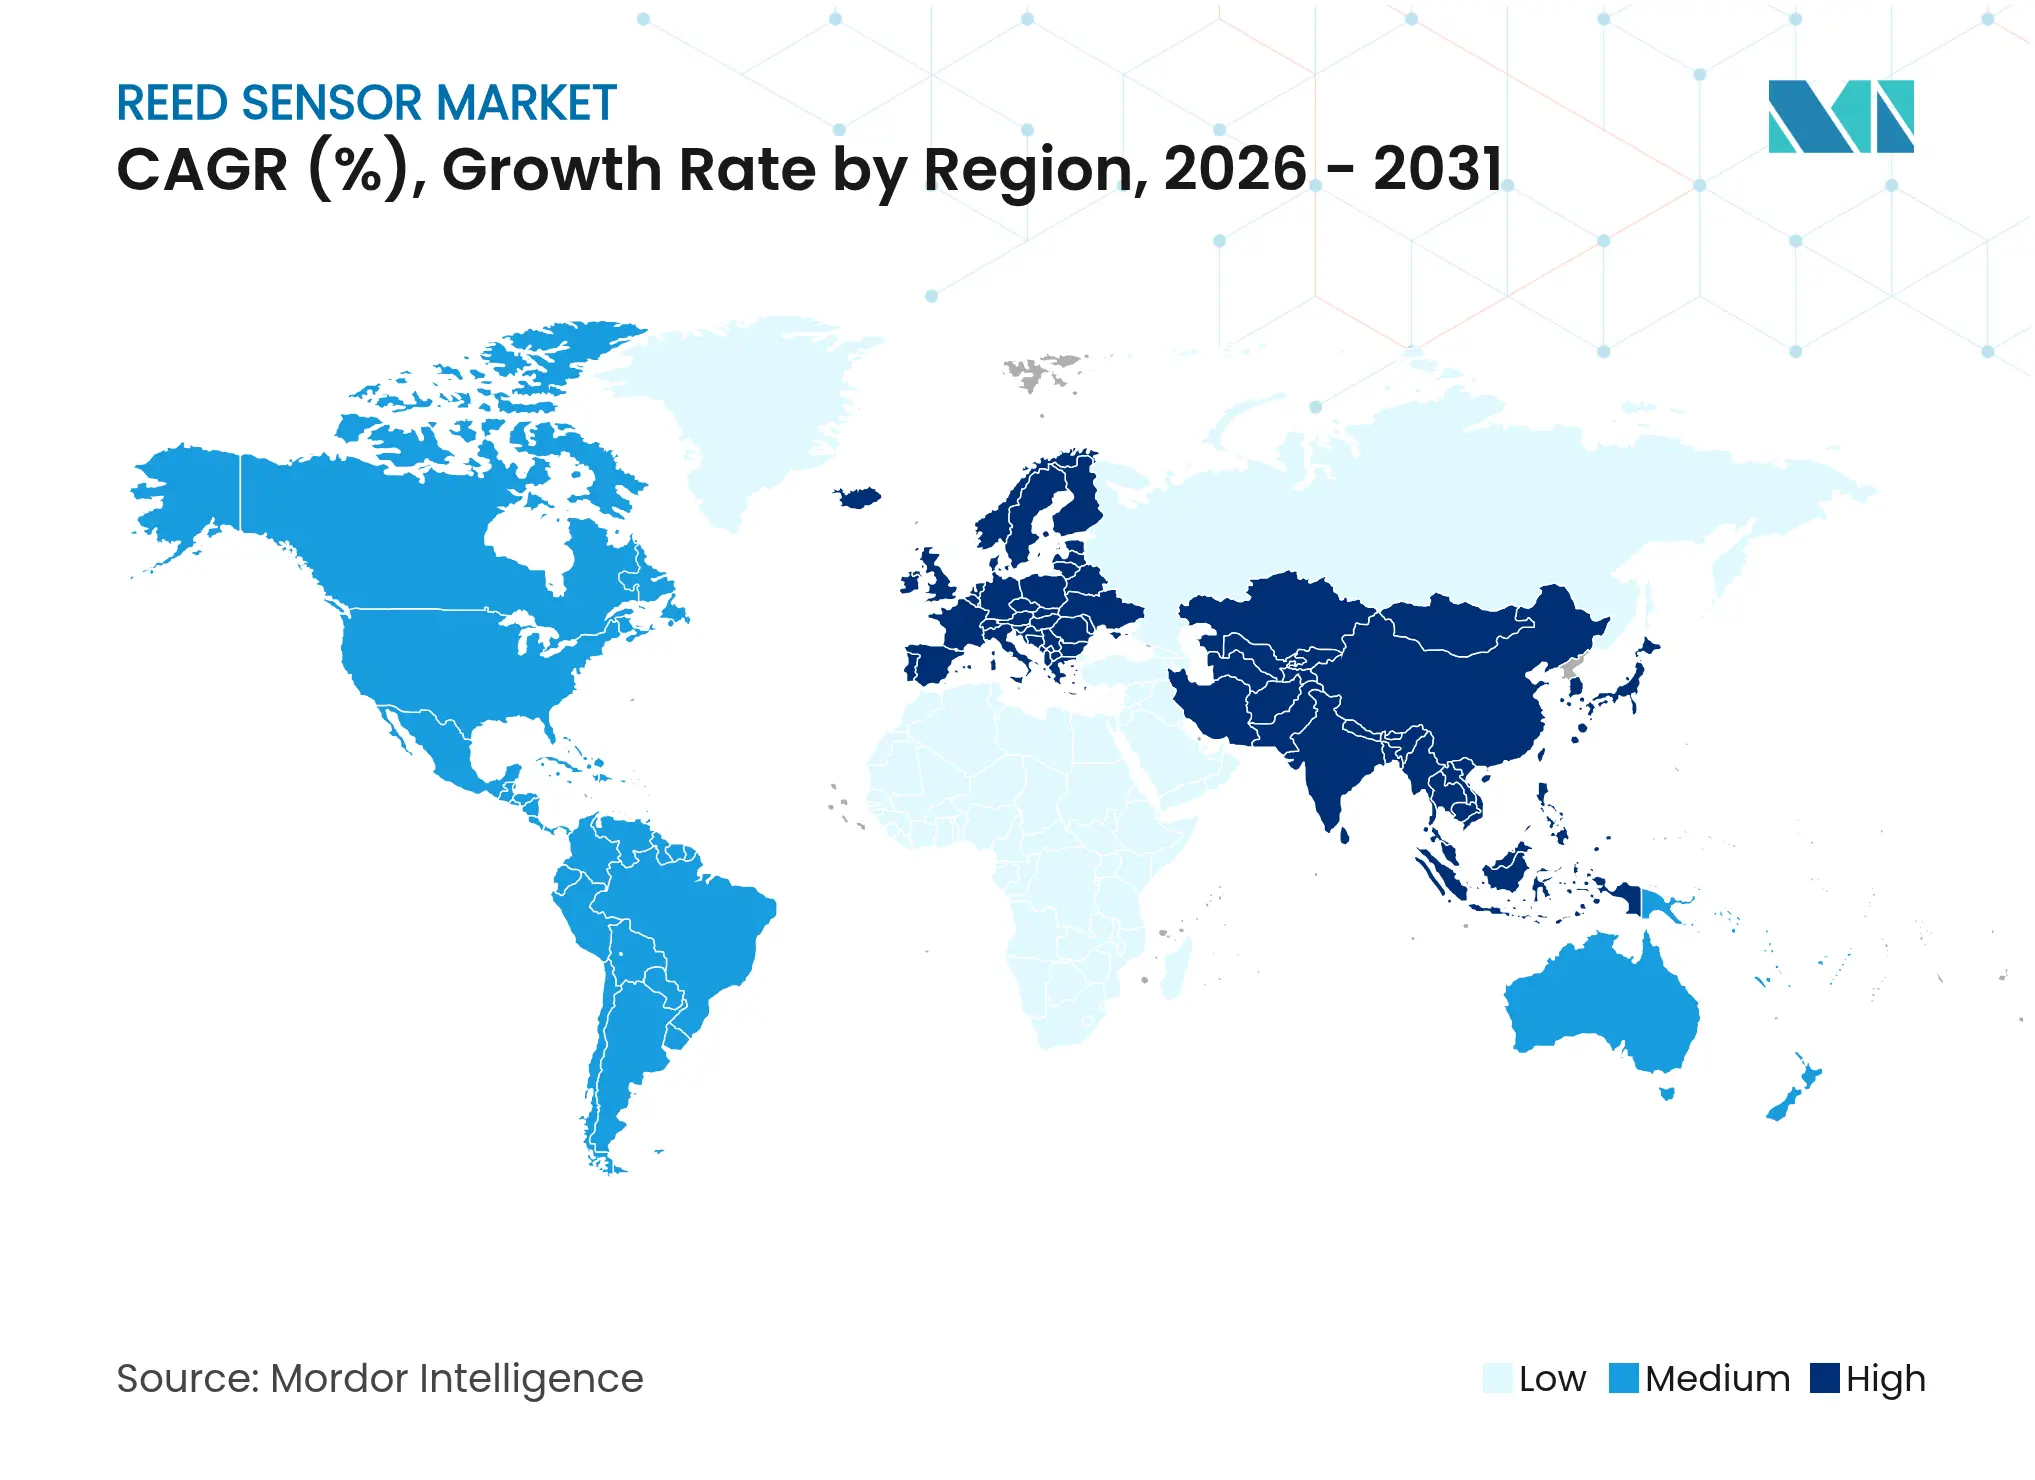
| Fastest Growing Market | Europe |
| Largest Market | Asia Pacific |
| Market Concentration | Medium |
Major Players *Disclaimer: Major Players sorted in no particular order. Image © Mordor Intelligence. Reuse requires attribution under CC BY 4.0. |
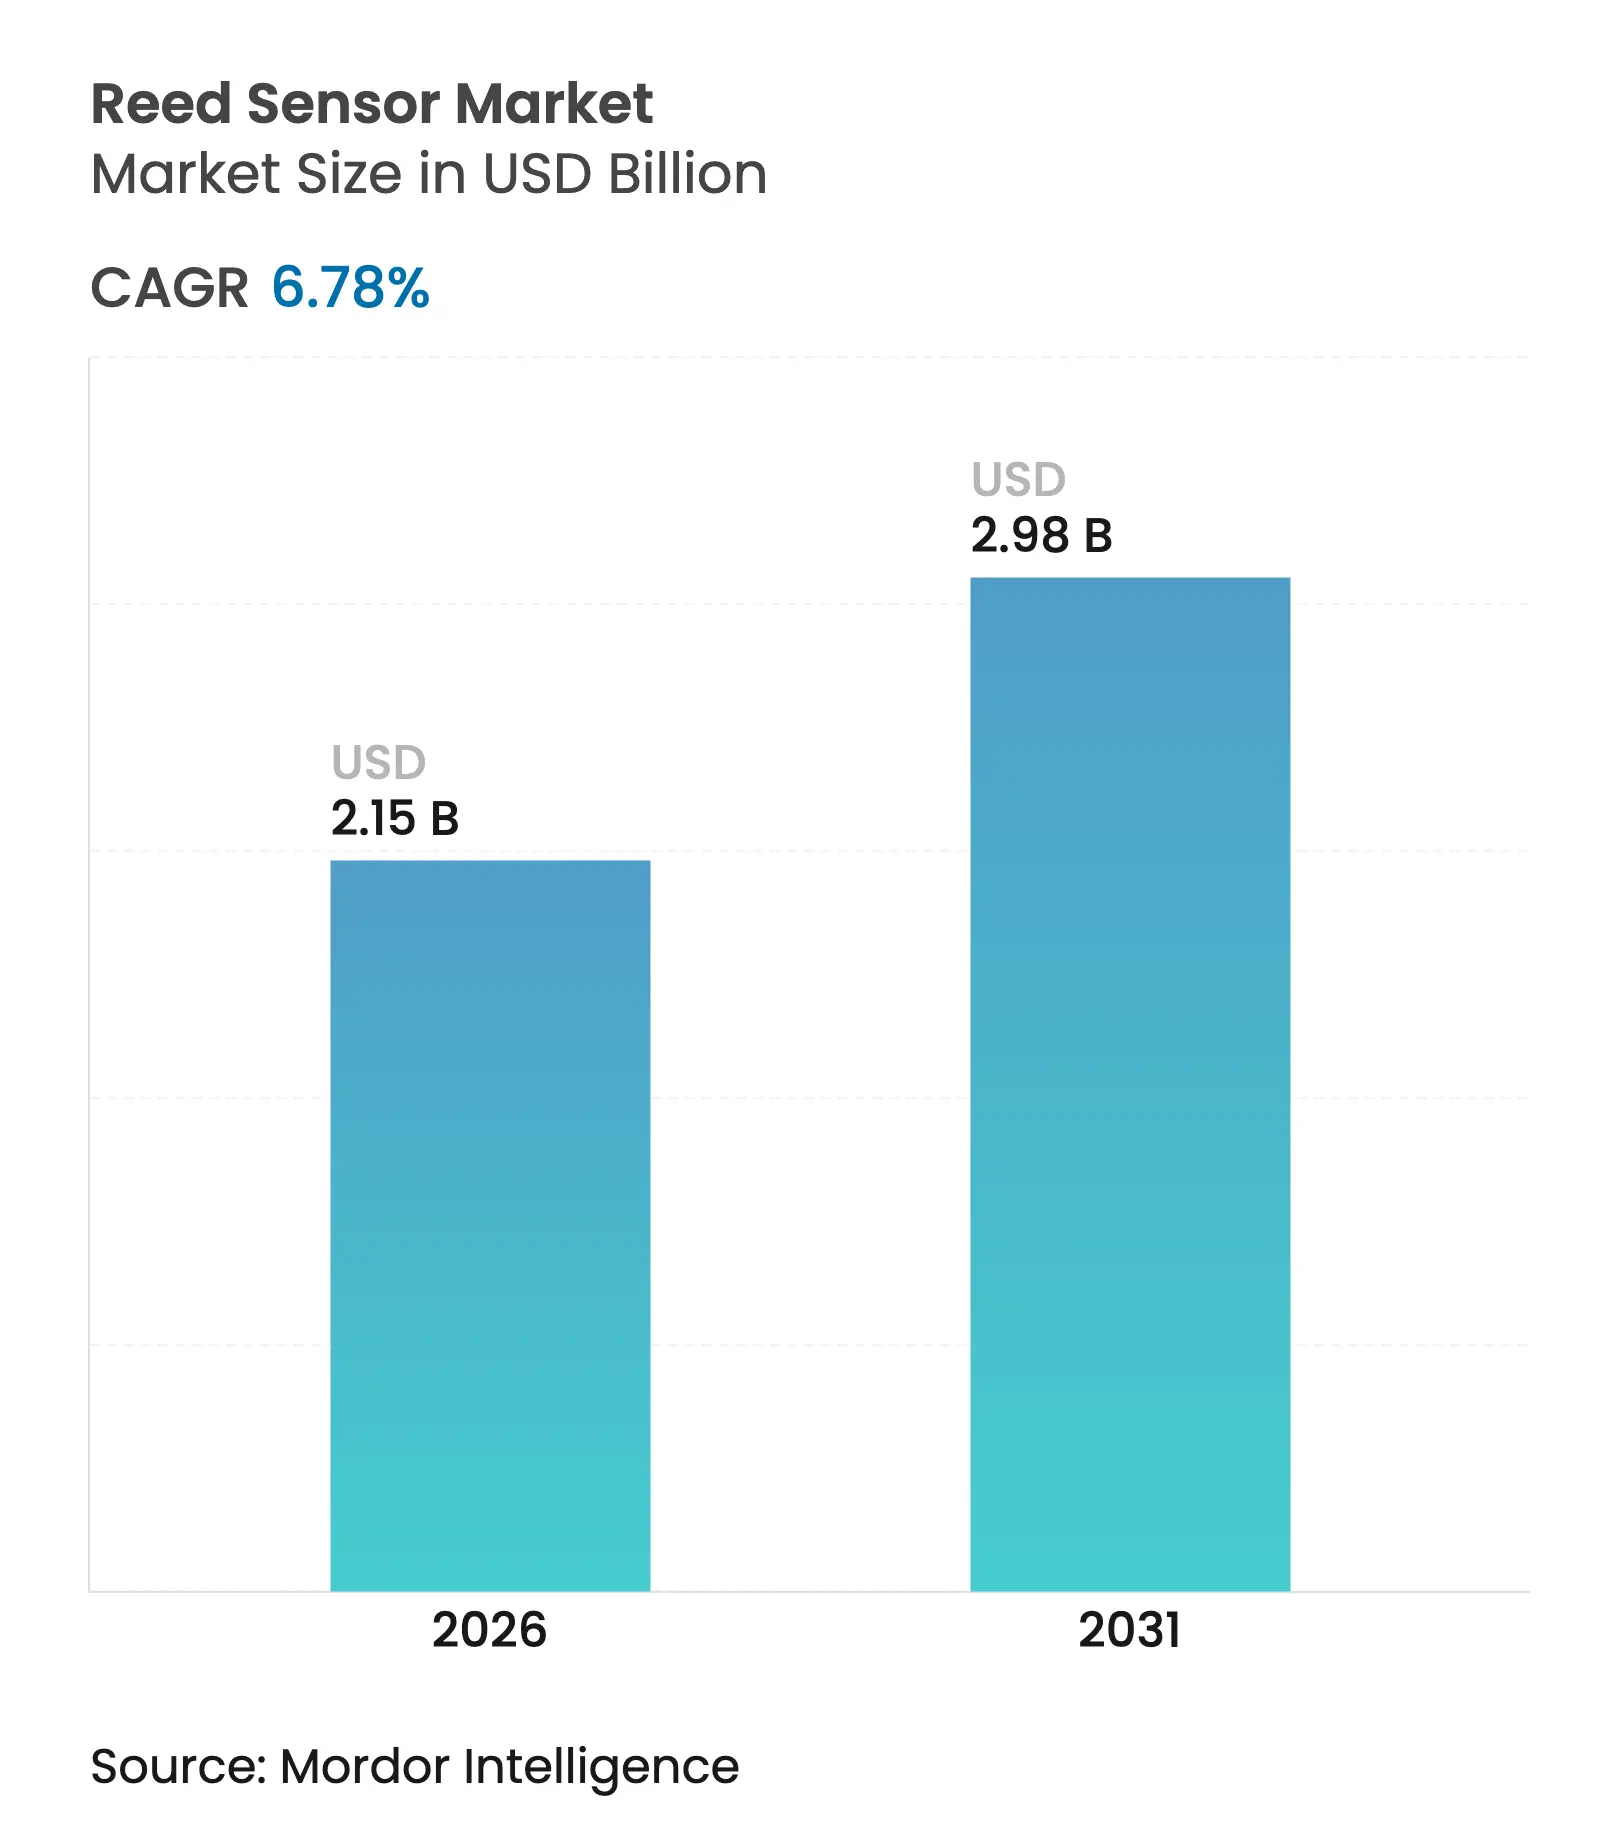
The Reed Sensor Market size was valued at USD 2.01 billion in 2025 and estimated to grow from USD 2.15 billion in 2026 to reach USD 2.98 billion by 2031, at a CAGR of 6.78% during the forecast period (2026-2031). Rising demand for intrinsically safe, hermetically sealed switching in electric-vehicle battery packs, hydrogen fuel-cell stacks, and outdoor smart-meter enclosures underpins this expansion. The reed sensor market continues to defend its niche against solid-state Hall and TMR alternatives by offering spark-free operation, zero-standby-power consumption, and proven 20-year field reliability in harsh conditions. Asia-Pacific remains the production engine, but Europe’s regulatory push for renewable energy and functional safety drives the fastest regional growth. Competitive intensity is moderate: global leaders leverage scale, vertically integrated glass processing, and material innovations such as nanostructured contacts to stretch product life and lower cost.
Key Report Takeaways
Note: Market size and forecast figures in this report are generated using Mordor Intelligence's proprietary estimation framework, updated with the latest available data and insights as of 2026.
Drivers Impact Analysis
| Driver | (~) % Impact on CAGR Forecast | Geographic Relevance | Impact Timeline | |||
|---|---|---|---|---|---|---|
Surge in low-power smart-grid metering Surge in low-power smart-grid metering | +1.8% | Europe and North America first movers; scaling globally | Medium term (2-4 years) | (~) % Impact on CAGR Forecast:+1.8% | Geographic Relevance:Europe and North America first movers; scaling globally | Impact Timeline:Medium term (2-4 years) |
EV battery-management adoption EV battery-management adoption | +2.1% | Core growth in Asia-Pacific with spill-over to North America, Europe | Short term (≤ 2 years) | |||
Industrial-4.0 retrofits and automation Industrial-4.0 retrofits and automation | +1.5% | Global, concentrated in major manufacturing hubs | Long term (≥ 4 years) | |||
Smart-home and IoT device proliferation Smart-home and IoT device proliferation | +1.2% | North America and EU leading; accelerating in Asia-Pacific | Medium term (2-4 years) | |||
Hydrogen fuel-cell safety systems Hydrogen fuel-cell safety systems | +0.8% | Early adoption in Europe and Asia-Pacific | Long term (≥ 4 years) | |||
Disposable medical-device mini-sensors Disposable medical-device mini-sensors | +0.6% | Global demand, adoption paced by regulatory approvals | Medium term (2-4 years) | |||
| Source: Mordor Intelligence | ||||||
Surge in Low-Power Smart-Grid Metering
Utilities replacing legacy meters with 20-year maintenance-free smart devices increasingly specify reed switches for pulse counting because magnetic actuation draws zero standby power. [1]Kamstrup, “Smart Electricity Meters for the Intelligent Grid,” kamstrup.com Hermetic sealing prevents condensation in outdoor enclosures, extending service life across –40 °C to +85 °C. Large-scale rollouts by firms such as Gridspertise—now surpassing 108 million units—confirm the scalability of reed-based designs. [2]Gridspertise, “Smart Meters: The Founding Element for Preparing Grids to the Future,” gridspertise.com Poland’s Tauron Dystrybucja already manages 5.6 million customers via automated reading that depends on magnetic pulse integrity. Continued grid digitalization until 2030 sustains demand for robust, battery-independent switching.
EV Battery-Management Adoption
Battery packs in electric and hydrogen vehicles require spark-free, reliable position and leakage sensing. Continental’s e-Motor Rotor Temperature Sensor trims temperature error to 3 °C, improving magnet optimization for efficiency. Honeywell’s electrolyte-leak sensor offers a 20-minute warning window for thermal-runaway events, using hermetically sealed contacts to avoid ignition sources. Marquardt applies reed elements in hydrogen cell voltage monitors to catch H₂ leaks before catastrophic failure. Accelerating EV adoption, therefore, adds a 2.1 percentage-point lift to the reed sensor market CAGR.
Industrial-4.0 Retrofits and Automation
Factories upgrading to Industry 4.0 standards add magnetic position sensing to countless pneumatic cylinders. Reed switches withstand vibration and welding-induced EMI that often disables solid-state sensors. Chinese robotics projects show local suppliers scaling reed designs to compete globally, reinforcing domestic uptake. Although inductive systems reach 10 kHz response rates, cost-sensitive lines still favor reed components for simple on/off feedback, providing long-term pull-through for the reed sensor market.
Smart-Home and IoT Device Proliferation
Door-and-window contacts in DIY security kits can operate for five years on a coin cell because reed switches consume no current until actuated. Academic work on LoRa backscatter alerts, triggered by magnetic state changes, enables battery-free intrusion detection at 1 km range. As Matter-enabled smart locks proliferate, interoperability standards still require the simple, fail-safe open-circuit signal that a reed sensor delivers.
Restraints Impact Analysis
| Restraint | (~) % Impact on CAGR Forecast | Geographic Relevance | Impact Timeline | |||
|---|---|---|---|---|---|---|
Solid-state (Hall/TMR) sensor substitution Solid-state (Hall/TMR) sensor substitution | –1.4% | Global, fastest erosion in automotive applications | Short term (≤ 2 years) | (~) % Impact on CAGR Forecast:–1.4% | Geographic Relevance:Global, fastest erosion in automotive applications | Impact Timeline:Short term (≤ 2 years) |
Reliability issues in high-vibration zones Reliability issues in high-vibration zones | –0.8% | Industrial automation and automotive environments | Medium term (2-4 years) | |||
Glass-tube supply-chain constraints Glass-tube supply-chain constraints | –0.6% | Global, exposure highest where specialized glass is scarce | Long term (≥ 4 years) | |||
EMI issues in dense EV powertrains EMI issues in dense EV powertrains | –0.4% | Primarily automotive sector, especially electric vehicles | Short term (≤ 2 years) | |||
| Source: Mordor Intelligence | ||||||
Solid-State Sensor Substitution
Hall and TMR ICs now ship with in-package diagnostics and ASIL-D compliance, raising competitive pressure in automotive steering and pedal modules. [3]Melexis, “Safe and Stray-Field-Robust Magnetic Sensors,” melexis.com Inductive linear sensors achieve ±0.85% accuracy over 12 mm, eclipsing typical reed tolerances. These solid-state gains shave 1.4 percentage points from the reed sensor market CAGR, though price-sensitive alarms and liquid-level gauges still choose reed parts.
Reliability Issues in High-Vibration Zones
Above 20 Hz, reed contacts can bounce, generating noise and shortening the life in engine bays or stamping presses. Glass-encased switches risk fracture in shocks exceeding 50 G. Glass composition advances improve toughness, yet deployment in turbocharged engine compartments remains limited, trimming 0.8 percentage points from market growth.
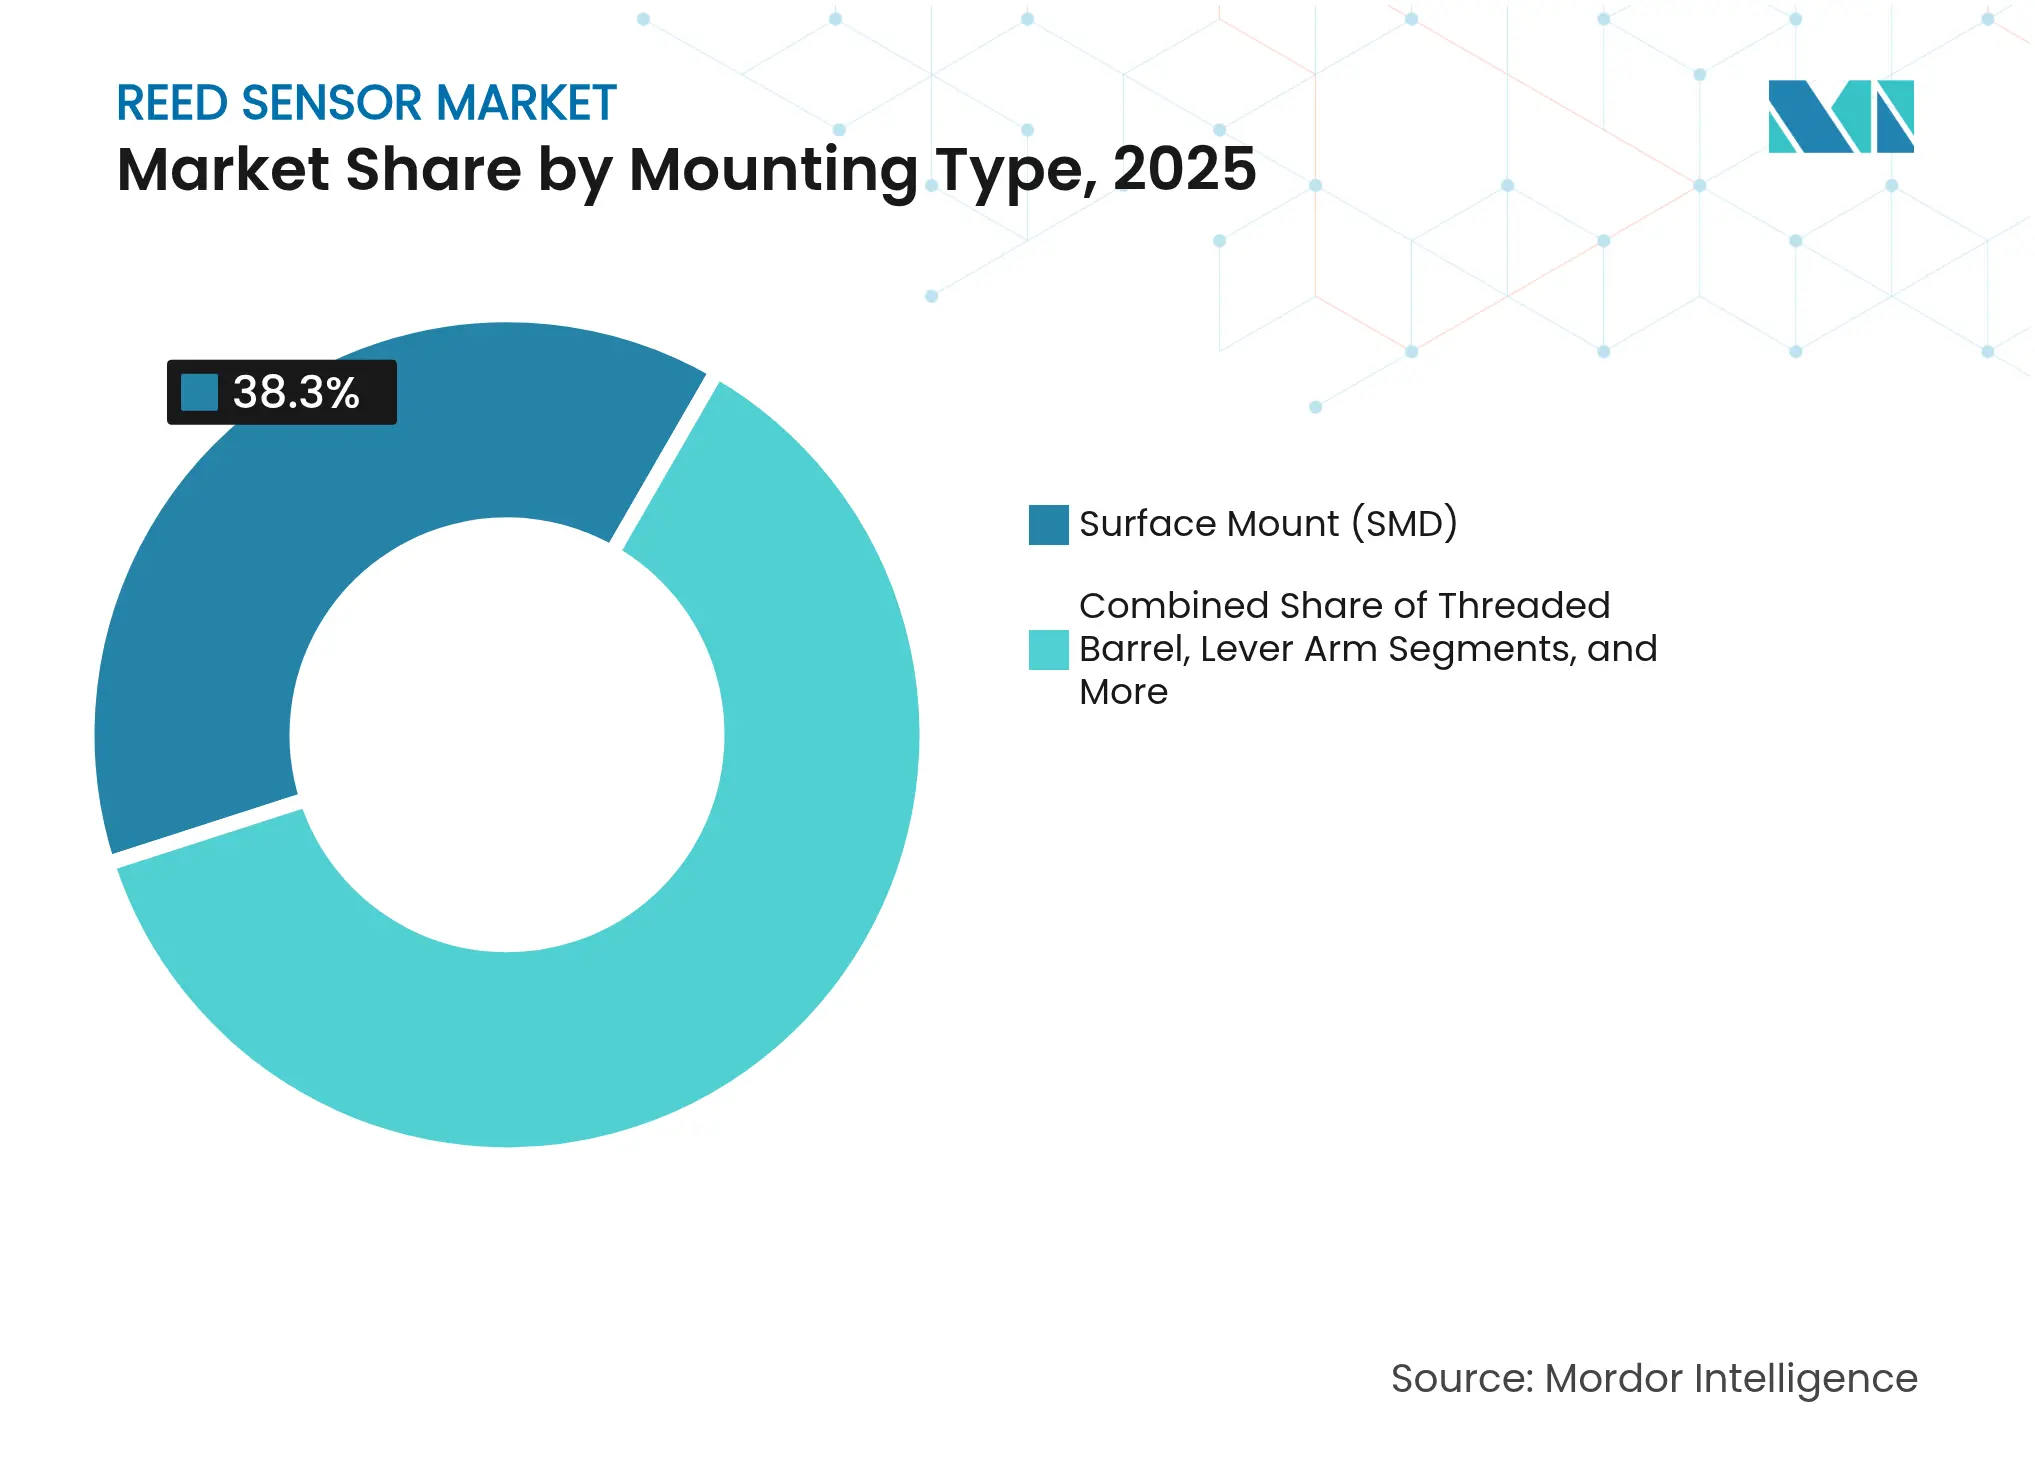
By Mounting Type: SMD Drives Miniaturization and Scale
Surface-mount devices delivered 38.30% of the reed sensor market share in 2025, reflecting automated pick-and-place economics on high-volume consumer boards. Threaded-barrel sensors for pneumatic cylinders shape the strongest 8.05% CAGR, aligned with the industrial automation wave that lifts overall reed sensor market growth. The reed sensor industry also retains through-hole models for legacy appliances, while flange packages secure aerospace demand for hermeticity. Firecracker formats suit laptop lid detection, where profile height is paramount. Over the forecast period, SMD adoption lowers assembly labor, widens design wins in wearables, and sustains at-scale pricing advantages for leading suppliers.
Demand for threaded-barrel products pairs with a proliferation of cylinder-count feedback points in brownfield factories, creating sustained pull. Cylindrical housings safeguard contacts from oil and metal shavings, keeping warranty claims low. The reed sensor market size for these rugged units is forecast to expand at an 8.05% CAGR to 2031, translating into USD 0.66 billion of incremental revenue. Line builders prefer threaded inserts because they retrofit without bracket changes, illustrating how mechanical compatibility protects the reed sensor market from quick substitutability.
Note: Segment shares of all individual segments available upon report purchase
By Contact Position: Form A Holds Lead as Latching Gains
Form A switches commanded 40.85% of the reed sensor market in 2025 because normally-open circuits provide fail-safe logic in security and liquid-level alarms. Latching Form E designs, however, log the highest 8.22% CAGR as battery-run IoT tags seek near-zero quiescent current. Advancements in nanostructured contacts quadruple life cycles, bolstering uptake in smart meters and asset trackers.
Form B normally-closed types cater to HVAC fan guards, while Form C changeover contacts find traction in PLC-controlled process valves. The reed sensor market size for bistable Form E models is set to reach USD 0.46 billion by 2031, capitalizing on the migration of legacy reed relays to duty-cycled wireless nodes. As these devices remember state without power, maintenance teams cut service frequency, adding quantifiable OPEX savings that reinforce the adoption curve across the reed sensor industry.
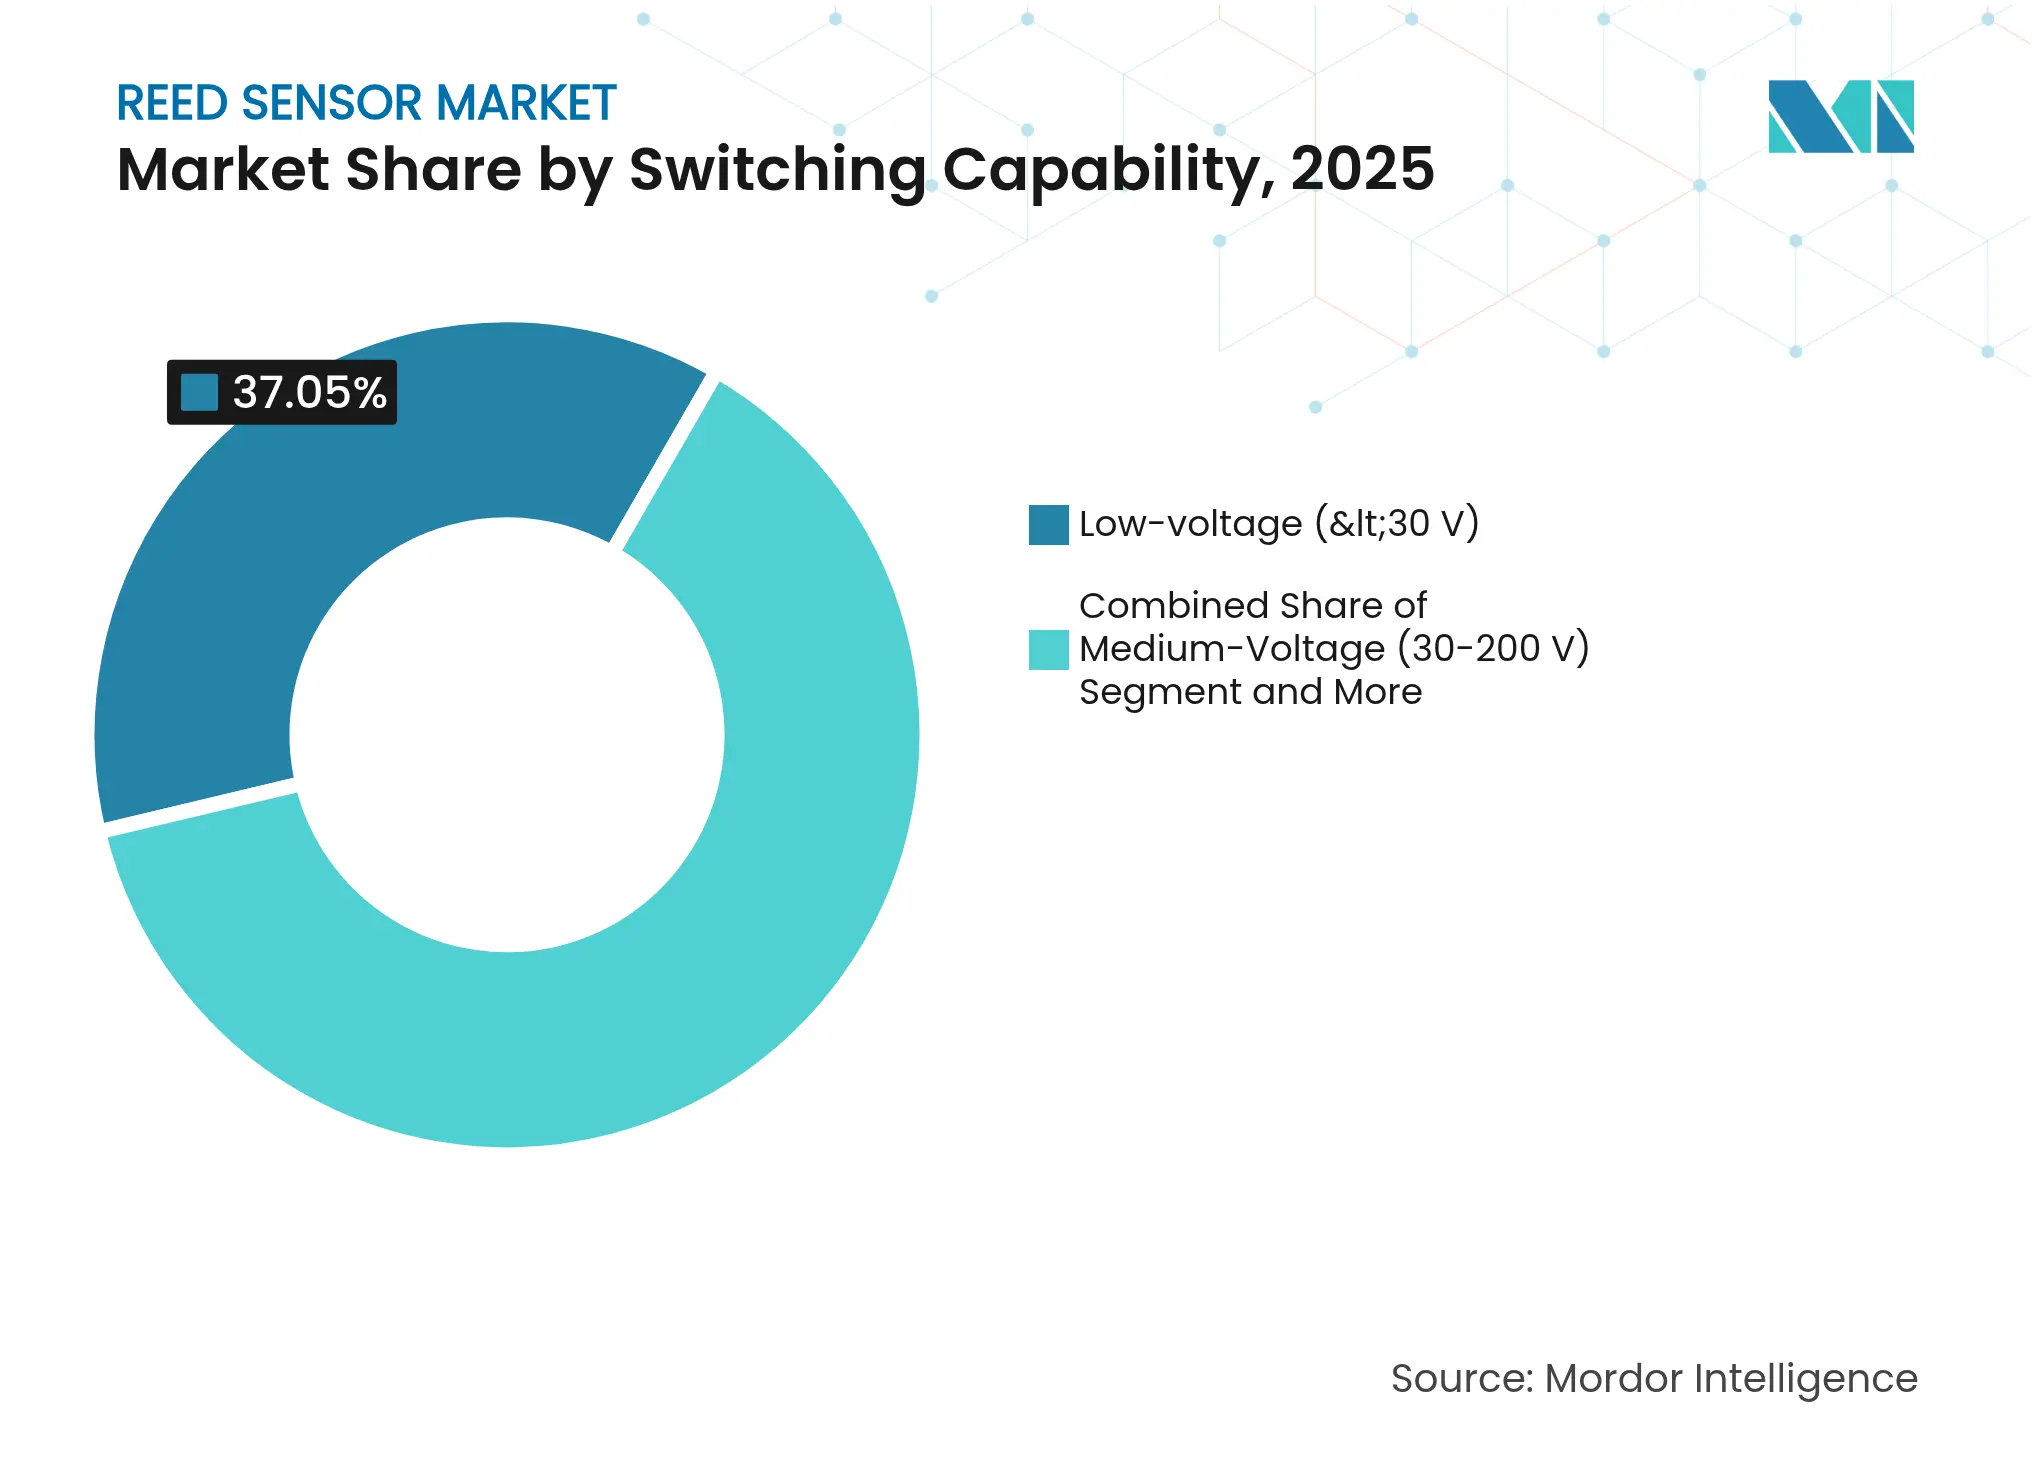
By Switching Capability: Low-Voltage Leads, High-Voltage Surges
Low-voltage (<30 V) units sustained 37.05% revenue in 2025, underpinning alarm panels and IoT wearables. Conversely, demand for >200 V ratings climbs 8.79% annually as DC fast-charging and solar-string monitoring proliferate. High-voltage growth elevates average selling prices, insulating suppliers from commoditization.
The reed sensor market size within the high-voltage tier is slated to nearly double to USD 0.63 billion by 2031. Standex’s 120 W reed switch shows that optimized glass length and in-circuit epoxy absorb inductive kickback at 1 A without welding. Pyrotechnic hybrids such as Sensata’s 1 ms PyroFuse adopt reed-triggered firing loops, highlighting cross-fertilization between traditional glass-tube physics and safety-critical disconnect technology.
Note: Segment shares of all individual segments available upon report purchase
By Application: Automotive Still Tops as Automation Accelerates
Automotive applications retained 31.05% of the reed sensor market share in 2025, spanning door ajar, seat-belt buckle, and fluid-level functions. Yet industrial automation exhibits a faster 9.12% CAGR because every retrofitted pneumatic cylinder or AGV requires at least two position switches.
The reed sensor market size attached to industrial automation could overtake automotive revenue by 2029 if the projected USD 0.9 billion upgrade spend on cylinder sensing materializes. In assembly plants, reed switches tolerate welding EMI and lubricants better than optics. Meanwhile, consumer electronics retain moderate volume through laptop lids and appliance doors. Healthcare deployments rise in single-use catheters and infusion pumps, where contactless magnetic activation avoids contamination.
Asia-Pacific generated 40.10% of the reed sensor market revenue in 2025, powered by China’s CNY 285 billion sensor economy and its dense glass-tube manufacturing base. National incentives for local content in electric vehicles and smart factories steer OEMs toward domestic reed suppliers, yet imported specialty glass still underpins high-voltage grades. Japan’s precision process control and South Korea’s smartphone assembly ensure steady high-volume consumption, while India’s passenger-car build-out triggers new door-ajar fitments that raise overall demand.
Europe is the fastest-growing region at an 8.25% CAGR through 2031 as Euro 7 rules tighten functional safety and as offshore wind farms require hermetically sealed limit switches. SICK and Endress+Hauser’s 730-staff joint venture exemplifies regional consolidation in process analytics that integrates reed contacts for reliable flow measurement. Nordic utilities swapping 100% of electromechanical meters for smart endpoints also lift volumes. German machine builders embed threaded-barrel sensors into pneumatic slides, reinforcing the region’s pull on industrial-grade reed volume.
North America advances at a healthy mid-single-digit pace. Utilities specify 20-year outdoor smart meters that often rely on reed pulse contacts; state decarbonization mandates accelerate rollouts. Littelfuse’s USD 554 million Q1 2025 revenue underscores demand resilience, with data-center power distribution and EV service equipment fueling sensor uptake. Aerospace requirements for Mil-Spec glass and contacts keep US niche suppliers profitable. Mexico’s light-truck plants add door and seat-belt switches, while Canadian renewables projects expand high-voltage application opportunities.
Market Concentration
The reed sensor market is moderately fragmented: the top five brands control an estimated 55–60% of global revenue, leaving room for regional challengers. Standex Electronics remains the volume leader with fully captive glass drawing, automated contact plating, and in-house molding. Littelfuse scales adjacent relays and PPTC polymers to win cross-line contracts, evidenced by its 4% sales lift and margin expansion in early 2025.
Strategic moves focus on capability broadening. SICK’s partnership with Endress+Hauser integrates gas-analysis know-how to attack process-industry retrofit budgets. [4]Endress+Hauser, “SICK and Endress+Hauser Sign Strategic Partnership,” endress.com Sensata targets EV safety with its 1 ms PyroFuse, adding premium differentiation in high-voltage cut-off circuits. Meanwhile, PIC GmbH combines reed, Hall, and TMR inside hybrid sensor modules to hedge against technology substitution risk.
Innovation concentrates on materials. Nanostructured surfaces remove costly rhodium while tripling wear resistance. Self-restoring nitride coatings extend high-current ratings, opening new solar combiner box sockets. Patent filings on tailored glass compositions enhance thermal-shock endurance, a critical differentiator for >200 V units. Cost-optimized Chinese entrants such as Dongguan Bailing profit from domestic robotics growth but still trail global brands on high-voltage performance.

*Disclaimer: Major Players sorted in no particular order
1. INTRODUCTION
2. RESEARCH METHODOLOGY
3. EXECUTIVE SUMMARY
4. MARKET LANDSCAPE
5. MARKET SIZE AND GROWTH FORECASTS (VALUES)
6. COMPETITIVE LANDSCAPE
7. MARKET OPPORTUNITIES AND FUTURE TRENDS
Market Definitions and Key Coverage
Segmentation Overview
Detailed Research Methodology and Data Validation
Primary Research
Desk Research
Market-Sizing & Forecasting
Data Validation & Update Cycle
Why Our Reed Sensor Baseline Commands Reliability
Benchmark comparison
| Market Size | Anonymized source | Primary gap driver | ||
|---|---|---|---|---|
USD 2.01 B (2025) | Mordor Intelligence | Anonymized source:Mordor Intelligence | Primary gap driver: | |
USD 2.30 B (2023) | Global Consultancy A | Includes Hall-effect sensors and 2017 FX rates | ||
USD 1.87 B (2025) | Industry Journal B | Limited to five OEM shipment surveys, no tariff adjustment | ||
USD 2.39 B (2025) | Research Firm C | Straight-line EV growth, omits appliance retrofits |
Pricing Strategy for Semiconductor Components
3 Min Read
Accelerating Additive Manufacturing Adoption in India
3 Min Read
When decisions matter, industry leaders turn to our analysts. Let’s talk.