Market Overview
| Study Period | 2020 - 2031 |
|---|---|
| Forecast Data Period | 2026 - 2031 |
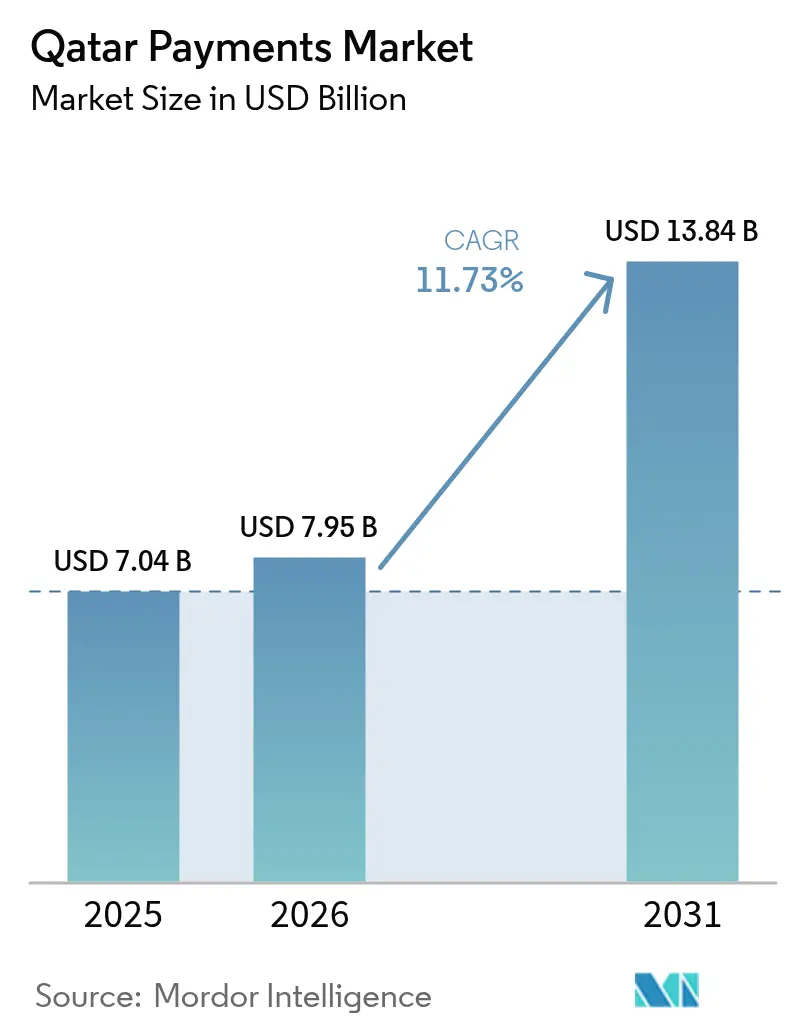
| Base Year Market Size (2025) | USD 7.04 Billion |
| Market Size (2026) | USD 7.95 Billion |
| Market Size (2031) | USD 13.84 Billion |
| Growth Rate (2026 - 2031) | 11.73% CAGR |
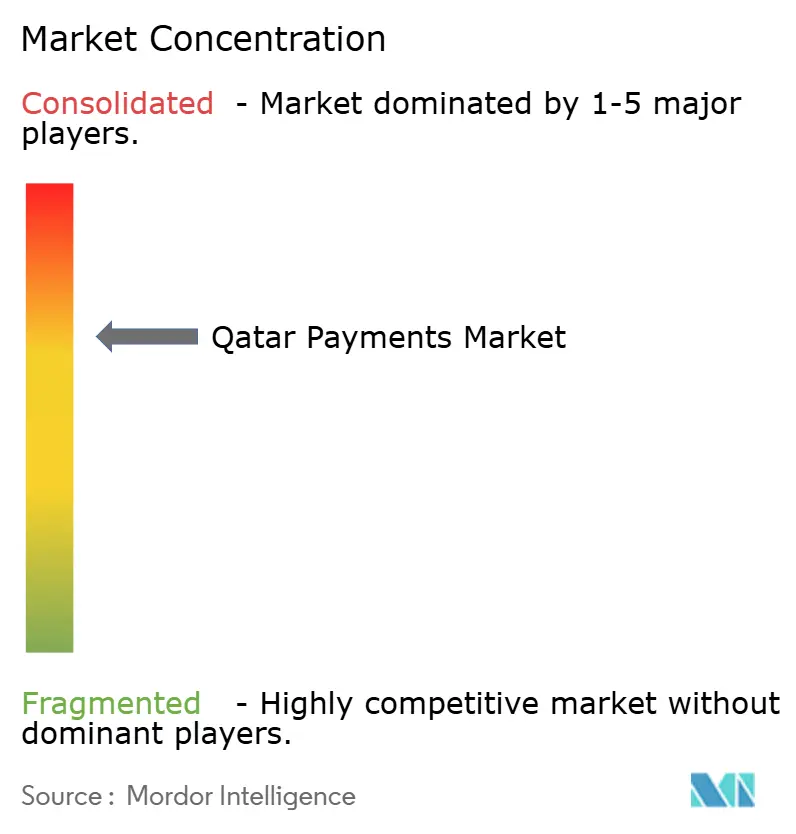
| Market Concentration | Medium |
Major Players*Disclaimer: Major Players sorted in no particular order Image © Mordor Intelligence. Reuse requires attribution under CC BY 4.0. | |
Qatar Payments Market Analysis by Mordor Intelligence
The Qatar payments market size is projected to expand from USD 7.04 billion in 2025 and USD 7.95 billion in 2026 to USD 13.84 billion by 2031, registering a CAGR of 11.73% between 2026 and 2031. A decade of digitization has been compressed into three years as government-mandated instant-payment rails, the FIFA 2022 infrastructure legacy, and fast-track mobile-wallet licensing re-wired the country’s entire transaction stack. Corporate treasuries adopted the real-time Fawran system almost overnight, so high-value business-to-business flows now bypass card networks, while consumer-facing merchants still rely on interchange-based rails. Contactless acceptance reached 96% of all in-store digital payments by late 2024, which has lowered the cost of onboarding micro-merchants and pushed cash deeper into the long tail of informal trade. Parallel licensing of global wallets and telecom-backed wallets has intensified competition, forcing banks to pivot from issuer-centric models to platform plays that capture merchant-acquiring margins.
Key Report Takeaways
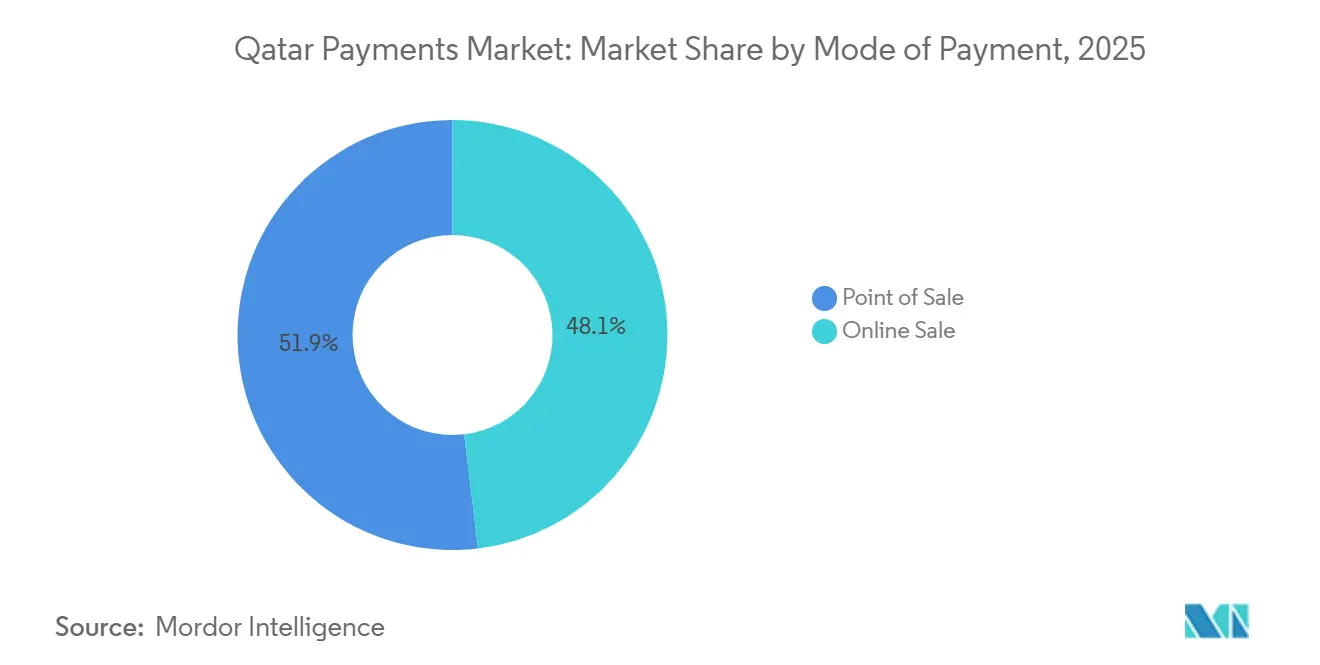
- By mode of payment, point-of-sale transactions led with 51.89% share of the Qatar payments market in 2025, whereas online channels are projected to grow at a 13.43% CAGR to 2031.
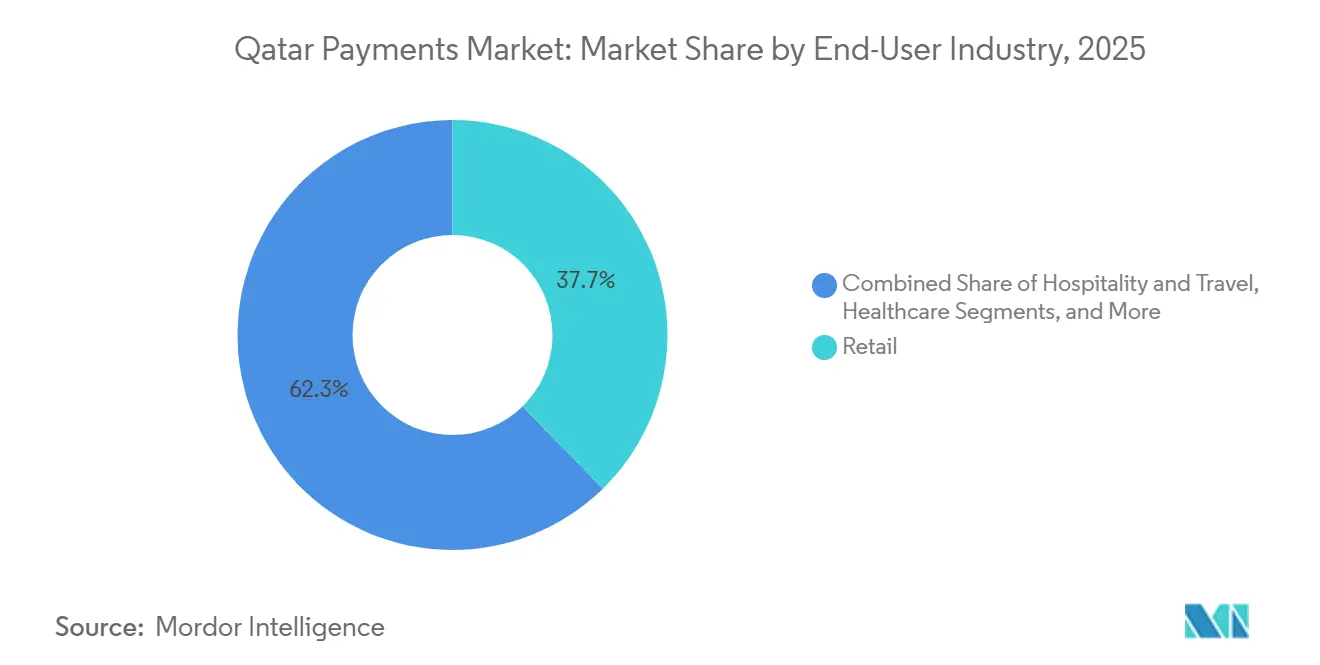
- By end-user industry, retail accounted for 37.67% of the Qatar payments market size in 2025, whereas hospitality and travel is advancing at a 12.24% CAGR through 2031.
Note: Market size and forecast figures in this report are generated using Mordor Intelligence’s proprietary estimation framework, updated with the latest available data and insights as of 2026.
Qatar Payments Market Trends and Insights
Drivers Impact Analysis*
| Driver | (~) % Impact on CAGR Forecast | Geographic Relevance | Impact Timeline |
|---|---|---|---|
| Government-Led National Payments Infrastructure Modernization | +3.2% | National, highest in Doha and Al Rayyan | Medium term (2-4 years) |
| FIFA 2022 Legacy Accelerating Contactless Merchant Acceptance | +2.8% | Nationwide retail and hospitality corridors | Short term (≤ 2 years) |
| Surging Mobile-Wallet Penetration Across Consumer Segments | +2.5% | National, stronger among expatriates | Medium term (2-4 years) |
| Financial Inclusion Push Through Qatar Mobile Payment System | +1.4% | National, unbanked and underbanked focus | Long term (≥ 4 years) |
| Mandated Instant-Payment Rails Go-Live Boosting A2A Payments | +1.8% | Corporate and government sectors | Short term (≤ 2 years) |
| Digital Rial Pilot Catalyzing Tokenized Deposit Adoption | +0.6% | Wholesale first, potential retail | Long term (≥ 4 years) |
| Source: Mordor Intelligence | |||
Government-Led National Payments Infrastructure Modernization
The launch of Fawran in October 2024 delivered 24-hour, real-time gross settlement for account-to-account transfers, and within nine months, the rail captured one-fifth of national payment value despite only 3.24 million active accounts. Direct fintech access to the National Automated Payment System, granted in April 2025, opened the rails to non-bank aggregators and mirrored India’s UPI architecture.[1]Qatar Central Bank, “Fawran Instant Payment System Launch,” QCB.GOV.QA The December 2024 digital-bank framework enforced QAR 100 million (USD 27.44 million) paid-up capital and data-localization rules, creating high entry barriers that nevertheless invite well-capitalized regional challengers. Compliance with PCI-DSS and mandatory domestic processing keeps sensitive data in-country, aligning regulatory oversight with cybersecurity priorities. Together, these measures lift the Qatar payments market toward real-time, open-access competition without sacrificing systemic safety.
FIFA 2022 Legacy Accelerating Contactless Merchant Acceptance
Visa deployed 5,300 terminals for the World Cup and achieved 89% contactless use inside stadiums, setting consumer expectations that spilled over into daily commerce. By November 2024, 96% of all in-store digital payments were tap-to-pay, a penetration level that exceeds many European benchmarks. Visa’s tap-to-phone software multiplied transaction volumes at taxi, courier, and car-wash operators, shrinking hardware costs for micro-merchants. Biometric pilots run with PopID remain on standby for regulatory approval, but the infrastructure investment has been sunk, limiting incremental cost for future roll-outs. The World Cup thus converted acceptance into a baseline requirement rather than a merchant differentiator, accelerating cash displacement inside the Qatar payments market.
Surging Mobile-Wallet Penetration Across Consumer Segments
Registered e-wallets reached 1.2 million by mid-2025 and processed QAR 166 million across 170,000 transactions in April 2025 alone. Apple Pay, Samsung Pay, and Google Pay attained blanket bank acceptance in 2022, while Ooredoo Money and iPay launched licensed services in 2025, benefiting from telecom verification data. A November 2024 Ooredoo-PayPal tie-up bridged local and global networks, and a September 2025 UPI acceptance addressed the needs of 700,000 Indian expatriates. Wallet transactions are projected to hit QAR 65 billion (USD 17.8 billion) by 2028, or 34% of digital payments value, reshaping consumer expectations for speed and embedded experiences.
Financial Inclusion Push Through Qatar Mobile Payment System
Wallet registration equals 43% of the population, yet usage trails cards and Fawran transfers, as only 2% of national payment value flowed through the platform by July 2025. Qatar Islamic Bank’s QIB Lite and 71% digital account-origination ratio indicate that incumbents target underserved segments with simplified interfaces instead of fee discounts.[2]Qatar Central Bank, “Retail payment systems,” qcb.gov.qa Tiered e-wallet limits based on verification levels mirror India’s KYC rules, balancing access with anti-money-laundering safeguards. The challenge is conversion from registration to activity, which remains the key unlock for sustained inclusion in the Qatar payments market.
Restraints Impact Analysis*
| Restraint | (~) % Impact on CAGR Forecast | Geographic Relevance | Impact Timeline |
|---|---|---|---|
| Fragmented Acceptance of Domestic QR Standard Across SMEs | -1.5% | Traditional souqs and small retail clusters | Medium term (2-4 years) |
| Cyber-Security and Fraud Concerns Undermining Consumer Trust | -1.8% | Nationwide, heightened after data breaches | Short term (≤ 2 years) |
| Delayed Open-Banking Regulation Limiting Fintech Innovation | -1.2% | National, third-party services constrained | Long term (≥ 4 years) |
| Low-Ticket Transaction Mix Compressing Interchange Margins | -0.9% | National, merchant-acquiring economics | Medium term (2-4 years) |
| Source: Mordor Intelligence | |||
Fragmented Acceptance of Domestic QR Standard Across SMEs
Multiple proprietary QR solutions, such as CB Paylink at Commercial Bank, force merchants to display several codes or join aggregator platforms, raising reconciliation complexity and cost.[3]Commercial Bank of Qatar, “CB Paylink QR Solution,” CBQ.QA Unlike Saudi Arabia’s mada or the UAE’s Aani, Qatar lacks a single interoperable QR mandate, so network effects remain diluted. Micro-merchants, especially in traditional souqs, revert to cash when fragmented standards outweigh the benefit of digital acceptance. Unless the regulator enforces interoperability, the Qatar payments market risks a two-tier ecosystem where large retailers enjoy seamless QR while small businesses lag.
Cyber-Security and Fraud Concerns Undermining Consumer Trust
A July 2024 central-bank warning on ATM skimming and the unresolved reputational fallout from Qatar National Bank’s 2016 breach have heightened customer anxiety. PCI-DSS 4.0 certification at Qatar International Islamic Bank demonstrates progress, yet ecosystem gaps persist. December 2025 GSMA Open Gateway APIs for SIM-swap detection were launched by Ooredoo and Vodafone, but adoption depends on third-party integration. With 33% of Middle East and North Africa consumers having experienced fraud, false declines, and synthetic-identity attacks remains a structural brake on digital-payment growth.
*Our forecasts treat driver/restraint impacts as directional, not additive. The impact forecasts reflect baseline growth, mix effects, and variable interactions.
Segment Analysis
By Mode of Payment: Online Growth Surpasses Physical Spend
Point-of-sale transactions accounted for 51.89% of the Qatar payments market share in 2025, demonstrating the continued primacy of in-store spending within the Qatar payments market size. Online channels, however, are projected to advance at a 13.43% CAGR through 2031, outpacing every other payment mode and gradually eroding the dominance of physical terminals. Card rails processed an estimated QAR 12.5 billion (USD 3.4 billion) in monthly volume as of mid-2025, yet digital wallets captured incremental traffic with annual growth of 26% in e-commerce and 21% at physical points of sale, signaling a decisive shift toward tokenized credentials. The August 2025 rollout of Mastercard Gateway Hosted Checkout removed the technical burden of integrating multiple wallets, allowing merchants to activate Apple Pay, Google Pay, and Samsung Pay through a single dashboard. Declining hardware costs, courtesy of tap-to-phone solutions, have expanded acceptance among micro-merchants that previously relied on cash. As real-time settlement via Fawran becomes ubiquitous, merchants increasingly favor account-to-account payments for large-ticket invoices, reserving card networks for small discretionary purchases where loyalty benefits still matter.
E-commerce adoption accelerates as logistics firms cut last-mile delivery fees and as buy-now-pay-later options grow more visible at checkout. Corporate virtual cards now underwrite procurement spend, combining fraud controls with single-use numbers that map neatly into enterprise resource planning platforms. Prepaid cards funded by salary transfers offer lower interchange, meeting cost-sensitive merchant demands and serving expatriate workers who dominate Qatar’s labor market. Escrow requirements under the Payment Services Regulation safeguard prepaid balances, reinforcing trust among users with limited credit histories. Cash usage recedes further each quarter, and, by 2031, online channels are expected to rival in-store volumes, an inflection that will redraw revenue pools for banks, processors, and alternative lenders inside the Qatar payments market.


By End-User Industry: Travel and Hospitality Lead Growth Curve
Retail led spending with 37.67% of the Qatar payments market size in 2025, reflecting the nation’s mall-centric consumer culture and elevated household incomes. Nonetheless, hospitality and travel is set to expand at a 12.24% CAGR through 2031, the fastest pace among all industries, buoyed by Hamad International Airport’s position as a regional transit hub and a steady influx of energy-sector business travelers. Hotels, airlines, and travel agencies rapidly integrate digital wallets and installment solutions so international guests can split high-value purchases without bearing credit-card interest. Qatar Airways, for instance, embeds wallet payments directly in its booking flow, eliminating friction for mobile-first customers. Retailers respond with omnichannel strategies that synchronize loyalty points and payment tokens across physical stores and apps, ensuring consistency of experience while defending share from pure-play e-commerce rivals.
Healthcare lags as a digital payer because employer-sponsored insurance still directs most flows through business-to-business settlement, but telemedicine copays are nudging consumers toward instant wallet payments. Utilities and government agencies continue their migration from cash counters to direct-debit mandates, aided by Fawran QR codes placed on monthly bills. Entertainment and digital content remain niche in absolute value yet deliver high double-digit growth as streaming platforms and gaming publishers localize Arabic interfaces and bundle micro-transactions with telecom billing. Embedded-finance pilots such as QIB Marketplace let merchants embed point-of-sale financing into specialty verticals like home improvement, fragmenting traditional retail boundaries and enlarging addressable wallet share. Collectively, these shifts suggest that while retail keeps the largest slice of the Qatar payments market share today, hospitality’s surge will reshape product design, risk models, and partner alliances over the forecast horizon.

Geography Analysis
Doha and Al Rayyan together account for the bulk of transaction value, reflecting population density, high retail concentration, and corporate headquarters location. Contactless penetration in central Doha surpasses 98%, while secondary cities such as Al Khor and Al Wakrah trail by roughly ten percentage points as of late 2025. Government-led kiosk programs in remote municipalities aim to shrink this gap and are bundling Fawran QR codes for utility payments, ensuring that rural segments are not left out of the Qatar payments market expansion.
The FIFA 2022 stadium zones remain living labs for biometric and tokenized payments. Since mid-2025, merchants inside Lusail and Education City precincts report a wallet share five points higher than national averages, aided by lingering tourist traffic and promotional campaigns. Coastal free-trade zones around Hamad Port show rising business-to-business instant-payment adoption as logistics companies embed Fawran APIs into customs-clearance workflows, reinforcing corporate demand for real-time settlement.
Cross-border corridors influence geographic patterns. Proximity to Saudi Arabia funnels day-trip retail spending through the Abu Samra crossing, where customs agents now accept digital duty payments, a first in the Gulf region. Indian expatriates cluster in Old Doha and Al Wakrah, and UPI acceptance has already lifted merchant volumes by double digits in these districts since launch, indicating that interoperability initiatives can alter local payment topographies inside the Qatar payments market.
Competitive Landscape
The top five domestic banks hold about 70% of issuing and acquiring volume, suggesting moderate concentration. Yet strategic moves are shifting the balance. Qatar National Bank’s Mastercard Gateway Hosted Checkout positions the bank as a service aggregator, narrowing fintech head-starts without breaching data-control mandates. Telecom-backed wallets leverage subscriber databases for know-your-customer automation, challenging banks in small-ticket everyday spend where interchange economics are thin.
Network International, ACI Worldwide, and Fiserv compete to furnish white-label processing, but data-localization rules compel them to host infrastructure in-country, raising operational costs. Fragmented QR standards hinder winner-takes-all outcomes, while regulator duality between Qatar Central Bank and Qatar Financial Centre permits niche players to exploit lighter-touch free-zone oversight for cross-border services. Technology differentiation now hinges on embedded APIs, biometric authentication, and AI-driven fraud mitigation, creating a chessboard where incumbents must innovate or concede share in the Qatar payments market.
Mergers remain scarce, yet partnerships proliferate. Visa Installment Solution, Corporate Virtual Cards, SWIFT gpi trackers, and SIM-swap fraud APIs all signal that incumbents prefer alliances over acquisitions to plug capability gaps rapidly. The December 2024 digital-bank rulebook foreshadows future greenfield entrants, but capital thresholds and governance checks ensure only deep-pocketed challengers can clear the bar.
Qatar Payments Industry Leaders
Qatar National Bank
Doha Bank
CashU
Commercial Bank of Qatar
PayPal Holdings, Inc.
- *Disclaimer: Major Players sorted in no particular order

Recent Industry Developments
- February 2026: ACI Worldwide released an e-commerce connector overview showing PayPal as the only wallet connector widely available to Qatari web merchants.
- December 2025: Ooredoo Qatar and Vodafone Qatar jointly launched GSMA Open Gateway APIs, offering Number Verification and SIM-swap detection for payment apps.
- September 2025: Qatar National Bank partnered with National Payments Corporation of India to bring UPI acceptance to Qatari merchants nationwide.
- August 2025: Qatar National Bank deployed Mastercard Gateway Hosted Checkout to auto-enable multiple wallets for merchants within hours.


Qatar Payments Market Report Scope
The Qatar Payments Market Report is Segmented by Mode of Payment (Point of Sale - Card Payments including Debit Cards, Credit Cards, Bank Financing Prepaid Cards, Digital Wallets including Mobile Wallet, Other Point of Sale; Online Sale - Card Payments including Debit Cards, Credit Cards, Bank Financing Prepaid Cards, Digital Wallets, Other Online Sales including Cash on Delivery, Bank Transfer, Buy Now Pay Later), Interaction Channel (Point-of-Sale, E-commerce and M-commerce), Transaction Type (Person-to-Person, Consumer-to-Business, Business-to-Business, Remittances and Cross-border), and End-user Industry (Retail, Entertainment and Digital Content, Healthcare, Hospitality and Travel, Government and Utilities, Other End-user Industries). The Market Forecasts are Provided in Terms of Value in USD.
By Mode of Payment
| By Point of Sale | Card Payments | Debit Cards |
| Credit Cards | ||
| Bank Financing Prepaid Cards | ||
| Digital Wallets (includes Mobile Wallet) | ||
| Other Point of Sale | ||
| By Online Sale | Card Payments | Debit Cards |
| Credit Cards | ||
| Bank Financing Prepaid Cards | ||
| Digital Wallets | ||
| Other Online Sales (includes Cash on Delivery, Bank Transfer, and Buy Now Pay Later) |
By End-user Industry
| Retail |
| Entertainment and Digital Content |
| Healthcare |
| Hospitality and Travel |
| Government and Utilities |
| Other End-user Industries |
| By Mode of Payment | By Point of Sale | Card Payments | Debit Cards |
| Credit Cards | |||
| Bank Financing Prepaid Cards | |||
| Digital Wallets (includes Mobile Wallet) | |||
| Other Point of Sale | |||
| By Online Sale | Card Payments | Debit Cards | |
| Credit Cards | |||
| Bank Financing Prepaid Cards | |||
| Digital Wallets | |||
| Other Online Sales (includes Cash on Delivery, Bank Transfer, and Buy Now Pay Later) | |||
| By End-user Industry | Retail | ||
| Entertainment and Digital Content | |||
| Healthcare | |||
| Hospitality and Travel | |||
| Government and Utilities | |||
| Other End-user Industries | |||


Key Questions Answered in the Report
What is the 2026 value of the Qatar payments market?
The Qatar payments market is expected to reach USD 7.95 billion in 2026.
How fast will digital wallets grow in Qatar by 2028?
Wallet transactions are projected to reach QAR 65 billion, or USD 17.8 billion, by 2028, reflecting 26% annual growth rates.
Which segment shows the highest growth through 2031?
Hospitality and travel payments are forecast to expand at a 12.24% CAGR, the fastest among end-user industries.
What share did point-of-sale payments hold in 2025?
Point-of-sale transactions accounted for 51.89% of total payment value in 2025.
Why is Fawran significant for corporate payments?
Fawran provides 24-hour instant account-to-account settlement, enabling real-time supplier and payroll disbursements for businesses.
Page last updated on:


