Qatar Freight And Logistics Market Size and Share
Market Overview
| Study Period | 2020 - 2031 |
|---|---|
| Forecast Data Period | 2026 - 2031 |
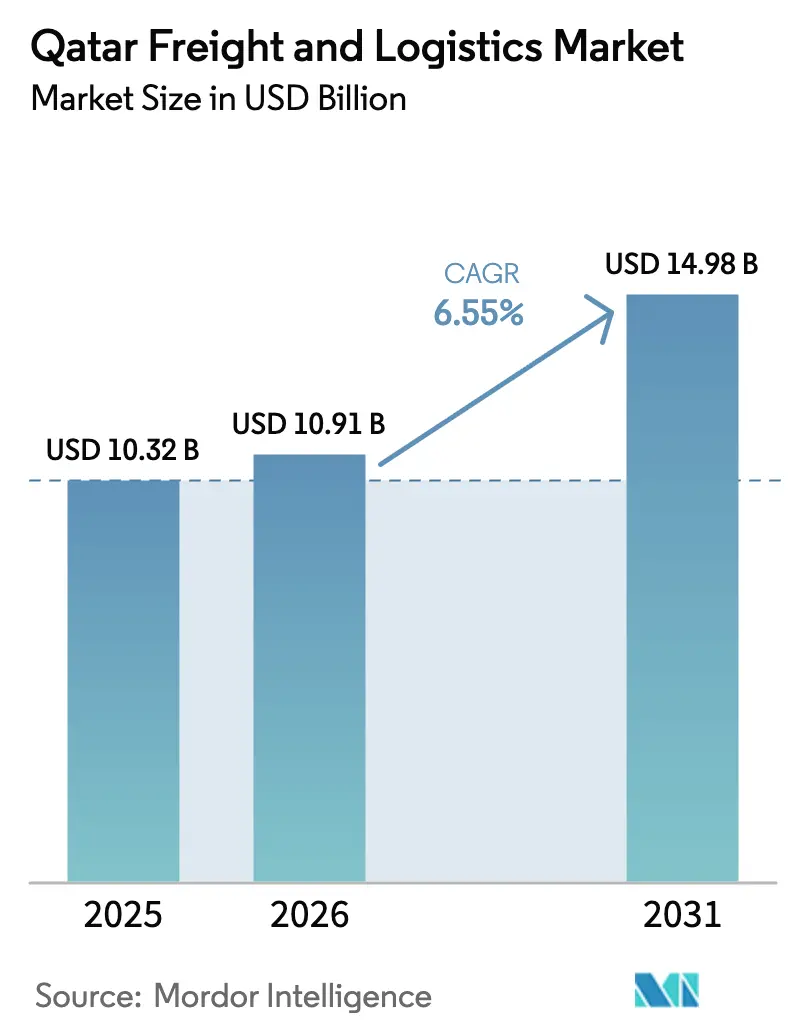
| Base Year Market Size (2025) | USD 10.32 Billion |
| Market Size (2026) | USD 10.91 Billion |
| Market Size (2031) | USD 14.98 Billion |
| Growth Rate (2026 - 2031) | 6.55% CAGR |
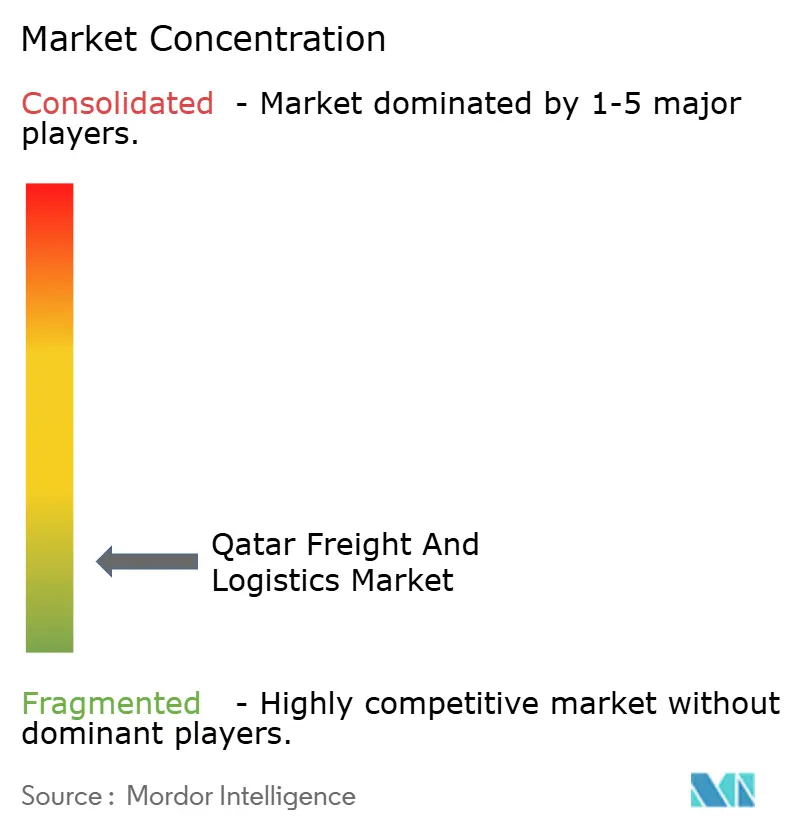
| Market Concentration | Low |
Major Players *Disclaimer: Major Players sorted in no particular order Image © Mordor Intelligence. Reuse requires attribution under CC BY 4.0. | |
Qatar Freight And Logistics Market Analysis by Mordor Intelligence
The Qatar Freight And Logistics Market size is expected to grow from USD 10.32 billion in 2025 to USD 10.91 billion in 2026 and is forecast to reach USD 14.98 billion by 2031 at 6.55% CAGR over 2026-2031.
Momentum in the Qatar freight and logistics market is reinforced by Hamad Port’s jump to first in the region and eleventh globally in the 2024 Container Port Performance Index, a signal that modernization efforts are translating into measurable throughput and reliability gains. Early 2026 disruptions to regional airspace did not derail the sector’s direction, as January throughput data confirmed that ports handled higher container and bulk volumes year over year, underscoring the system’s resilience. The Ministry of Transport’s 2025-2030 “Exceeding the Scope” strategy outlines 125 projects with a target of 40% private-sector participation to build integrated, flexible, and sustainable transport systems, which anchor long-term capacity and service upgrades for the Qatar freight and logistics market. Network optimization by Qatar Airways Cargo, including product specialization and a sharp rise in e-bookings, is lifting yields and supporting time-definite service standards that benefit high-value verticals across the Qatar freight and logistics market. Sustainability actions such as large-scale solar deployments in logistics parks and free-zone incentives for advanced manufacturing further improve unit economics and draw investment into the Qatar freight and logistics market.
Key Report Takeaways
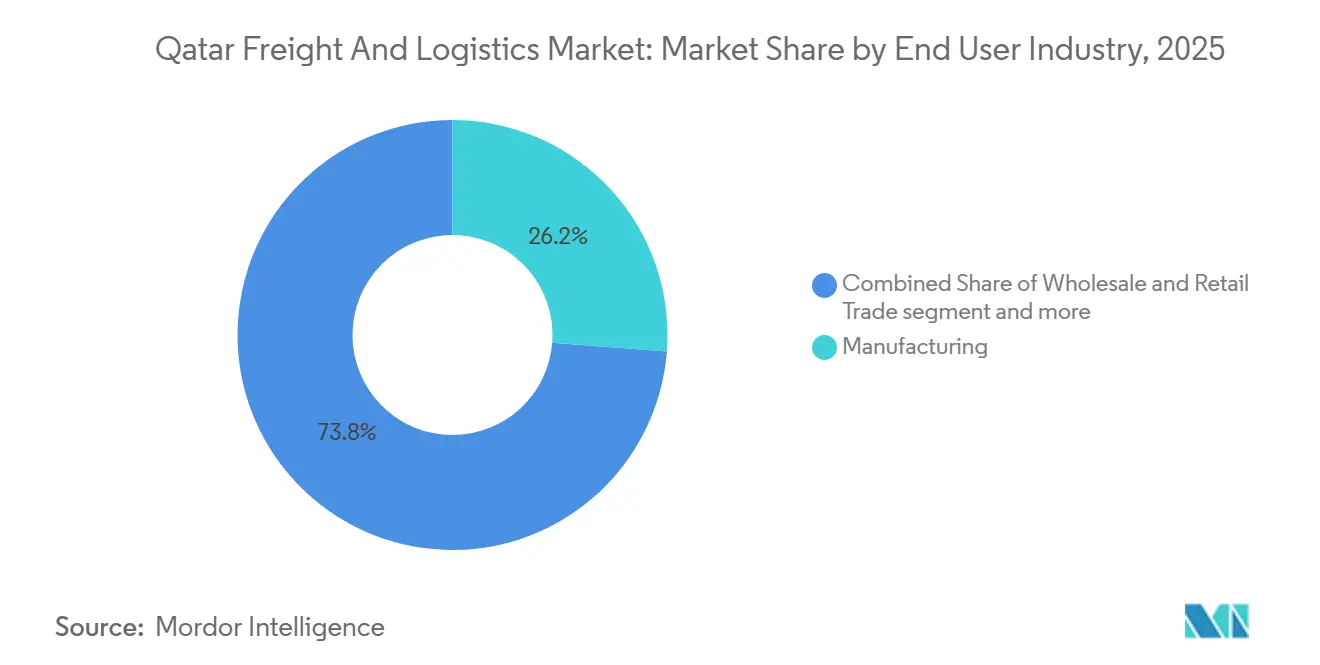
- By end user industry, manufacturing dominated the Qatar freight and logistics market share with a 26.23% in 2025, while wholesale and retail trade is projected to expand at a 7.34% CAGR through 2026-2031.
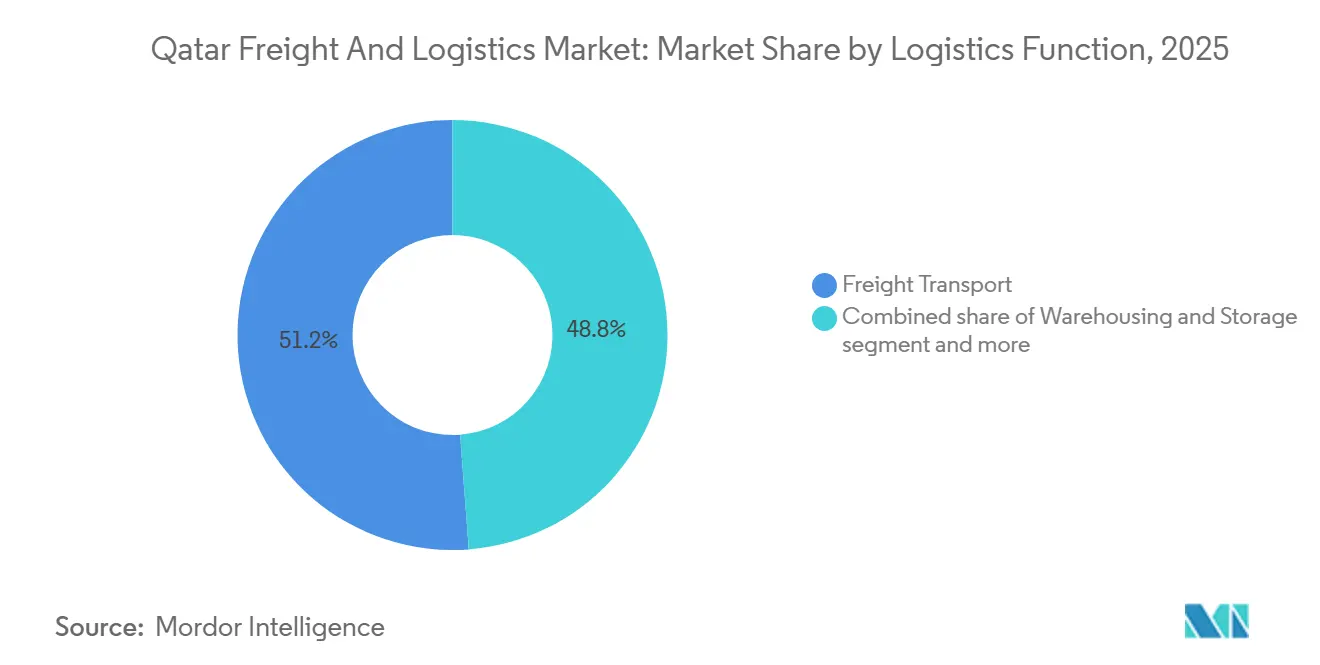
- By logistics function, freight transport held 51.21% of Qatar freight and logistics market size in 2025, while courier, express, and parcel services are projected to grow at a 7.42% CAGR through 2026-2031.
- Qatar's hub-and-spoke logistics model, anchored by Hamad Port's strategic depth and air cargo connectivity, creates a defensible transshipment advantage for time-sensitive, high-value trade flows across emerging markets.
- Regulatory agility and digital infrastructure are compressing clearance cycles and lowering entry barriers, shifting Qatar's logistics value proposition from cost-based to speed-and-reliability-driven competitiveness.
Note: Market size and forecast figures in this report are generated using Mordor Intelligence’s proprietary estimation framework, updated with the latest available data and insights as of 2026.
Qatar Freight And Logistics Market Trends and Insights
Drivers Impact Analysis*
| Driver | (~) % Impact on CAGR Forecast | Geographic Relevance | Impact Timeline |
|---|---|---|---|
| Strategic Geographic Positioning as GCC Transshipment Hub | +1.2% | Global, spill-over to Upper Gulf markets (Iraq, Kuwait, Bahrain) | Medium term (2-4 years) |
| Rising Cold Chain Investments for Food Security and Self-Sufficiency Goals | +0.9% | National, with early gains in Doha, Al Rayyan, Mesaieed industrial clusters | Long term (≥ 4 years) |
| Automation and Robotics Deployment in Warehousing Facilities | +0.8% | Doha metro area, Ras Bufontas Free Zone, logistics parks | Short term (≤ 2 years) |
| Growth of Air Cargo Volumes Through Qatar Airways Cargo Expansion | +1.1% | Global network (60+ freighter destinations), with Asia-Europe lanes prioritized | Medium term (2-4 years) |
| Development of Integrated Industrial Cities and Logistics Parks | +0.7% | Umm Alhoul, Ras Bufontas, Mesaieed, Ras Laffan | Long term (≥ 4 years) |
| Green Logistics Initiatives and Solar-Powered Warehouse Adoption | +0.5% | Nationwide free zones, initially Bu Sulba, Logistics Village Qatar, Al Wukair | Medium term (2-4 years) |
| Source: Mordor Intelligence | |||


Strategic Geographic Positioning as GCC Transshipment Hub
East-West Pivot Accelerates Cargo Rerouting Hamad Port’s improved performance and rankings in the 2024 Container Port Performance Index underscore a reliability premium that is attracting transshipment volumes into Doha’s network. In January 2026, Qatar’s ports processed higher container volumes and a sharp increase in bulk cargo compared with the prior year, confirming that diversions linked to geopolitical disruptions are strengthening hub positioning rather than softening it. Transshipment now accounts for a much larger share of container handling, with late-2025 updates indicating that Hamad Port is functioning as a redistribution platform rather than a pure gateway, which supports network optionality for carriers on Asia-Europe lanes. The launch of a Qatar-Bahrain passenger ferry link in November 2025, with plans to add car and potentially container services, opens a short-sea path that reduces friction at land borders and complements overland connectivity. Together, these factors raise the ceiling for the Qatar freight and logistics market as carriers and forwarders exploit a dependable Gulf pivot to maintain schedule integrity and service reliability in volatile conditions.
Rising Cold Chain Investments for Food Security Goals
Dual Mandate Shapes Capex Policy. Efforts to diversify import sources under the National Food Security Strategy are driving demand for multi-temperature storage, distribution, and handling in food and pharma chains. Solar-powered logistics parks in Logistics Village Qatar, Bu Sulba, and Al Wukair aim to generate 50,000 MWh of clean energy annually, reducing grid consumption. Specialized air cargo products, including temperature-controlled solutions, are expanding cold chain capabilities into high-value verticals. Free-zone manufacturing in Umm Alhoul is integrating chilled and frozen logistics with industrial production and packaging.[1]Ministry of Transport, “Prime Minister Launches Ministry of Transport Strategy 2025-2030,” Ministry of Transport, mot.gov.qa These developments are enhancing temperature-controlled capacity and service quality in the Qatar freight and logistics market to meet growing demand from retailers, healthcare providers, and electronics suppliers.
Automation and Robotics Deployment in Warehousing
ROBOTECH 26 Signals Sector Maturity Qatar’s decision to host the first ROBOTECH exhibition in October 2026, focused on AI-powered logistics and automation systems, indicates that digital competitiveness has become an operational priority for logistics stakeholders.[2]Ministry of Transport, “Prime Minister Launches Ministry of Transport Strategy 2025-2030,” Ministry of Transport, mot.gov.qa Logistics operators are moving past pilots to enterprise-scale deployments, with use cases spanning automated storage and retrieval, intelligent routing, and voice-assisted workflows that compress cycle times and reduce picking errors. Partnerships that embed AI-driven planning and cross-border orchestration are now visible in the corporate strategies of national champions as they connect Doha with Asian hubs to improve predictability and documentation cycles in time-definite flows. These investments raise the bar for service performance, which benefits customers requiring precise delivery windows and traceability, and they help the Qatar freight and logistics market monetize value-added services beyond basic transport and storage. As automation spreads from warehouses to last-mile dispatch, early adopters are positioned to capture share through higher throughput and consistent service quality in an increasingly competitive landscape.
Growth of Air Cargo Volumes Through Qatar Airways Cargo Expansion
Growth in air cargo throughput is strengthening Qatar’s position within the regional freight and logistics ecosystem, supported by expanding capacity and network connectivity through Hamad International Airport. Qatar Airways Cargo’s network expansion and increasing adoption of digital booking platforms are improving shipment visibility and reducing processing times for freight forwarders and logistics operators. These developments enhance Doha’s role as a transshipment hub connecting Asia, Europe, and Africa, particularly for time-sensitive cargo such as pharmaceuticals, electronics, and perishables. Collaborative initiatives with international airline partners are expected to broaden route coverage and improve transit efficiency, enabling logistics providers in Qatar to offer faster and more reliable cross-border freight services.
Restraints Impact Analysis*
| Restraint | (~) % Impact on CAGR Forecast | Geographic Relevance | Impact Timeline |
|---|---|---|---|
| Acute Shortage of Skilled Logistics and Supply Chain Professionals | -0.7% | National workforce development bottleneck, acute in Doha metro and industrial zones | Short term (≤ 2 years) |
| Extreme Summer Temperatures Are Increasing Operational and Maintenance Costs | -0.4% | Nationwide, particularly Mesaieed and Ras Laffan outdoor facilities | Long term (≥ 4 years) |
| Limited Domestic Manufacturing Base, Reducing Inbound Freight Volumes | -0.6% | National economic structure, mitigated by re-export flows | Long term (≥ 4 years) |
| Intense Regional Competition from the UAE And Saudi Mega-Logistics Hubs | -0.8% | GCC-wide competition, with pressure on Doha's transshipment pricing power | Medium term (2-4 years) |
| Source: Mordor Intelligence | |||
Acute Shortage of Skilled Logistics and Supply Chain Professionals
Demographic Dependency Creates Wage Pressure. Logistics leaders are reporting persistent hiring and upskilling challenges in warehousing, freight forwarding, and compliance functions, which slow the pace of process digitization and automation at some facilities. In response, incumbents are investing in formal training and national development programs to build competencies in hazardous goods handling, maritime operations, and technology-enabled workflows. The emphasis on structured pipelines suggests a multi-year horizon before supply meets demand, implying near-term wage pressure for technical roles and tighter service capacity in niche segments. Execution risk is highest in specialized services that require certifications and audit readiness, where operator credibility rests on maintaining qualified teams. These dynamic places a premium on workforce planning and retention strategies across the Qatar freight and logistics market.
Extreme Summer Temperatures Increasing Operational and Maintenance Costs
Climate Exposure Raises Opex High ambient temperatures and humidity levels raise energy loads for chilled storage and place stress on equipment and vehicles, elevating maintenance and replacement cycles for operators with outdoor fleets and facilities. Solar adoption across large logistics campuses is one of the most direct mitigants, providing predictable daytime power for cooling and material handling needs that would otherwise draw entirely from the grid. The shift toward electric fleets for last-mile distribution aligns with national goals and can reduce heat-related maintenance requirements compared with internal-combustion engines in stop-start urban duty cycles. Operators that modernize cooling assets and adopt energy-efficient infrastructure can moderate long-term opex trajectories and improve service resilience during peak summer periods. These measures help sustain service quality and asset uptime in the Qatar freight and logistics market under harsher climatic conditions.
*Our forecasts treat driver/restraint impacts as directional, not additive. The impact forecasts reflect baseline growth, mix effects, and variable interactions.
Segment Analysis
By End User Industry: Manufacturing Holds Share, Retail Trade Accelerates Fastest
Manufacturing accounted for 26.23% of the Qatar freight and logistics market share in 2025, reflecting rising factory counts and higher sector output tied to diversification priorities. Sector updates show that industrial output rose in 2025 as domestic product sales surged, which reinforced steady demand for inbound inputs and outbound distribution. Construction and energy projects added project cargo and heavy-lift requirements that flow through specialized hubs, broadening the service mix for contractors and EPCs. This steady base gives the Qatar freight and logistics market reliable freight volumes in oversized equipment and industrial commodities that are less correlated with discretionary consumption. Healthcare and education-related demand added further diversity in 2025 and 2026 through medical-equipment transport and document courier services, sustaining growth in specialized handling and secure flows.
Wholesale and retail trade is projected to expand at a 7.34% CAGR through 2031 as luxury brands, grocers, and electronics retailers scale omnichannel and same-day fulfillment models tailored to Qatar’s dense urban core. The growth of e-commerce, food delivery, and convenience-led consumption in 2025 and 2026 pushed operators to add capacity for sub-two-hour delivery windows and multi-temperature last-mile handling. These demands are accelerating investment in grade-A warehousing with real-time monitoring, where tenants place a premium on throughput and data visibility. As retailers connect physical stores with digital channels, the Qatar freight and logistics industry is supplying inventory pooling, returns processing, and value-added services that compress lead times and stabilize stock availability. These dynamic supports higher utilization of urban fulfillment nodes and deepens long-term contracts in consumer-facing verticals within the Qatar freight and logistics market.


By Logistics Function: Freight Transport Dominates, CEP Surges on E-Commerce Wave
Freight transport commanded 51.21% share of the Qatar freight and logistics market size in 2025, anchored by steady sea-borne imports, energy-related bulk flows, and project cargo that connect Hamad Port with national industrial zones. Sea and inland waterways accounted for 38.70% of freight transport revenue in 2025, with air transport projected to expand as network additions and specialized enclosures scale up time-sensitive services. System reliability improved in early 2026 as ports posted higher container and bulk volumes, building confidence in routing decisions amid global disruptions. This stability encourages shippers to use Doha for transshipment and redistribution, supporting the Qatar freight and logistics market’s regional role.
Courier, express, and parcel services are projected to grow at 7.42% CAGR through 2031, fueled by cross-border e-commerce and dense urban demand for rapid delivery. Domestic CEP accounted for 63.80% of segment revenue in 2025, while international flows are set to expand on the back of free-zone facilitations and airline-integrator tie-ups. In warehousing and storage, non-temperature-controlled facilities contributed the bulk of 2025 revenue, while temperature-controlled space is on a faster growth path due to pharma and perishables. As value-added services like kitting and returns processing grow, the Qatar freight and logistics industry is capturing higher-margin activities that improve client retention and network defensibility within the Qatar freight and logistics market.
Geography Analysis
Doha anchors the Qatar freight and logistics market due to the co-location of Hamad International Airport and Hamad Port, with airport statistics in 2024 showing strong passenger and cargo activity that supports feeder and bellyhold capacity for shippers. Early 2026 throughput highlighted that container and bulk volumes continued to rise, which helps maintain routing reliability and on-dock productivity for importers and re-exporters. As transshipment gained momentum through late 2025, port operations evolved toward a regional redistribution role, bolstering service options for Asia-Europe flows and reinforcing Doha’s primacy in the Qatar freight and logistics market.
Northern and energy-centric zones are adding complementary nodes that extend reach beyond the capital. A new logistics hub at Ras Laffan opened in February 2025 to support oil and gas projects, with air-conditioned storage, overhead cranes, and extensive laydown yards designed for heavy-duty operations. In the south, Umm Alhoul Free Zone’s deep-water access and manufacturing orientation create a production-to-export corridor that links industrial tenants with port and airport infrastructure under a single regulatory umbrella. The combination of specialized industrial cities and integrated free-zone logistics strengthens origin and destination flows that complement transshipment and improve network depth for the Qatar freight and logistics market.
Regionally, Qatar performs well on business fundamentals and digital readiness measures relative to its overall scale, which helps attract international operators to use Doha as a Gulf base despite intense competition from larger neighbors. The Qatar-Bahrain ferry link, launched in November 2025, adds an alternative to land routes and may support future short-sea cargo, improving redundancy and time savings for select intra-GCC movements. Trade facilitation measures and free-zone frameworks aim to standardize and simplify cross-border trade, which is vital for cross-dock models and CEP flows that depend on frictionless customs interfaces. These developments support a geography where the capital remains the primary hub while energy, manufacturing, and free-zone sites create a distributed network that underpins growth in the Qatar freight and logistics market.
Competitive Landscape
The Qatar freight and logistics market shows low concentration, led by integrated domestic champions and global players with extensive networks. A leading national operator reported QR 1.38 billion in 2025 revenue, supported by large-scale logistics, real estate, and partnerships that extend into e-commerce and last-mile optimization, highlighting the value of asset depth and technology alliances. [3]Gulf Warehousing Company, “GWC Reports QR 120 Million Net Profit in 2025,” GWC Logistics, gwclogistics.com Another national incumbent posted double-digit profit growth on the strength of offshore marine services and strategic partnerships connecting Doha with East Asian logistics ecosystems, confirming that multi-business portfolios add resilience. Global integrators are anchoring free-zone operations to tap airside and portside connectivity, reflecting confidence in Qatar as a cross-border distribution base.
Air cargo leadership is reinforced by fleet modernization plans, specialized product lines, and partnerships that pool networks to expand routing options and streamline transits for shippers. The airline’s shift to e-bookings and productized solutions like TechLift and Aerospace enables targeted vertical strategies and steadier yield management during capacity shifts. A new live-animal center at Hamad International Airport further demonstrates capability building in niche categories where strict standards create barriers to entry for cost-focused competitors. Together, these moves strengthen the Qatar freight and logistics market by anchoring premium services that attract high-value shippers.
Sustainability is emerging as a competitive dimension, as large solar deployments, circular initiatives, and public commitments on emissions reduction become selection criteria in RFPs, particularly for multinational brands under Scope 3 reporting. Free-zone expansions by local and international firms signal intensifying rivalry, yet they also increase ecosystem density, which supports collaboration on shared infrastructure and accelerates service innovation. In this context, the Qatar freight and logistics market rewards operators that blend asset scale, digital tools, and ESG credentials with sector-specific know-how in time-sensitive and compliance-heavy categories.
Qatar Freight And Logistics Industry Leaders
A.P. Moller-Maersk
Aero Group of Companies
Agility Logistics
Ali Bin Ali Holding
Aramex
- *Disclaimer: Major Players sorted in no particular order

Recent Industry Developments
- April 2025: Qatar Airways Cargo, IAG Cargo, and MAB Kargo Sdn Bhd plan a Global Cargo Joint Business to enhance connectivity and transit times. Each carrier will provide 1,000 tonnes of free humanitarian aid. Qatar Airways Cargo operates 28 Boeing 777 freighters and expects the first Boeing 777-8F delivery in 2027.
- March 2025: Qatar Airways Cargo opened a 5,260-square-meter live-animal center at Hamad International Airport, processing up to 55,000 animals annually. The facility includes kennels, stables, and 24/7 veterinary staff, supporting niche markets like endangered species, equine logistics, and exotic animal relocations.
- February 2025: Gulf Warehousing Company (GWC) launched a logistics hub in Ras Laffan Industrial City, Qatar, to support the oil and gas sector and QatarEnergy's North Field Expansion Project. The facility includes a warehouse, racked storage, workshops, and a laydown yard.
- May 2024: Qatar Free Zones Authority (QFZ) and China's Luyi Holding Group partnered to build a 282,000-square-meter industrial park in Umm Alhoul Free Zone, focusing on plastics, metals, and solar panels, with benefits like 100% foreign ownership and 0% corporate tax.


Qatar Freight And Logistics Market Report Scope
The Qatar Freight and Logistics Market Report is Segmented by End User Industry (Agriculture, Fishing, and Forestry, Construction, Manufacturing, Oil and Gas, Mining and Quarrying, Wholesale and Retail Trade, and Others), by Logistics Function (Courier, Express and Parcel (CEP), Freight Forwarding, Freight Transport, Warehousing and Storage, and Other Services). The Market Forecasts are Provided in Terms of Value (USD).
| Agriculture, Fishing, and Forestry |
| Construction |
| Manufacturing |
| Oil and Gas, Mining and Quarrying |
| Wholesale and Retail Trade |
| Others |
| Courier, Express, and Parcel (CEP) | Domestic |
| International | |
| Freight Forwarding | |
| Freight Transport | Air |
| Pipelines | |
| Rail | |
| Road | |
| Sea and Inland Waterways | |
| Warehousing and Storage | Non-Temperature Controlled |
| Temperature Controlled | |
| Other Services |
| End User Industry | Agriculture, Fishing, and Forestry | |
| Construction | ||
| Manufacturing | ||
| Oil and Gas, Mining and Quarrying | ||
| Wholesale and Retail Trade | ||
| Others | ||
| Logistics Function | Courier, Express, and Parcel (CEP) | Domestic |
| International | ||
| Freight Forwarding | ||
| Freight Transport | Air | |
| Pipelines | ||
| Rail | ||
| Road | ||
| Sea and Inland Waterways | ||
| Warehousing and Storage | Non-Temperature Controlled | |
| Temperature Controlled | ||
| Other Services | ||


Market Definition
- Agriculture, Fishing, and Forestry (AFF) - This end user industry segment captures the external (outsourced) logistics expenditure incurred by the AFF industry players. The end user players considered are the establishments primarily engaged in growing crops, raising animals, harvesting timber, harvesting fish & other animals from their natural habitats and providing related support activities. Herein, Logistics Service Providers (LSPs) play a crucial role in acquisition, storage, handling, transportation, and distribution activities for the optimal & continuous flow of inputs (seeds, pesticides, fertilizers, equipment, and water) from manufacturers or suppliers to the producers and smooth flow of output (produce, agro-goods) to distributors/ consumers. This includes both termperature controlled and non-temperature controlled logistics, as and when required according to the shelf life of goods being transported or stored.
- Construction - This end user industry segment captures the external (outsourced) logistics expenditure incurred by the construction industry players. The end user players considered are the establishments primarily engaged in constructing, repairing and renovating residential & commercial buildings, infrastructure, engineering works, subdividing and developing land. Logistics Service Providers (LSPs) play a crucial role in increasing profitability of construction projects by maintaing the inventory of raw materials & equipment, time-critical supplies and by providing other value added services for effective project management.
- Courier, Express, and Parcel - The Courier, Express, and Parcel services, often called as CEP Market, refers to the logistics and postal service providers which specialize in moving small goods (parcels/packages). It captures the overall market size (USD) and market volume (number of parcels) of (1) the shipments/parcels/packages which are under 70kgs/ 154lbs weight, (2) Business Customer packages viz. Business-to-Business (B2B) & Business-to-Consumer (B2C) as well as private customer packages (C2C), (3) non-express parcel delivery services (Standard and Deferred) as well as express parcel delivery services (Day-Definite-Express and Time-Definite-Express), (4) domestic as well as international parcels.
- Demographics - To analyse total addressable market demand, population growth & forecasts have been studied and presented in this industry trend. It represents population distribution across categories like gender (male/female), development area (urban/rural), major cities among other key parameters like population density and final consumption expenditure (growth and share % of GDP). This data has been used for assessing the fluctations in demand & consumption expenditure, and the major hotspots (cities) of potential demand.
- Export Trends and Import Trends - Overall logistics performance of an economy is positively and significantly (statistically) correlated to its trade performance (exports and imports). Hence, in this industry trend, total value of trade, major commodities/ commodity groups and the major trade partners, for the studied geography (country or region as per the scope of report) have been analysed alongside the impact of major trade/logistics infrastructure investments & regulatory environment.
- Freight Forwarding - Freight forwarding which herein refers to the freight transportation arrangement (FTA) industry includes establishments primarily engaged in arranging & tracking transportation of freight between shippers and carriers. Logistics Service Providers (LSPs) considered are freight forwarders, NVOCCs, custom brokers and marine shipping agents. Others segment under Freight Forwarding captures the revenue earned through value added services of FTA like custom brokerage/clearance activities, preparation of freight related documentation, consolidation-deconsolidation of goods, cargo insurance & compliance, arrangement of warehousing & storage, liasing with shippers, and freight forwarding through other modes of transport viz. road and rail.
- Freight Pricing Trends - Freight pricing by mode of transport (USD/tonkm), over the review period, has been presented in this industry trend. The data has been used in assessing the inflationary environment, impact on trade, freight turnover (tonkm), freight and logistics market demand by mode of transport segments and hence the overall freight and logistics market size.
- Freight Tonnage Trends - Freight tonnage (weight of goods in tons) handled by mode of transport, over the review period, has been presented in this industry trend. The data has been used as one of the parameters apart from average distance per shipment (km), freight volume (tonkm), and freight pricing (USD/tonkm) to assess the freight transport market size.
- Freight Transport - Freight Transport refers to the hiring of a logistics service provider (outsourced logistics) for the transport of commodities (raw materials/final/intermediate/finished goods including both solids and fluids) from the origin to a destination within the country (domestic) or cross-border (international).
- Freight and Logistics - External expenditure on (or outsourced) facilitation of freight transport (freight transportation), arrangement of freight transport through an agent (freight forwarding), warehousing and storage (temperature controlled or non-temperature controlled), CEP (domestic or international courier, express and parcel) and other value-added logistics services involved in the transportation of commodities (raw materials or finished goods including both solids and fluids) from the origin to a destination within the country (domestic) or cross-border (international), through one or more modes of transportation viz. road, rail, sea, air and pipelines constitute freight and logistics market.
- Fuel Price - Fuel price spikes can cause delays and diruption for logistics service providers (LSPs), while drops in the same can result in higher short-term profitability and increased market rivalry to offer consumers with the best deals. Hence, the fuel price variations have been studied over the review period and presented along with the causes as well as market impacts.
- GDP Distribution by Economic Activity - Nominal Gross Domestic Product and distribution of the same, across major economic sectors in the geography studied (country or region as per scope of the report) have been studied and presented in this industry trend. As GDP is positively related to the profitability and growth of logistics industry, this data has been used in adjunction to the input-output tables/ supply-use tables for analyzing the potential major contributing sectors towards the logistics demand.
- GDP Growth by Economic Activity - Growth of Nominal Gross Domestic Product across major economic sectors, for the geography studied (country or region as per scope of the report) have been presented in this industry trend. This data has been utilized for assessing the growth of logistics demand from all the market end users (economic sectors considered here).
- Inflation - Variations in both Wholesale Price Inflation (YoY change in producer price index) and Consumer Price Inflation have been presented in this industry trend. This data has been used to assess the inflationary environment as it plays a vital role in smooth functioning of the supply chain, directly impacting the logistics operational cost components e.g., pricing of tyres, driver wages & benefits, energy/fuel prices, maintenace costs, toll charges, warehousing rents, custom brokerage, forwarding rates, courier rates etc. hence impacting the overall freight and logistics market.
- Infrastructure - As infrastructure plays a vital role in an economy's logistics performance, variables like length of roads, distribution of road length by surface category (paved v/s unpaved), distribution of road length by road classification (expressways v/s highways v/s other roads), rail length, volume of containers handled by major ports and tonnage handled by major airports have been analysed and presented in this industry trend.
- Key Industry Trends - The report section named "Key Industry Trends" include all the key variables/parameters studied to better analyze the market size estimates and forecasts. All the trends have been presented in the form of data points (time series or latest available data points) along with analysis of the paramter in the form of concise market relevant commentary, for the geography studied (country or region as per the scope of report).
- Key Strategic Moves - The action taken by a company to differentiate from its competitor or used as a general strategy is referred to as a key strategic move (KSM). This includes (1) Agreements (2) Expansions (3) Financial Restructuring (4) Mergers and Acquisitions (5) Partnerships, and (6) Product Innovations. Key players (Logistics Service Providers, LSPs) in the market have been shortlisted, their KSM have been studied and presented in this section.
- Liner Shipping Bilateral Connectivity Index - It indicates a country pair's integration level into global liner shipping networks and plays a crucial role in determining bilateral trade, which in turn potentially contributes toward the prosperity of a country and its surrounding region. Hence the major economies connected to the country/ region as per scope of the report, have been analyzed and presented in "Liner Shipping Connectivity" industry trend.
- Liner Shipping Connectivity - This industry trend analyses the state of connectivity to the global shipping networks based on the status of maritime transport sector. It includes the analysis of liner shipping connectivity, bilateral shipping connectivity, and port liner shipping connectivity indices for the geography (country/ region as per scope of the report) over the review period.
- Liner Shipping Connectivity Index - It indicates how well countries are connected to global shipping networks based on the status of their maritime transport sector. It is based on five components of the maritime transport sector: (1) The number of shipping lines servicing a country, (2) The size of the largest vessel used on these services (in TEUs), (3) The number of services connecting a country to the other countries, (4) The total number of vessels deployed in a country, (5) The total capacity of those vessels (in TEUs).
- Logistics Performance - Logistics Performance and Logistics Costs are the backbone of trade, and influences trade costs, making countries compete globally. Logistics performance is influenced by market wide adopted supply chain management strategies, government services, investments & policies, fuel/ energy costs, inflationary environment etc. Hence, in this industry trend, the logistics performance of the geography studied (country/ region as per the scope of report) has been analysed and presented over the review period.
- Major Truck Suppliers - Market share of truck brands is influenced by factors like geographical preferences, portfolio of truck types, truck prices, local production, truck repair & maintenance service peneteration, customer support, technological innovations (like electric vehicles, digitalization, autonomous trucks), fuel efficiency, financing options, annual maintenance costs, availability of substitutes, marketing startegies etc. Hence, the distribution (share % for base year of the study) of truck sales volume for leading truck brands and commentary on current market scenario & market anticipation over the forecast period have been presented in this industry trend.
- Manufacturing - This end user industry segment captures the external (outsourced) logistics expenditure incurred by the Manufacturing industry players. The end user players considered are the establishments primarily engaged in the chemical, mechanical or physical transformation of materials or substances into new products. Logistics Service Providers (LSPs) play a crucial role in maintaining a smooth flow of raw materials across the supply chain, enabling timely delivery of finished goods to distributors or end customers and storing & supplying the raw materials to clients for just-in-time manufacturing.
- Maritime Fleet Load Carrying Capacity - Maritime fleet load carrying capacity depicts the development state of an economy's maritime infrastructure & trade. It is influenced by factors like volume of production, international trade, major end user industries, maritime connectivity, environmental regulations, investments in port infrastructure development, port container cargo handling capacity etc. This industry trend represents the maritime fleet load carrying capacity by type of ship viz. container ships, oil tankers, bulk carriers, general cargo, among other types alongwith the influencing factors for the geography studied (country/ region as per scope of the report), over the review period.
- Modal Share - Freight Modal Share is influenced by factors like modal productivity, government regulations, containerization, distance of shipment, temperature control requirements, type of goods, international trade, terrain, speed of delivery, shipment weight, bulk shipments, etc. Also, modal share by tonnage (tons) and modal share by freight turnover (ton-km) differ as per average distance of shipments, weight of major commodity groups transported in the economy and number of trips. This industry trend represents the distribution of freight transported by mode of transport (tons as well as ton-km), for the study base year.
- Oil and Gas, Mining and Quarrying - This end user industry segment captures the external (outsourced) logistics expenditure incurred by the extraction industry players. The end user players considered are the establishments that extract naturally occurring mineral solids, such as coal and ores; liquid minerals, such as crude petroleum; and gases, such as natural gas. Logistics Service Providers (LSPs) covers entire phases from upstream to downstream and plays a crucial role in the transportation of machinery, drilling equipments, extracted minerals, crude oil & natural gas and refined/ processed products from one place to another.
- Other End Users - Other end user segment captures the external (outsourced) logistics expenditure incurred by the financial services (BFSI), real estate, educational services, healthcare, and professional services (administrative, waste management, legal, architectural, engineering, design, consulting, scientific R&D). Logistics Service Providers (LSPs) plays a crucial role in the reliable movement of supplies and documents to/from these industries such as transporting any equipment or resources required, shipping confidential documents and files, movement of medical goods & supplies (surgical supplies and instruments, including gloves, masks, syringes, equipment) to name a few.
- Other Services - Other Services segment captures revenue earned through (1) Value added services (VAS) for freight transportation by road, rail, air and sea & inland waterways, (2) VAS for marine cargo transportation (operation of terminal facilities such as harbours and piers, operation of waterway locks, navigation, pilotage and berthing activities, lighterage, salvage activities, lighthouse activities, among other miscellaneous support activities), (3) VAS for land freight transportation (operation of terminal facilities such as railway stations, stations for the handling of goods, operation of railroad infrastructure, switching and shunting, towing and road side assistance, liquefaction of gas for transportation purposes, among other miscellaneous support activities), (4) VAS for air cargo transportation (operation of terminal facilities such as airway terminals, airport and air-traffic-control activities, ground service activities on airfields, runway maintenance, inspection/ ferrying/ maintenance/ testing of aircrafts, aircraft fuelling services, among other miscellaneous support activities), (5) VAS for warehousing and storage service (operation of grain silos, general merchandise warehouses, refrigerated warehouses, storage tanks etc., storage of goods in foreign trade zones, blast freezing, crating goods for shipping, packing and preparing goods for shipping, labelling and/or imprinting the package, kit assembling and packaging services, among other miscellaneous support activities), and (6) VAS for courier, express and parcel service (pickup, sorting).
- Port Calls and Performance - The performance of ports is key to an economy's freight movement, trade, global connectivity, successful growth strategies, investment attractiveness for production & distribution systems, and thus affects GDP, employment, per capita income and industrial growth. Hence, the port perfomance parameters like median time spent by vessels in the ports; average age, size, cargo carrying capacity, container carrying capacity, of vessels entering the ports, port calls, and container port throughput have been analysed and presented in this industry trend.
- Port Liner Shipping Connectivity Index - It reflects a port's position in the global liner shipping network, wherein a higher value of index is associated with better connectivity. Efficient and well-connected ports (1) contribute towards minimizing transport costs, linking supply chains and supporting international trade, (2) pave the way for economies of scale and development of expertise by permitting producers to better exploit possibilities in domestic as well as foreign markets. Hence the major ports of strategic importance, in the country/ region as per scope of the report, have been analyzed and presented in "Liner Shipping Connectivity" industry trend.
- Port Throughput - It reflects the amount of cargo or number of vessels a port handles annually. It can be related to (1) cargo tonnage, (2) container TEU, and (3) vessel calls. Port throughput in terms of total containers handled (TEU's), has been presented in the "Port Calls and Performance" industry trend.
- Producer Price Inflation - It indicates inflation from viewpoint of the producers viz. the average selling price received for their output over a period of time. Annual change (YoY) of producer price index is reported as wholesale price inflation in the "Inflation" industry trend. As WPI captures dynamic price movements in most comprehensive way, it is widely used by governments, banks, industry, business circles and is deemed important in formulation of trade, fiscal and other economic policies. The data has been used in adjunction to consumer price inflation for better understanding the inflationary environment.
- Segmental Revenue - Segmental Revenue has been triangulated or computed and presented for all the major players in the market. It refers to the freight and logistics market specific revenue earned by the company, over the base year of study, in the geography studied (country or region as per the scope of report). It is computed through the study and analysis of major parameters like financials, service portfolio, employee strength, fleet size, investments, number of countries present in, major economies of concern, etc. that have been reported by the company in its annual reports, webpage. For companies having scarce financial disclosures, paid databases like D&B Hoovers, Dow Jones Factiva have been resorted to and verified through industry/expert interactions.
- Transport and Storage Sector GDP - Value and growth of Transport and Storage Sector GDP has a direct relation to the freight and logistics market size. Hence, this variable has been studied and presented over the review period, in value terms (USD) and as share % of total GDP, in this industry trend. The data has been supported by concise and relevant commentary around the investments, developments, and current market scenario.
- Trends in E-Commerce Industry - Enhanced internet connectivity and boom in smartphone penetration, coupled with increasing disposable incomes, has led to a phenomenal growth in the e-commerce market globally. Online shoppers require fast and efficient delivery of their orders leading to an increase in the demand for logistics services especially e-commerce fulfilment services. Hence, the Gross Merchandise Value (GMV), historial and projected growth, breakup of major commodity groups in e-commerce industry for the studied geography (country or region as per scope of the report) have been analysed and presented in this industry trend.
- Trends in Manufacturing Industry - Manufacturing industry involves the transformation of raw materials into finished products, while logistics industry ensures the efficient flow of raw materials to the factory, and the transport of manufactured products to the distributors & consumers. Demand-Supply of both industries are highly cross-linked and critical for a seamless supply chain. Hence, the Gross Value Added (GVA), breakup of GVA into major manufacturing sectors, and growth of manufacturing industry over the review period have been analysed and presented, in this industry trend.
- Trucking Fleet Size By Type - Market share of truck types is influenced by factors like geographical preferences, major end user industries, truck prices, local production, truck repair & maintenance service peneteration, customer support, technological disruptions (like electric vehicles, digitalization, autonomous trucks) etc. Hence, the distribution (share % for base year of study) of truck parc volume by type of truck, market disruptors, truck manufacturing investments, truck specifications, truck use & import regulations, and market anticipation over the forecast period have been presented in this industry trend.
- Trucking Operational Costs - The prime reasons for measuring/ benchmarking logistics performance of any trucking company are to reduce operational costs and increase profitability. On the other hand, measuring operational costs helps to identify whether and where to make operational changes to control expenses and identify areas for improved performance. Hence, in this industry trend, trucking operational costs and the variables involved viz. driver wages & benefits, fuel prices, repairs & maintenance costs, tyre costs etc. have been studied over the base year of study, and presented for the geography studied (country or region as per the scope of report).
- Warehousing and Storage - Warehousing and storage segment captures revenue earned through the operation of general merchandise, refrigerated and other types of warehousing & storage facilities. These establishments take responsibility for storing the goods and keeping them secure in lieu of charges. Value added services (VAS) they may provide are considered to be a part of the "other services" segment. Here VAS refer to a range of services, related to the distribution of a customer's goods and can include labelling, breaking bulk, inventory control & management, light assembly, order entry & fulfillment, packaging, pick & pack, price marking & ticketing and transportation arrangement.
- Wholesale and Retail Trade - This end user industry segment captures the external (outsourced) logistics expenditure incurred by the wholesalers and retailers. The end user players considered are the establishments primarily engaged in wholesaling or retailing merchandise, generally without transformation, and rendering services incidental to the sale of merchandise. Logistics Service Providers (LSPs) plays a crucial role in the reliable movement of supplies to and finished products from production houses to the distributors and finally to the end customer covering activites like material sourcing, transportation, order fulfillment, warehousing & storage, demand forecasting, inventory management etc.
| Keyword | Definition |
|---|---|
| Axle Load | The axle load of a wheeled vehicle is the total weight bearing on the roadway for all wheels connected to a given axle. |
| Back Haul | Backhaul is the return movement of a transport vehicle from its original destination to its original point of departure. |
| Bill of Lading | A bill of lading is a legal document issued by a carrier to a shipper that details the type, quantity, and destination of the goods being carried. |
| Bunkering | Bunkering is the process of supplying fuel and/or gasoil to be used to power the propulsion system of a ship (such fuel is referred to as bunker). It includes the logistics of loading and distributing the fuel among available shipboard tanks. A person dealing in trade of bunker (fuel) is called a bunker trader. |
| Bunkering Service | Bunkering service is the supply of a requested quality and quantity of bunkers to a ship. |
| C-commerce | C-commerce (Collaborative commerce) describes electronically enabled business interactions among an enterprise’s internal personnel, business partners and customers throughout a trading community. The trading community could be an industry, industry segment, supply chain or supply chain segment. |
| Cabotage | Transport by a vehicle registered in a country performed on the national territory of another country. |
| Cartage Agent | A ground transportation service that provides pickup and delivery of freight in locations not served directly by an air or ocean carrier. |
| Contract logistics | Contract logistics refers to the outsourcing of resource management tasks by one company to a third-party company specializing in logistical matters, such as transportation, warehousing, and order fulfillment. |
| Courier | A business that is used to send messages, packages, etc. Courier service refers to the fast or quick, door to door pickup and delivery service for goods or documents. It can be local or international. A company that provides such delivery services is called a courier company. A courier company hires people to provide their services. Such a person hired by the courier service company is called a courier. |
| Cross docking | Cross docking is a practice in logistics management that includes unloading incoming delivery vehicles and loading the materials directly into outbound delivery vehicles, omitting traditional warehouse logistical practices and saving time and money. |
| Cross Trade | International transport between two different countries performed by a vehicle registered in a third country. A third country is a country other than the country of loading/embarkation and than the country of unloading/disembarkation. |
| Customs Clearance | The procedures involved in getting cargo released by Customs through designated formalities such as presenting import license/permit, payment of import duties and other required documentations by the nature of the cargo such as FCC or FDA approval. |
| Customs seal | Customs seal means a seal, stamp or any other preventive means affixed by customs officials to ensure the inviolability of goods, commercial means of transport or warehouses. |
| Dangerous Goods | Dangerous goods (or hazardous materials or HAZMAT) include flammable liquids/solids, gases, compressed, liquified, dissolved under pressure, corrosives, oxidising substances, explosive substances and articles, substances, which on contact with water, emit flammable gasses, organic peroxides, toxic substances, infectious substances, radioactive materials, miscellaneous dangerous goods and articles. |
| Direct Shipment | Direct shipment is a method of delivering goods from the supplier or the product owner to the customer directly. In most cases, the customer orders the goods from the product owner. This delivery scheme reduces transportation and storage costs, but requires additional planning and administration. |
| Drayage | A drayage is a form of trucking service that connects the different modes of shipping (intermodal), such as ocean freight or air freight. It’s a short-haul trip that transports goods from one place to another, usually before or after its long-haul shipping process. Drayage trucks move cargo to and from various destinations, such as container ships, storage lots, order fulfillment warehouses, and rail yards. Typically, drayage only transports goods in short distances and operates only in one metropolitan area. It also requires only one trucker in a single shift. |
| Dry Docking | Dry docking is a term used for repairs or when a ship is taken to the service yard. During dry docking, the whole ship is brought to a dry land so that the submerged portions of the hull can be cleaned or inspected. |
| Dry van | A dry van is a type of semi-trailer that's fully enclosed to protect shipments from outside elements. Designed to carry palletized, boxed or loose freight, dry vans aren't temperature-controlled (unlike refrigerated “reefer” units) and can't carry oversized shipments (unlike flatbed trailers). |
| Feedering | Transport service whereby loaded or empty containers in a regional are transferred to a “mother ship” for a long-haul ocean voyage. |
| Final Demand | Final demand includes all types of commodities (goods as well as services) consumed as final use and might include personal consumption, or consumption by government, by businesses as capital investment, and as exports. includes all types of commodities (goods as well as services) consumed as final use and might include personal consumption, or consumption by government, by businesses as capital investment, and as exports. |
| First mile Delivery | First mile delivery refers to the first stage of the transportation. This is when the parcel leaves the seller’s warehouse and is taken by the courier pick up agent to process it or take it to the warehouse. Once the package reaches the post office or the courier’s hub, it is then sorted and transported further until it reaches the customer’s doorstep. |
| Fiscal storage services | It means a facility, clearly separated from other premises, where the excise goods are produced, processed, held, received or dispatched under a duty suspension arrangement by an authorized depositor, in the course of his business, under conditions laid down by the customs authorities. |
| Flat Bed | It has a back body that is flatly shaped for easy loading and unloading of goods. The flatbed truck is mostly used to transport heavy, oversized, wide and indelicate goods. |
| Flatbed Truck | A flatbed truck is a type of truck with rigid design. It has a back body that is flatly shaped for easy loading and unloading of goods. The flatbed truck is mostly used to transport heavy, oversized, wide and indelicate goods such as machinery, building supplies or equipment. Due to the truck open body, the goods transported with it must not be vulnerable to rain. By functionality, the flatbed truck is comparable to a flatbed trailer. |
| Freight Transit Time | Transit time is how long it takes for a shipment to be delivered to its final destination after being picked up from a designated pick up point. |
| Halal Logistics | It refers to the process of managing the logistics operations such as fleet management, storage/warehousing, and materials handling according to the principles of Shariah law in ensuring the integrity of the halal products at the point of consumption. |
| Haulage | The commercial transport of goods. |
| Inbound Logistics | Inbound logistics is the way materials and other goods are brought into a company. This process includes the steps to order, receive, store, transport and manage incoming supplies. Inbound logistics focuses on the supply part of the supply-demand equation. |
| Intermediate Demand | Intermediate demand includes goods, services, and maintenance and repair construction sold to businesses, excluding capital investment. |
| International Loaded | Place of loading of goods in reporting country (i.e., country in which the vehicle performing the transport is registered) and place of unloading in a different country. |
| International Unloaded | Place of unloading of goods in reporting country (i.e., country in which the vehicle performing the transport is registered) and place of loading in a different country. |
| Last Mile Delivery | Last mile delivery refers to the very last step of the delivery process when a parcel is moved from a transportation hub to its final destination—which, usually, is a personal residence or retail store. |
| Less than-Truck-Load (LTL) | Less-than-truckload, also known as less-than-load (LTL), is a shipping service for relatively small loads or quantities of freight. An LTL provider combines the loads and shipping requirements of several different companies on their trucks, using a hub-and-spoke system to get goods to their destinations. |
| Locomotives Haluage | The transport of coal, ore, workers, and materials underground by means of locomotive-hauled mine cars. The locomotive may be powered by battery, diesel, compressed air, trolley, or some combination such as battery-trolley or trolley-cable reel. |
| Milkrun | A Milk Run is a delivery method used to transport mixed loads from various suppliers to one customer. Instead of each supplier sending a truck every week to meet the needs of one customer, one truck (or vehicle) visits the suppliers to pick up the loads for that customer. This method of transport got its name from the dairy industry practice, where one tanker used to collect milk from several dairy farms for delivery to a milk processing company. |
| Multi country consolidation | Multi-Country Consolidation (MCC) is a cost-effective solution that consolidates ones cargo from different countries of origin to build Full Container Loads (FCL). MCC is most suitable for companies that import light volumes of goods from multiple countries but want to take advantage of the more economic FCL freight rates. |
| Multi-Modal Logistics | Multimodal transportation or multimodal shipping refers to logistics and freight processes that require multiple modes of transportation. |
| Omni Channel Logistics | Omnichannel distribution is a multichannel approach taken by companies to give customers a way to purchase and receive orders from several sales channels with one-touch seamless integration. Some of the ways include- 1. Buy online, then pick-up at the brick and mortar store; 2. Buy online, then have it delivered to the home or another location; 3.In store purchase, with the delivery either to the home or another location; 4. Drop ship from a warehouse or manufacturing center to store, home or other location; 5.Buy online, then return at store or online; 6. Buy online, then return online. |
| OOG cargo | Out of Gauge (OOG) cargo is any cargo that can not be loaded into six-sided shipping containers simply because it is too large. The term is a very loose classification of all cargo with dimensions beyond the maximum 40HC container dimensions. That is a length beyond 12.05 meters – a width beyond 2.33 meters – or a height beyond 2.59 meters. |
| Other ships | Other ships include: Liquefied petroleum gas carriers, liquefied natural gas carriers, parcel (chemical) tankers, specialized tankers, reefers, offshore supply vessels, tugboats, dredgers, cruise, ferries, other non-cargo ships |
| Other Specialised Cargo | Other specialised goods include pre-slung goods (Goods, one or more items, supplied with a sling or slings), mobile units (Mobile Self Propelled Units, Non Self Propelled Units, unrolled vehicles), oversized equipment load (light and heavy machinery that is often too big or too heavy), high value freight that needs extra protection like electronics, financial services road freight. |
| Outsourced Freight Transport | Transport for hire or reward; The carriage for remuneration of goods. |
| Pallets | Raised platform, intended to facilitate the lifting and stacking of goods. |
| Part load | A part load describes goods which only fills a truck partially. In essence, the quantity of the shipment is bigger than the Less Than Truckload (LTL) shipment. Also, the shipment cannot fully occupy a truck i.e. its capacity is much lower than a Full Truckload (FTL) shipment. |
| Paved Road | Road surfaced with crushed stone (macadam) with hydrocarbon binder or bituminized agents, with concrete or with cobblestone. |
| Q-commerce | Q-commerce, also referred to as quick commerce, is a type of e-commerce where emphasis is on quick deliveries, typically in less than an hour. |
| Quay | A stone or metal platform lying alongside or projecting into water for loading and unloading ships. |
| Recommerce | Recommerce is the selling of previously owned items through online marketplaces to buyers who reuse, recycle or resell them. |
| ReverseLogistics | Reverse logistics is a type of supply chain management that moves goods from customers back to the sellers or manufacturers. |
| Road Freight Transport Service | Hiring a trucking agency for transport of commodities (raw materials or manufactured goods including both solids and liquids) form the origin to a destination within the country (domestic) or cross-border (international) constitutes road freight transport market. The service might be Full-Truck-Load or Less than-Truck-Load, containerized or non-containerized, temperature controlled or non temperature controlled, short haul or long haul. |
| Roll-on/roll-off cargo | Roll-on/roll-off (RORO or ro-ro) ships are cargo ships designed to carry wheeled cargo, such as cars, motorcycles, trucks, semi-trailer trucks, buses, trailers, and railroad cars, that are driven on and off the ship on their own wheels or using a platform vehicle, such as a self-propelled modular transporter. |
| Swap bodies | A swap body, swop body, exchangeable container or interchangeable unit, is one of the types of standard freight containers for road and rail transport. |
| Tank Barge | A non-self-propelled vessel constructed or adapted primarily to carry liquid, solid or gaseous commodities or cargos in bulk in cargo spaces (or tanks) through rivers and inland waterways, and may occasionally carry commodities or cargos through oceans and seas when in transit from one inland waterway to another. The commodities or cargos transported are in direct contact with the tank interior. |
| Tautliner vehicle | Tautliner and curtainsider are used as generic names for curtain sided trucks/trailers. The curtains are permanently fixed to a runner at the top and detachable rails/poles at front and rear, allowing the curtains to be drawn open and forklifts used all along the sides for easy and efficient loading and unloading. When closed for travel, vertical load restraint straps are attached to a rope rail beneath the truck bed, connecting the truck bed and curtain along both sides. Winches at either end of the curtain tension it, hence the 'Tautliner' name. This stops the curtain from flapping or drumming in the wind and can also help retain light loads from slipping sideways. |
| Transloading | Transloading is a shipping term that refers to the transfer of goods from one mode of transportation to another en route to their ultimate destination. |
| Tsubo | A Japanese unit of area equal to 35.58 square feet. |
| Unpaved Road | Road with a stabilized base not surfaced with crushed stone, hydrocarbon binder or bituminized agents, concrete or cobblestone. |
| Vessel Husbandry Services | It includes ship maintenance, repairs, cleaning, upkeep of the hull and rigging and equipment. |


Research Methodology
Mordor Intelligence follows a four-step methodology in all our reports.
- Step-1: Identify Key Variables: In order to build a robust forecasting methodology, the variables and factors identified in Step-1 are tested against available historical market numbers. Through an iterative process, the variables required for market forecast are set and the model is built on the basis of these variables.
- Step-2: Build a Market Model: Market-size estimations for the forecast years are in nominal terms. Inflation is not a part of the pricing, and the average selling price (ASP) is kept constant throughout the forecast period for each country.
- Step-3: Validate and Finalize: In this important step, all market numbers, variables and analyst calls are validated through an extensive network of primary research experts from the market studied. The respondents are selected across levels and functions to generate a holistic picture of the market studied.
- Step-4: Research Outputs: Syndicated Reports, Custom Consulting Assignments, Databases & Subscription Platforms


