Market Overview
| Study Period | 2018 - 2031 |
|---|---|
| Forecast Data Period | 2026 - 2031 |
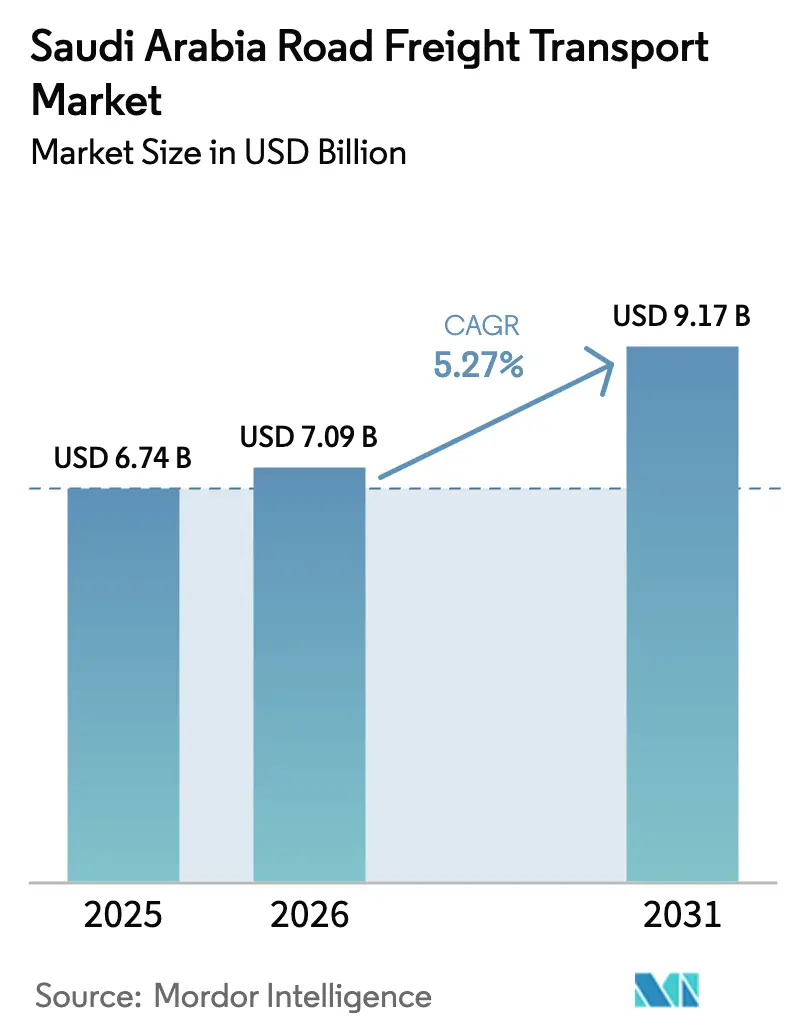
| Base Year Market Size (2025) | USD 6.74 Billion |
| Market Size (2026) | USD 7.09 Billion |
| Market Size (2031) | USD 9.17 Billion |
| Growth Rate (2026 - 2031) | 5.27% CAGR |
| Market Concentration | Low |
Major Players *Disclaimer: Major Players sorted in no particular order Image © Mordor Intelligence. Reuse requires attribution under CC BY 4.0. | |
Saudi Arabia Road Freight Transport Market Analysis by Mordor Intelligence
The Saudi Arabia road freight transport market size is expected to grow from USD 6.74 billion in 2025 to USD 7.09 billion in 2026 and is forecast to reach USD 9.17 billion by 2031 at 5.27% CAGR over 2026-2031. Growth is propelled by large-scale infrastructure spending under Vision 2030, accelerating e-commerce adoption, and policy incentives that modernize fleets while cutting empty miles. Heavy-haul freight linked to giga-projects such as NEOM, expanding cold-chain networks for pharmaceuticals and food security, and 5G-enabled digital freight-matching platforms are reshaping shipment patterns and boosting asset utilization. At the same time, Saudization wage floors, driver shortages, and congestion on the Riyadh-Dammam-Jeddah triangle elevate operating costs and intensify the need for technology-driven efficiency gains. Competitive dynamics remain fragmented, yet the 2025 completion of DSV’s USD 15.3 billion takeover of DB Schenker signals the arrival of scale players capable of offering integrated multimodal solutions.
Key Report Takeaways
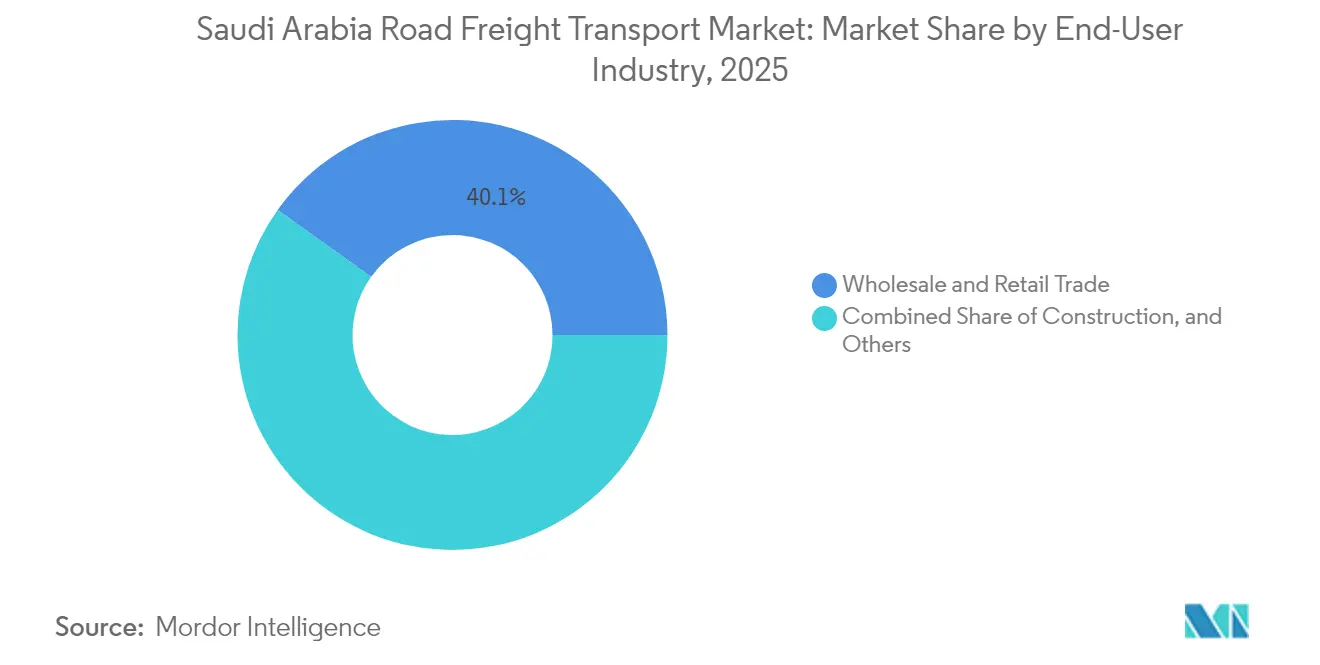
- By end user industry, wholesale and retail trade held 40.12% of the Saudi Arabia road freight transport market share in 2025 and is set to advance at a 5.79% CAGR between 2026-2031, underscoring the e-commerce boom.
- By destination, domestic movements represented 61.25% of the Saudi Arabia road freight transport market size in 2025, while international routes are set to grow faster at 5.96% CAGR between 2026-2031, on the back of the Saudi Landbridge and tri-continental hub strategy.
- By truckload specification, full-truck-load controlled 78.42% share in 2025; less than-truck-load is set to expand at 5.78% CAGR between 2026-2031, as shipment fragmentation rises.
- By containerization, non-containerized freight dominated with 87.22% share in 2025, yet containerized revenues are set to increase at 5.45% CAGR between 2026-2031, thanks to port automation and inland depots.
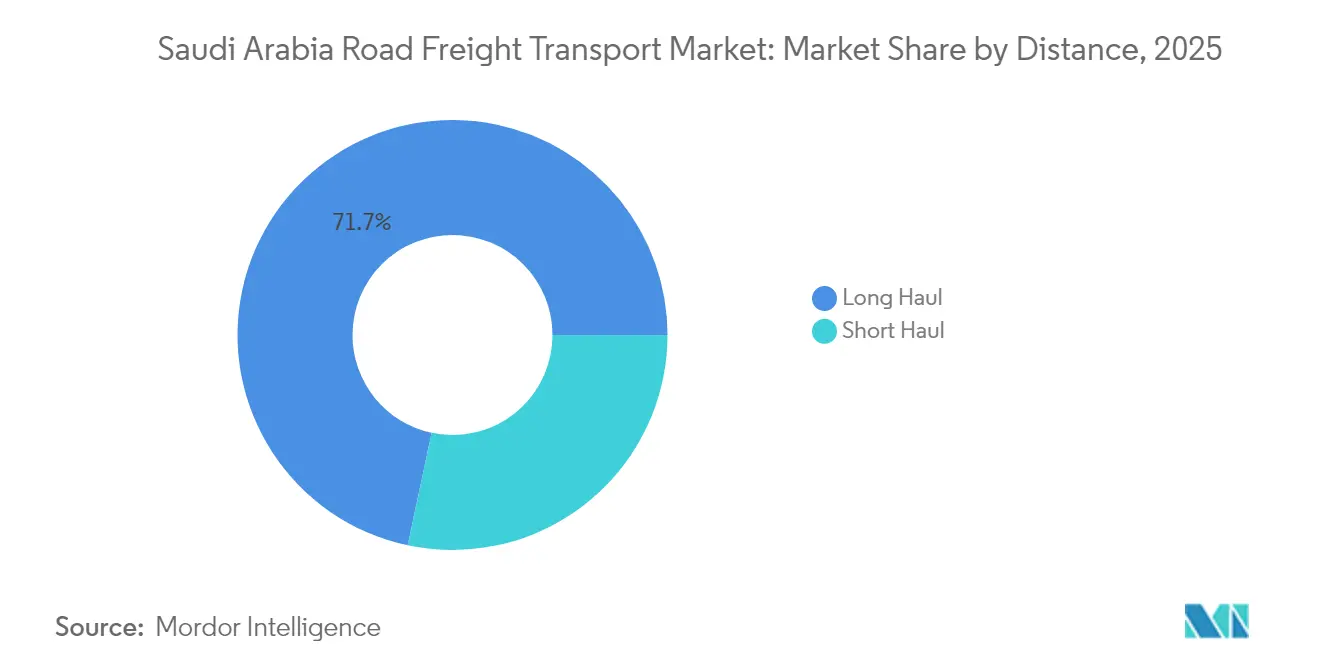
- By distance, long-haul captured 71.66% share in 2025 and are expected to grow at 5.54% CAGR between 2026-2031, a reflection of the Kingdom’s 73,000 km highway grid.
- By goods configuration, solid goods comprised 61.74% of revenue share in 2025, whereas fluid goods are projected to rise at a 5.55% CAGR between 2026-2031, due to petrochemical output growth.
- By temperature control, temperature-controlled freight accounted for only 5.72% of 2025 value but is the fastest-growing segment at 5.92% CAGR between 2026-2031, driven by pharma and fresh food logistics.
Note: Market size and forecast figures in this report are generated using Mordor Intelligence’s proprietary estimation framework, updated with the latest available data and insights as of 2026.
Saudi Arabia Road Freight Transport Market Trends and Insights
Drivers Impact Analysis*
| Driver | (~) % Impact on CAGR Forecast | Geographic Relevance | Impact Timeline |
|---|---|---|---|
| Large-scale infrastructure spend under Saudi Vision 2030 | +1.2% | NEOM, Riyadh, Eastern Province | Long term (≥ 4 years) |
| Rapid E-commerce penetration catalyzing B2C volumes | +0.9% | Riyadh, Jeddah, Dammam | Medium term (2-4 years) |
| National Industrial Development and Logistics Program (NIDLP) incentives accelerating fleet modernization | +0.7% | Industrial zones, port corridors | Medium term (2-4 years) |
| Saudi Landbridge rail-road intermodal hubs expanding long-haul trans-shipment demand | +0.6% | Eastern-to-Western corridor | Long term (≥ 4 years) |
| NEOM and other giga-project construction boom boosting heavy-haul requirements | +0.8% | Northwestern region | Long term (≥ 4 years) |
| 5G-enabled digital freight-matching platforms and IoT adoption cutting empty miles | +0.5% | National freight corridors | Short term (≤ 2 years) |
| Source: Mordor Intelligence | |||
Large-Scale Infrastructure Spend Under Saudi Vision 2030
Vision 2030 commits multibillion-dollar capital toward airports, highways, and logistics zones that permanently raise freight demand. The 170 km linear city at NEOM alone requires continuous heavy-haul movements of cement, steel, and prefabricated modules over a decade-long build schedule. New corridors such as the King Salman International Airport logistics zone anchor greenfield distribution hubs that bypass legacy seaports, prompting fleet upgrades among carriers positioned to handle specialized project cargo[1]“MEDGULF Report 2025 Saudi Driving Report,” MEDGULF, medgulf.com.sa.
Rapid E-Commerce Penetration Catalyzing B2C Volumes
Online retail keeps shifting loads from bulk B2B pallets to fragmented B2C parcels, stimulating less-than-truck-load growth at 6.19% CAGR (2025-2030). Urban consolidation centers multiply around Riyadh and Jeddah, while last-mile specialists like JandT Express launch time-definite services that force incumbents to adopt route-optimization tools. Digital marketplaces that pair shippers with spare capacity shrink empty miles and support dynamic pricing models.
National Industrial Development and Logistics Program Incentives Accelerating Fleet Modernization
NIDLP rebates, duty exemptions, and subsidized financing spur purchases of fuel-efficient tractors and telematics. Mandatory telematics on commercial vehicles from January 2025 create data flows that allow predictive maintenance and drive-time compliance monitoring, lifting overall fleet reliability in the Saudi Arabia road freight transport market[2]“Saudi Arabia Plans Logistics Hub with China,” CHINA DAILY, chinadaily.com.cn.
Saudi Landbridge Rail-Road Intermodal Hubs Expanding Long-haul Trans-shipment Demand
The Landbridge cuts Red Sea-to-Gulf transit by 72 hours, encouraging reload from ship to rail to road within inland dry ports designed for double-stack containers. Carriers able to provide drayage at both railheads capture higher-margin intermodal business and diversify away from pure highway revenue.
Restraints Impact Analysis*
| Restraint | (~) % Impact on CAGR Forecast | Geographic Relevance | Impact Timeline |
|---|---|---|---|
| Driver shortage and high Saudization wage floor | –0.8% | Nationwide, acute in remote areas | Medium term (2-4 years) |
| Reliance on expatriate workforce amid stricter visa caps | –0.6% | Major logistics hubs | Medium term (2-4 years) |
| Highway congestion on key trade corridors | –0.4% | Riyadh-Dammam-Jeddah triangle | Short term (≤ 2 years) |
| Fragmented owner-operator base limiting scale efficiencies | –0.5% | Rural and secondary markets | Long term (≥ 4 years) |
| Source: Mordor Intelligence | |||
Driver Shortage and High Saudization Wage Floor
Wage premiums mandated for Saudi nationals raise unit costs by double-digit percentages versus expatriate drivers. Training initiatives narrow skill gaps, yet cultural preferences for office roles keep domestic driver uptake modest. Fleet operators accelerate trials of driver-assist technologies to ease workload and extend allowable routes[3]“Nitham Al-Murur (Traffic Law),” Bureau of Experts at the Council of Ministers, boe.gov.sa.
Reliance on Expatriate Workforce amid Stricter Visa Caps
Quota-based visa limits for South Asian drivers disrupt seasonal capacity spikes. Carriers respond by sponsoring Saudi trainees and raising benefits, but the transition period stresses service levels during peak construction seasons.
*Our forecasts treat driver/restraint impacts as directional, not additive. The impact forecasts reflect baseline growth, mix effects, and variable interactions.
Segment Analysis
By End User Industry: Wholesale Trade Drives Digital Transformation
Wholesale and retail trade captured 40.12% of 2025 revenue share, the highest share in the Saudi Arabia road freight transport market. The segment’s 5.79% CAGR between 2026-2031 is powered by omnichannel retail that blends regional distribution centers with rapid-fire urban deliveries. Wholesale hubs in Riyadh and Jeddah aggregate imported consumer electronics, apparel, and FMCG for cross-docking into GCC markets, demanding synchronized inbound FTL and outbound LTL schedules.
Construction ranks second, reflecting sustained raw-material moves to giga-projects. Manufacturing demand upgrades from project-based to steady contract freight as automotive and electronics plants ramp output. Oil and Gas remains sizable for rig moves and specialized equipment, while Agriculture benefits from cold-chain expansion for perishables. Emerging sectors such as renewable-energy equipment shipments occupy the “Others” category, adding niche revenue streams without yet moving the Saudi Arabia road freight transport market size needle.


By Destination: International Growth Signals Regional Hub Ambitions
Domestic hauls commanded 61.25% in 2025, anchored by petrochemical clusters in the Eastern Province and consumer centers in Riyadh and Jeddah. Still, international routes are forecast to expand at 5.96% CAGR (2026-2031) as the Kingdom leverages tri-continental positioning to lure trans-shipment away from Dubai. Landbridge integration trims Asia-to-Europe voyage times, allowing shippers to bypass the Suez Canal chokepoint.
Customs process digitalization accelerates border clearances, while inland free zones attract inventory re-exports to Africa. Cross-border operators equip tractors with multilateral insurance and GCC-standard telematics to meet compliance rules. Premium tariffs for door-to-door service enlarge margins, creating headroom for fleet upgrades that lift the Saudi Arabia road freight transport market share of higher-value intermodal offerings.
By Truckload Specification: LTL Growth Reflects Shipment Fragmentation
Full-Truck-Load still dominates at 78.42% share yet its growth lags at 5.16% CAGR (2026-2031). E-commerce, spare-parts distribution, and SME manufacturing collectively drive 5.78% CAGR (2026-2031) in LTL, requiring micro-hubs and sophisticated scheduling software. Third-party logistics providers capitalize by bundling diverse shipper volumes into consolidated line-haul runs and deconsolidating for final delivery.
Technology-enabled brokers exploit real-time capacity visibility to monetize empty backhauls. FTL carriers diversify into pooled-distribution models, creating hybrid fleets of 40-ton trailers and 7-ton box trucks. The Saudi Arabia road freight transport industry benefits because flexible load configurations raise overall asset utilization and dilute seasonality risk.
By Containerization: Standardization Gains Momentum Despite Non-Containerized Dominance
Non-containerized cargo dominated 87.22% of 2025 tonnage, rooted in bulk building materials and oversize industrial components. Yet containerized freight grows 5.45% CAGR (2026-2031) as shippers prize predictable handling and lower damage risk. Port of NEOM automation slashes turnaround, incentivizing exporters to shift steel coil and petrochemical drums into 20-foot containers.
Dry-ports near Riyadh cut drayage miles by staging customs-cleared boxes for inland consumption, compressing dwell times. The Saudi Arabia road freight transport market size for container drayage is projected to climb as Landbridge railheads stimulate cross-dock flows between ship, rail, and truck without unpacking cargo.
By Distance: Long Haul Dominance Reflects Geographic Scale
Kingdom-wide average haul lengths exceed 550 km, explaining the 71.66% share for long-haul freight in 2025, and 5.54% CAGR between 2026-2031. Dedicated truck-only lanes on major expressways lift speed limits for articulated vehicles, reducing door-to-door times. Fuel-efficient Euro VI tractors lower per-km costs, offsetting high diesel prices.
Short-haul growth concentrates around urban fulfillment centers, where 3.5-ton trucks and electric vans handle parcel delivery. As urban population hits 87% by 2030, local distribution loops intensify, complementing yet not displacing long-haul dominance in the Saudi Arabia road freight transport market.
By Goods Configuration: Solid Goods Dominance with Fluid Growth Potential
Solid goods maintained 61.74% share in 2025. Palletized FMCG, white goods, and steel beams fill curtain-siders and flatbeds on national corridors. Fluid goods advance 5.55% CAGR (2026-2031), supported by downstream expansion of petrochemical plants and tanker demand for edible oils and dairy.
Operators invest in stainless steel ISO tanks with multilayer insulation to safeguard product integrity over desert stretches. Hazard-goods regulations mandate ADR-compliant fittings, raising entry barriers and concentrating revenue among specialized carriers that bolster the Saudi Arabia road freight transport market share of value-added liquid logistics.
By Temperature Control: Cold Chain Expansion Driven by Food Security and Pharmaceuticals
Non-temperature-controlled freight still delivers 94.28% of value, but temperature-controlled loads outpace overall growth at 5.92% CAGR (2026-2031). Saudi Food and Drug Authority guidelines require continuous temperature logging, driving uptake of telematics inside reefer units.
Pharma distributors contract three-year dedicated-fleet deals to guarantee GDP compliance, while supermarket groups lease cross-docking space to shorten farm-to-fork cycles. New automated cold stores at King Salman Airport integrate with airfreight pods, boosting export potential for strawberries and seafood that anchor Vision 2030 food-security goals.
Geography Analysis
Domestic corridors linking Riyadh, Dammam, and Jeddah accounted for roughly 70% of 2025 road tonnage, highlighting geographic concentration. High volumes on this triangle elevate congestion, but planned truck-only bypasses promise relief. NEOM’s emergence in the northwest adds a new pole of freight demand, prompting government funding for 1,200 km of feeder roads that tie the mega-city to national networks.
International flows are forecast to grow 5.96% CAGR between 2026-2031 as Saudi Arabia positions itself as Asia-to-Europe bridge. The Saudi Landbridge enables Red Sea ports to act as gateways for Gulf Cooperation Council hinterlands, stealing share from the Suez Canal route. Customs interoperability initiatives with Bahrain and the UAE shrink border dwell to under two hours for pre-cleared loads, enhancing supply-chain reliability.
King Salman International Airport’s 4 km² Sino-Logistics Zone, under construction from 2025, anchors multimodal flows that combine belly-hold airfreight with road feeder services to GCC capitals. Eastern Province petrochemical clusters maintain high outbound tanker traffic, while burgeoning export-oriented manufacturing in Riyadh industrial zones raises west-bound container demand. Altogether, these shifts reinforce the Saudi Arabia road freight transport market as the connective tissue in the Kingdom’s tri-continental logistics blueprint.
Competitive Landscape
The sector remains highly fragmented, with thousands of family-run fleets operating fewer than five tractors. Market entry hurdles are low for basic dry-van service, yet rising compliance costs and technology requirements pressure tiny fleets. Almajdouie Group and SMSA Express lead domestics with diversified service portfolios, but their combined share is under 15%, keeping concentration low.
Technology-enabled entrants use cloud-based marketplaces to aggregate loads and carve share from traditional brokers. NIDLP subsidies for telematics catalyze data-driven dispatch among mid-tier fleets. Meanwhile, the April 2025 completion of DSV’s USD 15.3 billion acquisition of DB Schenker doubles DSV’s global scale and injects capital to expand Middle East contract logistics. The merged entity’s 160,000-strong workforce and EUR 41.6 billion (USD 45.91 billion) turnover enable door-to-door multimodal offerings that small independents cannot match.
Government rule changes—such as mandatory GPS tracking and harmonized axle-load standards—favor well-capitalized players able to upgrade equipment quickly. As larger carriers roll out hydrogen and LNG prototypes, cost savings widen versus diesel-powered owner-operators. Consolidation is expected to accelerate as banks tighten lending to un-telematized fleets, nudging asset divestiture and mergers that gradually raise the Saudi Arabia road freight transport market concentration.
Saudi Arabia Road Freight Transport Industry Leaders
Almajdouie Group
Al Rajhi Group
Saudi Post- SPL (including NAQEL Express)
Aramex
DHL Group
- *Disclaimer: Major Players sorted in no particular order


Recent Industry Developments
- October 2024: Batic Investment & Logistics Company (including Mubarrad) acquired 16,000 m² property with warehouses in Riyadh in October 2024, aligning with logistics sector growth.
- July 2024: Almajdouie Group formed a joint venture with CEVA Logistics to provide integrated logistics services, support growth in the Saudi logistics sector, and align with Vision 2030.
- March 2024: Aramex expanded its regional presence with a new HQ in Riyadh and launched an online shipping platform earlier in 2021, tailored for Saudi startups, supporting e-commerce logistics growth.
- February 2024: DHL Group and Saudi Aramco’s Advanced Sustainable Mobility Organization formed a USD 570 million joint venture to pilot hydrogen-powered trucks in the Kingdom.


Saudi Arabia Road Freight Transport Market Report Scope
Agriculture, Fishing, and Forestry, Construction, Manufacturing, Oil and Gas, Mining and Quarrying, Wholesale and Retail Trade, Others are covered as segments by End User Industry. Domestic, International are covered as segments by Destination. Full-Truck-Load (FTL), Less than-Truck-Load (LTL) are covered as segments by Truckload Specification. Containerized, Non-Containerized are covered as segments by Containerization. Long Haul, Short Haul are covered as segments by Distance. Fluid Goods, Solid Goods are covered as segments by Goods Configuration. Non-Temperature Controlled, Temperature Controlled are covered as segments by Temperature Control.End User Industry
| Agriculture, Fishing, and Forestry |
| Construction |
| Manufacturing |
| Oil and Gas, Mining and Quarrying |
| Wholesale and Retail Trade |
| Others |
Destination
| Domestic |
| International |
Truckload Specification
| Full-Truck-Load (FTL) |
| Less than-Truck-Load (LTL) |
Containerization
| Containerized |
| Non-Containerized |
Distance
| Long Haul |
| Short Haul |
Goods Configuration
| Fluid Goods |
| Solid Goods |
Temperature Control
| Non-Temperature Controlled |
| Temperature Controlled |
| End User Industry | Agriculture, Fishing, and Forestry |
| Construction | |
| Manufacturing | |
| Oil and Gas, Mining and Quarrying | |
| Wholesale and Retail Trade | |
| Others | |
| Destination | Domestic |
| International | |
| Truckload Specification | Full-Truck-Load (FTL) |
| Less than-Truck-Load (LTL) | |
| Containerization | Containerized |
| Non-Containerized | |
| Distance | Long Haul |
| Short Haul | |
| Goods Configuration | Fluid Goods |
| Solid Goods | |
| Temperature Control | Non-Temperature Controlled |
| Temperature Controlled |


Market Definition
- Agriculture, Fishing, and Forestry (AFF) - This end user industry segment captures the external (outsourced) logistics expenditure incurred by the AFF industry players on road freight transport service. The end user players considered are the establishments primarily engaged in growing crops, raising animals, harvesting timber, harvesting fish & other animals from their natural habitats and providing related support activities. Herein, across the value chain, Logistics Service Providers (LSPs) play a crucial role in acquisition, storage, handling, transportation, and distribution activities for the optimal & continuous flow of inputs (seeds, pesticides, fertilizers, equipment, and water) from manufacturers or suppliers to the producers and smooth flow of output (produce, agro-goods) to distributors/ consumers. This includes both termperature controlled and non-temperature controlled logistics, as and when required according to the shelf life of goods being transported or stored.
- Construction - This end user industry segment captures the external (outsourced) logistics expenditure incurred by the construction industry players, on road freight transport service. The end user players considered are the establishments primarily engaged in constructing, repairing and renovating residential & commercial buildings, infrastructure, engineering works, subdividing and developing land. Logistics Service Providers (LSPs) play a crucial role in increasing profitability of construction projects by maintaing the inventory of raw materials & equipment, time-critical supplies and by providing other value added services for effective project management.
- Containerized Road Freight Transport - The segment captures the external (outsourced) logistics expenditure incurred by the road freight transport service end users on Full-Truck-Load (FTL) services. FTL road freight transport is characterized as a full single load not combined with other shipments. It comprises of shipments (i) devoted to the goods of a single shipper (ii) taken directly from a point of origin to one or more destination points (iii) comprising of bulk mail truck transportation (iv) comprising of both Container (Full Container Load, FCL)/Non-Container trucking services (v)comprsing of goods requiring temperature controlled or non-temperature controlled transportation services (vi) comprising of bulk liquid tankering (vii) invoving trucking of waste (viii) hazardous material trucking. Related value added services (VAS) of sorting, consolidation, deconslidation are included in the other services segment of freight and logistics market.
- Export Trends and Import Trends - Overall logistics performance of an economy is positively and significantly (statistically) correlated to its trade performance (exports and imports). Hence, in this industry trend, total value of trade, major commodities/ commodity groups and the major trade partners, for the studied geography (country or region as per the scope of report) have been analysed alongside the impact of major trade/logistics infrastructure investments & regulatory environment.
- Fluid Goods - The segment captures the external (outsourced) logistics expenditure incurred by the road freight transport service end users for the transport of bulk liquids, that are often used in extraction, manufacturing, food processing, agriculture industries among others. It includes transportation of liquids like (i) Chemicals/ hazardous goods (for instance acids) (ii) Water (potable as well as waste) (iii) Oil and gas (upstream as well as downstream like gasoline, fuel, crude oil, or propane), (iv) Food grade bulk liquids (like milk, or juice), (v) Rubber, (vi) Agrichemical products, among others. These goods are generally transported through tanker trucking.
- Fuel Price - Fuel price spikes can cause delays and diruption for logistics service providers (LSPs), while drops in the same can result in higher short-term profitability and increased market rivalry to offer consumers with the best deals. Hence, the fuel price variations have been studied over the review period and presented along with the causes as well as market impacts.
- Full-Truck-Load (FTL) Road Freight Transport - The segment captures the external (outsourced) logistics expenditure incurred by the road freight transport service end users on Full-Truck-Load (FTL) services. FTL road freight transport is characterized as a full single load not combined with other shipments. It comprises of shipments (i) devoted to the goods of a single shipper (ii) taken directly from a point of origin to one or more destination points (iii) comprising of bulk mail truck transportation (iv) comprising of both Container (Full Container Load, FCL)/Non-Container trucking services (v)comprsing of goods requiring temperature controlled or non-temperature controlled transportation services (vi) comprising of bulk liquid tankering (vii) invoving trucking of waste (viii) hazardous material trucking. Related value added services (VAS) of sorting, consolidation, deconslidation are included in the other services segment of freight and logistics market.
- GDP Distribution by Economic Activity - Nominal Gross Domestic Product and distribution of the same, across major economic sectors in the geography studied (country or region as per scope of the report) have been studied and presented in this industry trend. As GDP is positively related to the profitability and growth of logistics industry, this data has been used in adjunction to the input-output tables/ supply-use tables for analyzing the potential major contributing sectors towards the logistics demand.
- GDP Growth by Economic Activity - Growth of Nominal Gross Domestic Product across major economic sectors, for the geography studied (country or region as per scope of the report) have been presented in this industry trend. This data has been utilized for assessing the growth of logistics demand from all the market end users (economic sectors considered here).
- Inflation - Variations in both Wholesale Price Inflation (YoY change in producer price index) and Consumer Price Inflation have been presented in this industry trend. This data has been used to assess the inflationary environment as it plays a vital role in smooth functioning of the supply chain, directly impacting the logistics operational cost components e.g., pricing of tyres, driver wages & benefits, energy/fuel prices, maintenace costs, toll charges, warehousing rents, custom brokerage, forwarding rates, courier rates etc. hence impacting the overall freight and logistics market.
- Key Industry Trends - The report section named "Key Industry Trends" include all the key variables/parameters studied to better analyze the market size estimates and forecasts. All the trends have been presented in the form of data points (time series or latest available data points) along with analysis of the paramter in the form of concise market relevant commentary, for the geography studied (country or region as per the scope of report).
- Key Strategic Moves - The action taken by a company to differentiate from its competitor or used as a general strategy is referred to as a key strategic move (KSM). This includes (1) Agreements (2) Expansions (3) Financial Restructuring (4) Mergers and Acquisitions (5) Partnerships, and (6) Product Innovations. Key players (Logistics Service Providers, LSPs) in the market have been shortlisted, their KSM have been studied and presented in this section.
- Less than-Truck-Load (LTL) Road Freight Transport - The segment captures the external (outsourced) logistics expenditure incurred by the road freight transport service end users on Less than-Truck-Load (LTL) services. LTL road freight transport is characterized as multiple shipments combined onto a single truck for multiple deliveries within a network. It comprises of establishments (i) primarily engaged in general and specialized freight trucking of less than complete truck-loads, (ii) characterized by the use of terminals to consolidate shipments, generally from several shippers, into a single truck for haulage between a load assembly terminal and a disassembly terminal, where the load is sorted and shipments are re-routed for delivery (iv) Less than-Container-Load (LCL) shipping/ Groupage Shipping in case of trucking services. The activities in scope include (i) local pick-up, (ii) line-haul, and (iii) local delivery. Related value added services (VAS) of sorting, consolidation, deconslidation are included in the other services segment of freight and logistics market.
- Logistics Performance - Logistics Performance and Logistics Costs are the backbone of trade, and influences trade costs, making countries compete globally. Logistics performance is influenced by market wide adopted supply chain management strategies, government services, investments & policies, fuel/ energy costs, inflationary environment etc. Hence, in this industry trend, the logistics performance of the geography studied (country/ region as per the scope of report) has been analysed and presented over the review period.
- Major Truck Suppliers - Market share of truck brands is influenced by factors like geographical preferences, portfolio of truck types, truck prices, local production, truck repair & maintenance service peneteration, customer support, technological innovations (like electric vehicles, digitalization, autonomous trucks), fuel efficiency, financing options, annual maintenance costs, availability of substitutes, marketing startegies etc. Hence, the distribution (share % for base year of the study) of truck sales volume for leading truck brands and commentary on current market scenario & market anticipation over the forecast period have been presented in this industry trend.
- Manufacturing - This end user industry segment captures the external (outsourced) logistics expenditure incurred by the Manufacturing industry players, on road freight transport service. The end user players considered are the establishments primarily engaged in the chemical, mechanical or physical transformation of materials or substances into new products. Logistics Service Providers (LSPs) play a crucial role in maintaining a smooth flow of raw materials across the supply chain, enabling timely delivery of finished goods to distributors or end customers and storing & supplying the raw materials to clients for just-in-time manufacturing.
- Modal Share - Freight Modal Share is influenced by factors like modal productivity, government regulations, containerization, distance of shipment, temperature control requirements, type of goods, international trade, terrain, speed of delivery, shipment weight, bulk shipments, etc. Also, modal share by tonnage (tons) and modal share by freight turnover (ton-km) differ as per average distance of shipments, weight of major commodity groups transported in the economy and number of trips. This industry trend represents the distribution of freight transported by mode of transport (tons as well as ton-km), for the study base year.
- Oil and Gas, Mining and Quarrying - This end user industry segment captures the external (outsourced) logistics expenditure incurred by the extraction industry players, on road freight transport service. The end user players considered are the establishments that extract naturally occurring mineral solids, such as coal and ores; liquid minerals, such as crude petroleum; and gases, such as natural gas. Logistics Service Providers (LSPs) covers entire phases from upstream to downstream and plays a crucial role in the transportation of machinery, drilling equipments, extracted minerals, crude oil & natural gas and refined/ processed products from one place to another.
- Other End Users - Other end user segment captures the external (outsourced) logistics expenditure incurred by the financial services (BFSI), real estate, educational services, healthcare, and professional services (administrative, waste management, legal, architectural, engineering, design, consulting, scientific R&D), on road freight transport service. Logistics Service Providers (LSPs) plays a crucial role in the reliable movement of supplies and documents to/from these industries such as transporting any equipment or resources required, shipping confidential documents and files, movement of medical goods & supplies (surgical supplies and instruments, including gloves, masks, syringes, equipment) to name a few.
- Producer Price Inflation - It indicates inflation from viewpoint of the producers viz. the average selling price received for their output over a period of time. Annual change (YoY) of producer price index is reported as wholesale price inflation in the "Inflation" industry trend. As WPI captures dynamic price movements in most comprehensive way, it is widely used by governments, banks, industry, business circles and is deemed important in formulation of trade, fiscal and other economic policies. The data has been used in adjunction to consumer price inflation for better understanding the inflationary environment.
- Road Freight Pricing Trends - Freight pricing by mode of transport (USD/tonkm), over the review period, has been presented in this industry trend. The data has been used in assessing the inflationary environment, impact on trade, freight turnover (tonkm), road freight transport market demand and hence the road freight transport market size.
- Road Freight Tonnage Trends - Freight tonnage (weight of goods in tons) handled by mode of transport, over the review period, has been presented in this industry trend. The data has been used as one of the parameters apart from average distance per shipment (km), freight volume (tonkm), and freight pricing (USD/tonkm) to assess the freight transport market size.
- Road Freight Transport - Hiring a road freight transport logistics service provider (LSP) or haulier (outsourced logistics), for the transport of commodities constitutes road freight transport market. The scope of study includes (i) road transport of goods reported by hauliers registered in the reporting countries (ii) transport of raw materials or manufactured goods (solids as well as fluids) (iii) transport using commerical motor vehicles (rigid trucks or tractor-trailers, (iv) Full-Truck-Load (FTL) or Less than-Truck-Load (LTL) transport (v) containerized or non-containerized transport (vi) temperature controlled or non-temperature controlled trasnport, (vii) short haul or long haul (Over-the-road, OTR) transport, (viii) used office or household goods transport (movers and packers), (ix) other specialized cargo transport (dangerous goods, oversized cargo) and (x) outsourced first mile/ middle mile/last mile delivery shipments undertaken by road freight transport players. The scope does not include (i) transport undertaken by hauliers registered in other countries (ii) last mile meal delivery market (iii) grocery delivery market (iv) transportation via road network undertaken/ reported by Courier, Express, and Parcel (CEP) players.
- Road Length - As infrastructure plays a vital role in an economy's logistics performance, variables like length of roads, distribution of road length by surface category (paved v/s unpaved), distribution of road length by road classification (expressways v/s highways v/s other roads), have been analysed and presented in this industry trend.
- Segmental Revenue - Segmental Revenue has been triangulated or computed and presented for all the major players in the market. It refers to the road freight transport market specific revenue earned by the company, over the base year of study, in the geography studied (country or region as per the scope of report). It is computed through the study and analysis of major parameters like financials, service portfolio, employee strength, fleet size, investments, number of countries present in, major economies of concern, etc. that have been reported by the company in its annual reports, webpage. For companies having scarce financial disclosures, paid databases like D&B Hoovers, Dow Jones Factiva have been resorted to and verified through industry/expert interactions.
- Short Haul Road Freight Transport - The segment captures the external (outsourced) logistics expenditure incurred by the road freight transport service end users on local trucking (less than 100 miles). It includes the road transport of goods (i) within a single administrative area and its hinterland, (ii) by smaller trucks and pickup trucks (iii) via containerized as well as dry bulk services (iv) intermodal from ports, container terminals or airports, and (v) outsourced first mile/ last mile delivery shipments undertaken by road freight transport players.
- Transport and Storage Sector GDP - Value and growth of Transport and Storage Sector GDP has a direct relation to the freight and logistics market size, and hence road freight transport market size. Therefore, this variable has been studied and presented over the review period, in value terms (USD) and as share % of total GDP, in this industry trend. The data has been supported by concise and relevant commentary around the investments, developments, and current market scenario.
- Trends in E-Commerce Industry - Enhanced internet connectivity and boom in smartphone penetration, coupled with increasing disposable incomes, has led to a phenomenal growth in the e-commerce market globally. Online shoppers require fast and efficient delivery of their orders leading to an increase in the demand for logistics services especially e-commerce fulfilment services. Hence, the Gross Merchandise Value (GMV), historial and projected growth, breakup of major commodity groups in e-commerce industry for the studied geography (country or region as per scope of the report) have been analysed and presented in this industry trend.
- Trends in Manufacturing Industry - Manufacturing industry involves the transformation of raw materials into finished products, while logistics industry ensures the efficient flow of raw materials to the factory, and the transport of manufactured products to the distributors & consumers. Demand-Supply of both industries are highly cross-linked and critical for a seamless supply chain. Hence, the Gross Value Added (GVA), breakup of GVA into major manufacturing sectors, and growth of manufacturing industry over the review period have been analysed and presented, in this industry trend.
- Trucking Fleet Size By Type - Market share of truck types is influenced by factors like geographical preferences, major end user industries, truck prices, local production, truck repair & maintenance service peneteration, customer support, technological disruptions (like electric vehicles, digitalization, autonomous trucks) etc. Hence, the distribution (share % for base year of study) of truck parc volume by type of truck, market disruptors, truck manufacturing investments, truck specifications, truck use & import regulations, and market anticipation over the forecast period have been presented in this industry trend.
- Trucking Operational Costs - The prime reasons for measuring/ benchmarking logistics performance of any trucking company are to reduce operational costs and increase profitability. On the other hand, measuring operational costs helps to identify whether and where to make operational changes to control expenses and identify areas for improved performance. Hence, in this industry trend, trucking operational costs and the variables involved viz. driver wages & benefits, fuel prices, repairs & maintenance costs, tyre costs etc. have been studied over the base year of study, and presented for the geography studied (country or region as per the scope of report).
- Wholesale and Retail Trade - This end user industry segment captures the external (outsourced) logistics expenditure incurred by the wholesalers and retailers, on road freight transport service. The end user players considered are the establishments primarily engaged in wholesaling or retailing merchandise, generally without transformation, and rendering services incidental to the sale of merchandise. Logistics Service Providers (LSPs) plays a crucial role in the reliable movement of supplies to and finished products from production houses to the distributors and finally to the end customer covering activites like material sourcing, transportation, order fulfillment, warehousing & storage, demand forecasting, inventory management etc.
| Keyword | Definition |
|---|---|
| Cabotage | Road transport by a motor vehicle registered in a country performed on the national territory of another country. |
| Cross Docking | Cross docking is a logistics procedure where products from a supplier or manufacturing plant are distributed directly to a customer or retail chain with marginal to no handling or storage time. Cross docking takes place in a distribution docking terminal; usually consisting of trucks and dock doors on two (inbound and outbound) sides with minimal storage space. The name ‘cross docking’ explains the process of receiving products through an inbound dock and then transferring them across the dock to the outbound transportation dock. |
| Cross Trade | International road transport between two different countries performed by a road motor vehicle registered in a third country. A third country is a country other than the country of loading/embarkation and than the country of unloading/disembarkation. |
| Dangerous Goods | The classes of dangerous goods carried by Road are those defined by the fifteenth revised edition of the UN Recommendations on the Transport of Dangerous Goods, United Nations, Geneva 2007. They include Class 1: Explosives; Class 2: Gases; Class 3: Flammable Liquids; Class 4: Flammable solids- substances liable to spontaneous combustion; substances which, on contact with water, emit flammable gases; Class 5: Oxidizing substances and organic peroxides; Class 6: Toxic and infectious substances; Class 7: Radioactive material and Class 8: Corrosive substances, Class 9: Miscellaneous dangerous substances and articles. |
| Direct Shipment | Direct shipment is a method of delivering goods from the supplier or the product owner to the customer directly. In most cases, the customer orders the goods from the product owner. This delivery scheme reduces transportation and storage costs, but requires additional planning and administration. |
| Drayage | A drayage is a form of trucking service that connects the different modes of shipping (intermodal), such as ocean freight or air freight. It’s a short-haul trip that transports goods from one place to another, usually before or after its long-haul shipping process. Drayage trucks move cargo to and from various destinations, such as container ships, storage lots, order fulfillment warehouses, and rail yards. Typically, drayage only transports goods in short distances and operates only in one metropolitan area. It also requires only one trucker in a single shift. But despite this, but it plays an important role in long-haul shipping because it gets the goods to the cargo and vice versa. It makes intermodal transport much more efficient and enables the seamless transfer of goods to the end customer. |
| Dry van | A dry van is a type of semi-trailer that's fully enclosed to protect shipments from outside elements. Designed to carry palletized, boxed or loose freight, dry vans aren't temperature-controlled (unlike refrigerated “reefer” units) and can't carry oversized shipments (unlike flatbed trailers). |
| Final Demand | Final demand includes all types of commodities (goods as well as services) consumed as final use and might include personal consumption, or consumption by government, by businesses as capital investment, and as exports. includes all types of commodities (goods as well as services) consumed as final use and might include personal consumption, or consumption by government, by businesses as capital investment, and as exports. |
| Flatbed Truck | A flatbed truck is a type of truck with rigid design. It has a back body that is flatly shaped for easy loading and unloading of goods. The flatbed truck is mostly used to transport heavy, oversized, wide and indelicate goods such as machinery, building supplies or equipment. Due to the truck open body, the goods transported with it must not be vulnerable to rain. By functionality, the flatbed truck is comparable to a flatbed trailer. |
| Inbound Logistics | Inbound logistics is the way materials and other goods are brought into a company. This process includes the steps to order, receive, store, transport and manage incoming supplies. Inbound logistics focuses on the supply part of the supply-demand equation. |
| Intermediate Demand | Intermediate demand includes goods, services, and maintenance and repair construction sold to businesses, excluding capital investment. |
| International Loaded | Place of loading of goods in reporting country (i.e., country in which the vehicle performing the transport is registered) and place of unloading in a different country. |
| International Unloaded | Place of unloading of goods in reporting country (i.e., country in which the vehicle performing the transport is registered) and place of loading in a different country. |
| OOG cargo | Out of Gauge (OOG) cargo is any cargo that can not be loaded into six-sided shipping containers simply because it is too large. The term is a very loose classification of all cargo with dimensions beyond the maximum 40HC container dimensions. That is a length beyond 12.05 meters – a width beyond 2.33 meters – or a height beyond 2.59 meters. |
| Pallets | Raised platform, intended to facilitate the lifting and stacking of goods. |
| Part load | A part load describes goods which only fills a truck partially. In essence, the quantity of the shipment is bigger than the Less Than Truckload (LTL) shipment. Also, the shipment cannot fully occupy a truck i.e. its capacity is much lower than a Full Truckload (FTL) shipment. |
| Paved Road | Road surfaced with crushed stone (macadam) with hydrocarbon binder or bituminized agents, with concrete or with cobblestone. |
| Reverse Logistics | Reverse logistics comprises of the sector of supply chains that process anything returning inwards through the supply chain or traveling ‘backward’ through the supply chain. |
| Road Freight Transport Service | Hiring a trucking agency for transport of commodities (raw materials or manufactured goods including both solids and liquids) form the origin to a destination within the country (domestic) or cross-border (international) constitutes road freight transport market. The service might be Full-Truck-Load or Less than-Truck-Load, containerized or non-containerized, temperature controlled or non temperature controlled, short haul or long haul. |
| Tautliner vehicle | Tautliner and curtainsider are used as generic names for curtain sided trucks/trailers. The curtains are permanently fixed to a runner at the top and detachable rails/poles at front and rear, allowing the curtains to be drawn open and forklifts used all along the sides for easy and efficient loading and unloading. When closed for travel, vertical load restraint straps are attached to a rope rail beneath the truck bed, connecting the truck bed and curtain along both sides. Winches at either end of the curtain tension it, hence the 'Tautliner' name. This stops the curtain from flapping or drumming in the wind and can also help retain light loads from slipping sideways. |
| Transport for hire or reward | The carriage for remuneration of goods. |
| Unpaved Road | Road with a stabilized base not surfaced with crushed stone, hydrocarbon binder or bituminized agents, concrete or cobblestone. |


Research Methodology
Mordor Intelligence follows a four-step methodology in all our reports.
- Step-1: Identify Key Variables: In order to build a robust forecasting methodology, the variables and factors identified in Step-1 are tested against available historical market numbers. Through an iterative process, the variables required for market forecast are set and the model is built on the basis of these variables.
- Step-2: Build a Market Model: Market-size estimations for the forecast years are in nominal terms. Inflation is considered to be a part of the pricing, and the average selling price (ASP) is varying throughout the forecast period for each country
- Step-3: Validate and Finalize: In this important step, all market numbers, variables and analyst calls are validated through an extensive network of primary research experts from the market studied. The respondents are selected across levels and functions to generate a holistic picture of the market studied.
- Step-4: Research Outputs: Syndicated Reports, Custom Consulting Assignments, Databases & Subscription Platforms


