Market Overview
| Study Period | 2020 - 2031 |
|---|---|
| Forecast Data Period | 2026 - 2031 |
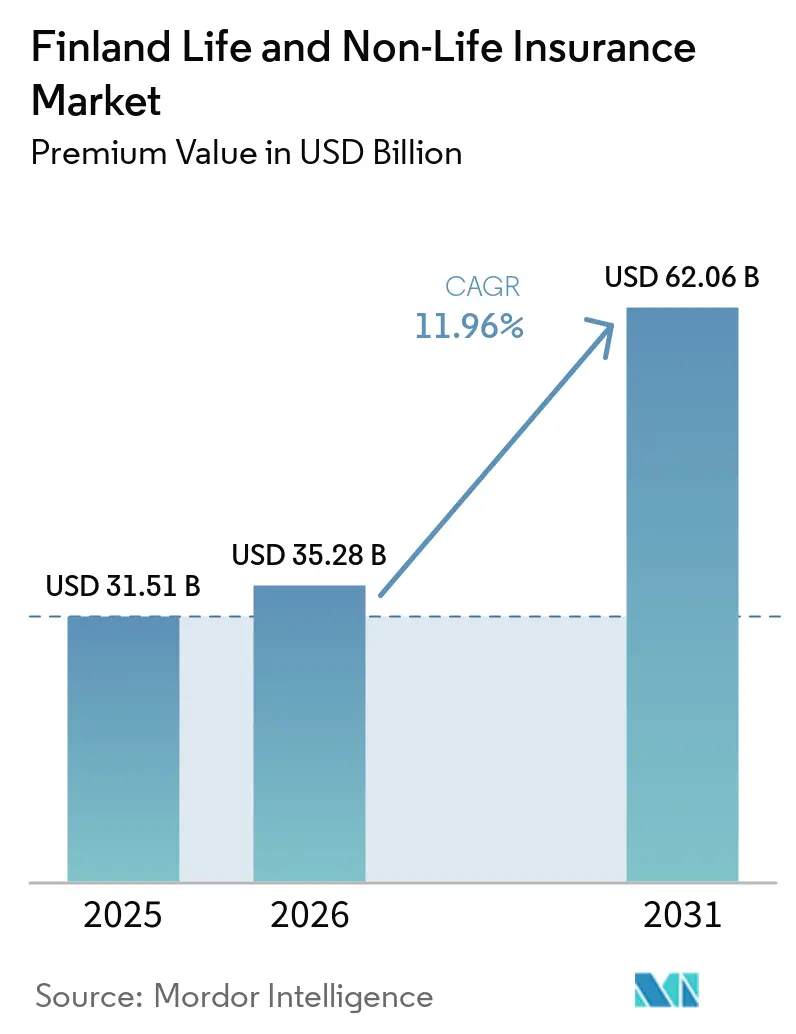
| Base Year Market Size (2025) | USD 31.51 Billion |
| Market Size (2026) | USD 35.28 Billion |
| Market Size (2031) | USD 62.06 Billion |
| Growth Rate (2026 - 2031) | 11.96% CAGR |
| Market Concentration | Medium |
Major Players *Disclaimer: Major Players sorted in no particular order Image © Mordor Intelligence. Reuse requires attribution under CC BY 4.0. | |
Finland Life and Non-Life Insurance Market Analysis by Mordor Intelligence
The Finland Life And Non-Life Insurance Market size in terms of premium value is projected to be USD 31.51 billion in 2025, USD 35.28 billion in 2026, and reach USD 62.06 billion by 2031, growing at a CAGR of 11.96% from 2026 to 2031.
The upswing roots itself in mandatory motor protection that guarantees a recurring premium base, growing interest in private health cover as confidence in public care fades, and rapid insurtech adoption that shortens product launch cycles. A steep rise in weather-related claims, has encouraged development of parametric contracts tailored to Nordic climate realities. Finns’ rising risk awareness, supported by digital self-service portals, strengthens cross-selling of life-linked savings policies now offering better yields as interest rates climb. Meanwhile, alliances such as the Eurapco network give domestic underwriters cost-effective access to shared platforms and talent pools that would be uneconomical to build in-house.
Key Report Takeaways
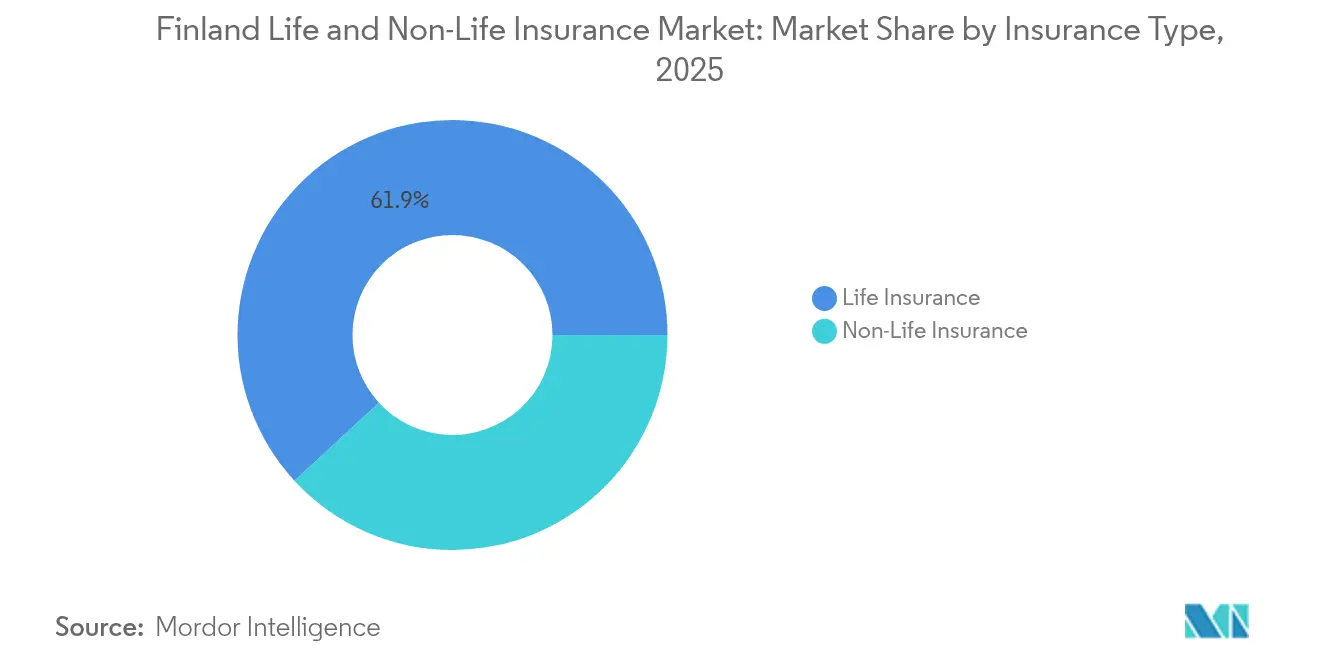
- By insurance type, life insurance led with 61.85% of Finland life and non-life insurance market share in 2025; health insurance is projected to advance at a 12.06% CAGR to 2031.
- By distribution channel, agency/broker models controlled 39.65% revenue in 2025, while online & mobile sales are expected to grow at a 12.88% CAGR through 2031.
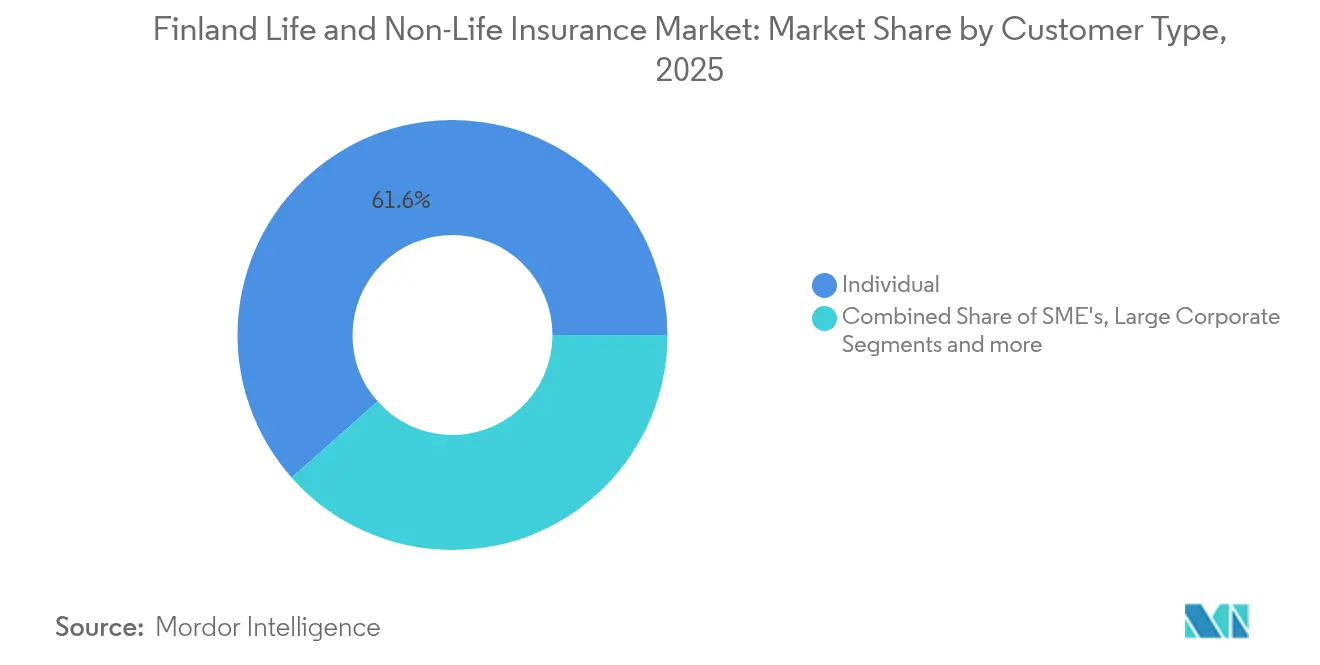
- By customer type, individual/retail buyers accounted for 61.55% of the Finland life and non-life insurance market size in 2025 and are expanding at a 9.05% CAGR.
- By end-user industry, manufacturing held 21.02% share of the Finland life and non-life insurance market size in 2025; ICT & professional services recorded the fastest 8.12% CAGR to 2031.
- By region, Greater Helsinki/Uusimaa secured a 32.05% share in 2025, whereas Eastern Finland shows the quickest 7.95% CAGR outlook.
Note: Market size and forecast figures in this report are generated using Mordor Intelligence’s proprietary estimation framework, updated with the latest available data and insights as of 2026.
Finland Life and Non-Life Insurance Market Trends and Insights
Drivers Impact Analysis*
| Driver | (~)% Impact on CAGR Forecast | Geographic Relevance | Impact Timeline |
|---|---|---|---|
| Growth of insurtech partnerships | +2.1% | National, concentrated in Greater Helsinki | Medium term (2–4 years) |
| Rapid digital self-service adoption | +1.8% | National, strongest in urban areas | Short term (≤2 years) |
| Mandatory MTPL & resilient vehicle sales | +1.4% | National, uniform impact | Long term (≥4 years) |
| Rising demand for voluntary health cover | +2.3% | National, higher in Southern Finland | Medium term (2–4 years) |
| Climate-linked parametric policy uptake | +1.2% | Eastern and Northern Finland | Long term (≥4 years) |
| Higher yields reviving life-savings appeal | +1.6% | Affluent regions nationwide | Medium term (2–4 years) |
| Source: Mordor Intelligence | |||
Growth of Insurtech Partnerships
Domestic carriers increasingly turn to technology alliances to shorten launch cycles and cut fixed IT spend. The January 2025 pact between Qantev and InsureMO illustrates how plug-and-play connectors feed AI-driven analytics into Nordic claims engines, trimming manual review and freeing staff for advisory work. LocalTapiola deepens innovation reach through the Eurapco Alliance, whose eight members pool investment and data to co-create products for 35 markets, a scale unattainable for a single Finnish mid-tier insurer. Collective platforms reduce onboarding costs for niche offerings such as cyber add-ons or pay-per-mile motor cover, accelerating their nationwide rollout. As digital channels win share, partnership-enabled speed becomes critical to defend margins against agile entrants.
Rapid Digital Self-Service Adoption
Finns value seamless online journeys that let them quote, bind, and claim without branch visits. OP Financial Group already offers 24/7 dashboards where households alter deductibles, receive claim payouts, and track savings balances in near real time[1]OP Financial Group, “Interim Report Q1 2024,” op.fi. Pure-play POP Vakuutus serves 190,000 policyholders exclusively through a mobile-first site that posts industry-leading 9.1 customer-satisfaction scores. Government policy complements private moves: the national digital roadmap funds cloud, AI, and cybersecurity upgrades through 2030, making rural e-services as stable as urban ones. Faster onboarding lifts lifetime value per client while automated advice engines cut acquisition costs, a virtuous cycle lifting Finland's life and non-life insurance market growth.
Mandatory MTPL & Resilient Vehicle Sales
Compulsory motor third-party liability keeps premium inflows steady even in downturns. A June 2024 rule extended coverage to electric scooters and similar devices, widening the insured vehicle base overnight. Forthcoming May 2025 amendments require external repair shops to hold clean criminal records before accessing safety-critical vehicle data, enhancing underwriting precision by reducing fraud risk [2]Ministry of Justice Finland, “Vehicle Act 2025 Amendment,” finlex.fi . Pohjola Insurance, which began offering tailored electric-vehicle policies back in 2003, already prices battery, charging-station, and long-distance towing exposures, letting it upsell value-added features as EV adoption rises. Consistent vehicle ownership patterns combined with upgraded compliance rules underpin a predictable revenue stream for the Finland life and non-life insurance market.
Rising Demand for Voluntary Health Cover
Wait-time frustration in public care channels more Finns toward private policies. In 2024, 6.5% of citizens cited unmet medical needs, chiefly due to delays, creating a clear pull for supplemental products that promise same-week access[3]Finnish Institute for Health and Welfare, “Health System Review 2024,” thl.fi . Private provider Mehiläinen reported USD 2.02 billion turnover in 2024, evidence that health-services capacity is scaling to meet insured demand. As well-being service counties mature after the 2023 reform, gaps persist in staffing and infrastructure, making voluntary cover a long-term fixture rather than a temporary workaround. Insurers that bundle doctor networks, telemedicine and wellness analytics are best placed to capture share.
Restraints Impact Analysis*
| Restraint | (~) % Impact on CAGR Forecast | Geographic Relevance | Impact Timeline |
|---|---|---|---|
| Low insurance literacy among consumers | -1.7% | Rural areas nationwide | Long term (≥4 years) |
| Escalating motor / property claims costs | -2.1% | Urban centres | Short term (≤2 years) |
| Solvency II capital strain on innovators | -1.3% | Small and mid-sized carriers | Medium term (2–4 years) |
| Data-localisation costs for cloud use | -0.9% | Market-wide | Medium term (2–4 years) |
| Source: Mordor Intelligence | |||
Escalating Motor / Property Claims Costs
Repair bills for high-tech vehicles and inflation in construction materials lifted damage compensation by 8% in 2024, according to the national watchdog. Frequent freeze-thaw cycles crack roofs and roads, generating surge workloads for adjusters. Premium hikes that follow may dent affordability for price-sensitive users and push small enterprises to raise deductibles, moderating premium growth until cost curves stabilise.
Low Insurance Literacy
Policy wording complexity discourages purchase and leads to under-insurance. Rural households often lack access to reliable advisory channels, leaving gaps that emerge only at claim time. Newer covers, such as cyber or parametric, require extra explanation, extending sales cycles and boosting distribution costs. Industry-backed education drives exist, yet progress remains uneven, shaving growth from the Finland life and non-life insurance market over the long run.
*Our forecasts treat driver/restraint impacts as directional, not additive. The impact forecasts reflect baseline growth, mix effects, and variable interactions.
Segment Analysis
By Insurance Type: Life Strength Meets Health Momentum
Life cover dominated with 61.85% of Finland's life and non-life insurance market share in 2025, supported by pension integration and guaranteed-return components that regained appeal as rates climbed. The segment benefits from the Finland life and non-life insurance market size, buoyed by USD 31.51 billion overall premiums, giving incumbents scale for product innovation. Rising yields help traditional endowments better compete against mutual funds, while employers broaden group life to retain scarce talent in a tight labour pool.
Non-life branches add diversity. Health insurance shows a 12.06% CAGR outlook to 2031, injecting fresh growth into the Finland life and non-life insurance market. Mandatory motor lines create stable cash flow, and new electric-vehicle policy riders extend ticket size. Climate volatility sharpens interest in indexed property contracts that settle faster than appraisal-heavy traditional claims. Specialty sub-lines, from cyber to agriculture, widen choice for SMEs needing bespoke protection.


By Distribution Channel: Digital Upsurge Tests Relationship Models
Traditional agency and broker routes still place 39.65% of premiums, anchored by face-to-face guidance on complex bundles such as succession planning. Yet digital natives propel online and mobile sales at a 12.88% CAGR, converting convenience into sustained Finland life and non-life insurance market growth. Carriers introduce seamless account opening, e-signature workflows, and instant payout functions that tilt preferences toward self-service.
Banks that combine lending, wealth, and risk solutions retain a large crossover base. OP Financial Group alone services 2.1 million owner-customers, underscoring the reach of bancassurance inside the Finland life and non-life insurance industry. Direct brands pursue margin lift through in-house portals but need hefty platform investment. Affinity programs with retailers or gig-worker apps emerge as a flexible middle path, embedding cover inside day-to-day transactions without disrupting customer journeys.
By Customer Type: Retail Core with Corporate Adjacencies
Households supplied 61.55% of written premiums in 2025 and keep growing at 9.05% to 2031. The Finland life and non-life insurance market size for individuals rests on steady wages, high digital literacy, and an ageing population seeking retirement security. Simpler purchase paths lure younger buyers accustomed to subscription-style services.
SMEs crave modular packages that blend cyber, professional indemnity, and business-interruption protection. Global-scale corporations lean on carriers that deliver sophisticated multinational programs and captive-fronting support. Public and non-profit bodies require tailored liability clauses and long-term contracts, encouraging insurers to build specialty units that understand procurement-driven buying processes.
By End-User Industry: Manufacturing Anchor, Services Upswing
Manufacturing led with 21.02% Finland life and non-life insurance market share in 2025, as heavy plant, logistics chains, and export exposure call for multi-line covers. The Finland life and non-life insurance market size for ICT & professional services is smaller but expanding fastest at 8.12% CAGR as cyber threats elevate demand for breach response and errors-and-omissions packages.
Construction maintains a steady appetite for surety and liability as infrastructure renewal gathers pace. Transport firms leverage marine and cargo products that secure Finland’s status as a Baltic gateway. Healthcare providers such as Mehiläinen require embedded malpractice and data-privacy protections, reflecting how service-sector growth diversifies premium pools beyond legacy heavy industry.
Geography Analysis
Greater Helsinki/Uusimaa leads with 32.05% of premiums, anchored by finance, technology, and high household incomes that support multilayer portfolios spanning life, savings, motor, and property. Dense digital infrastructure underpins 24/7 self-service adoption rates that exceed the national average, allowing insurers to test chatbots and instant-payment modules before national rollout.
Southern and Western Finland combine manufacturing heritage with thriving service economies. Regular capital outlays in machinery and real estate sustain demand for equipment breakdown and business-interruption protections. Port activity in Turku and Vaasa attracts marine hull and cargo writers who benefit from Finland’s role in Scandinavian trade corridors, keeping the Finland life and non-life insurance market in these regions stable even as industry mixes evolve.
Eastern Finland’s 7.95% CAGR projection reflects state-backed schemes to widen digital access and foster entrepreneurship. Online channels sidestep branch-network scarcity, letting carriers profitably reach dispersed households. Northern Finland focuses on resource extraction, wind farms, and seasonal tourism, presenting volatile risk profiles that reward underwriters skilled in parametric weather clauses and high-deductible property structures. Åland follows its own rules but taps mainland capacity through fronting agreements that comply with both autonomous and national statutes, illustrating regulatory complexity within a unified Finland life and non-life insurance market framework.
Competitive Landscape
The top trio, OP Financial Group, LocalTapiola, and Sampo’s If P&C, control a dominant share of written premiums, placing the Finland life and non-life insurance market in the moderately concentrated bracket. OP leverages multi-product relationships within its cooperative banking base and ploughs a share into machine-learning claims tools. If P&C, under Sampo, improved its combined ratio to 84.6% in Q1 2025, confirming pricing discipline and stringent risk selection. LocalTapiola’s mutual model and 19 regional units combine local insight with the Eurapco Alliance’s technology exchanges, shortening innovation cycles without jeopardising solvency.
Digital challengers offer focused plays. POP Vakuutus scales through cost-light web sales that resonate with first-time car buyers, while niche underwriters craft parametric, cyber, and embedded covers. Vaisala’s 2024 purchase of Speedwell Climate equips incumbents and start-ups alike with ready-made weather indices, lowering entry hurdles for new climate-linked propositions.
Technology capabilities form the new battleground. Carriers deploying optical-character recognition and natural-language processing now extract about 70% of claim-document data without hands-on input, cutting settlement time and fraud exposure. Firms that lag on automation find expense ratios creeping up as premium growth concentrates in digitally native channels.
Finland Life and Non-Life Insurance Industry Leaders
OP Insurance
LocalTapiola Group
If P&C Insurance (Sampo Group)
Mandatum Life Insurance
Fennia Mutual
- *Disclaimer: Major Players sorted in no particular order

Recent Industry Developments
- February 2025: UNIQA Insurance Group became a permanent Eurapco Alliance member, expanding the consortium that already includes LocalTapiola
- January 2025: Qantev and InsureMO announced a strategic partnership to enhance insurance connectivity and data integration, with Qantev’s AI-driven health and life insurance solutions integrating with InsureMO’s infrastructure platform serving over 300 insurers globally.
- December 2024: EIOPA’s Europe-wide stress test showed aggregate solvency ratios sliding from 221.8% to 123.3% under severe scenarios, yet rebounding to 139.9% after management measures, underlining Finnish insurers’ resilience
- September 2024: Vaisala acquired Speedwell Climate to enhance weather-related financial risk-mitigation capabilities, providing Finnish insurers access to advanced climate-risk transfer solutions and index-based contract structuring expertise.


Research Methodology Framework and Report Scope
Market Definitions and Key Coverage
Our study counts every written premium and policyholder contribution generated by licensed Finnish insurers for risk and savings-oriented life covers (term, whole, annuity, and statutory occupational pension products) together with all non-life classes, motor, property, liability, health, travel, marine, agriculture, and specialty, expressed in USD at annual average rates. Mordor Intelligence values this integrated pool at USD 31.51 billion in 2025, rising to USD 55.96 billion by 2030.
Scope exclusions, reinsurance placed abroad, discretionary mutual benefit schemes, and micro-credit covers issued outside Finnish regulation are not included.
Segmentation Overview
- By Insurance Type
- Life Insurance
- Individual Life
- Group Life
- Pension Insurance
- Non-Life Insurance
- Home
- Motor
- Health
- Travel
- Liability
- Marine & Cargo
- Agriculture
- Other Specialty Lines
- Life Insurance
- By Distribution Channel
- Direct / In-house
- Agency / Broker
- Bancassurance
- Online & Mobile
- Affinity & Partnerships
- Other Channels
- By Customer Type
- Individual / Retail
- SME
- Large Corporate
- Public Sector & Non-profit
- By End-User Industry
- Manufacturing
- Construction & Real Estate
- ICT & Professional Services
- Transport & Logistics
- Other Industries
- By Region
- Greater Helsinki / Uusimaa
- Southern Finland
- Western Finland
- Eastern Finland
- Northern Finland
- Åland Islands
Detailed Research Methodology and Data Validation
Primary Research
Interviews with actuaries at composite insurers, regional broker principals, bancassurance heads, and insurtech founders in Helsinki, Turku, and Oulu tested secondary insights, clarified pricing shifts, and gauged digital channel momentum, which sharpened key assumptions and closed disclosure gaps.
Desk Research
Our team began with regulator releases from the Finnish Financial Supervisory Authority, Statistics Finland, and Insurance Europe, which outline class-wise premiums, claim ratios, and solvency margins. We enriched trend lines with Eurostat disposable income data, Finnish Motor Insurers' Center vehicle registrations, and EIOPA yield curves, then benchmarked carrier performance by screening annual reports through Dow Jones Factiva and D&B Hoovers. These open sources are illustrative; dozens of additional trade journals, consultation papers, and official gazettes were reviewed to complete the picture.
Market-Sizing & Forecasting
A top-down reconstruction starts with regulator-reported premiums by line, layered with pension contributions and adjusted for outward reinsurance to form the 2025 baseline. Select bottom-up checks, average cover value times active policies from sampled carriers, keep totals realistic when disclosure is thin. Core variables include per-capita income, mortgage stock growth, new vehicle registrations, long-term bond yields, claim-cost inflation, and online channel share. Multivariate regression with scenario analysis projects these drivers, after which segment totals are rolled into the national view. Any missing carrier detail is bridged with conservative growth bands derived from peer lines.
Data Validation & Update Cycle
Outputs pass variance filters, senior analyst review, and management sign-off. We refresh models annually and re-contact sources upon material events so clients always see the latest vetted view.
Why Mordor's Finland Life And Non-Life Insurance Baseline Commands Reliability
Published estimates often diverge; differing premium scopes, currency dates, and refresh cadences all drive gaps.
Research Firm A values the 2024 pool at USD 5.53 billion, Publisher B cites USD 4.50 billion for the same year, while Consultancy C limits its 2022 non-life subset to USD 4.30 billion.
Benchmark comparison
| Market Size | Anonymized source | Primary gap driver |
|---|---|---|
| USD 31.51 B (2025) | Mordor Intelligence | - |
| USD 5.53 B (2024) | Research Firm A | Counts only gross written premiums, omits occupational pensions, mid-year FX conversion |
| USD 4.50 B (2024) | Publisher B | Relies on sampled carrier survey, excludes health add-ons, straight-line CAGR |
| USD 4.30 B (2022) | Consultancy C | Tracks non-life classes only, no economic scenario overlay |
The comparison shows that once scope, currency timing, and pension flows are aligned, Mordor's disciplined blend of regulator data, carrier validation, and scenario-tested forecasting offers decision-makers the most transparent and reproducible baseline.


Key Questions Answered in the Report
What is the expected size of the Finland life and non-life insurance market by 2031?
The market is projected to reach USD 62.06 billion by 2031, expanding at a 11.96% CAGR.
Which segment is growing fastest within the Finland life and non-life insurance market?
Health insurance shows the quickest pace with a 12.06% CAGR forecast through 2031.
How concentrated is the competitive landscape?
Three groups account for about 70% of premiums, giving the sector a concentration score of 7
Why are parametric policies gaining traction in Finland?
Rising storm and snowfall losses have pushed insurers toward index-based covers that pay out quickly and cut loss-adjustment costs.
Page last updated on:


