Market Overview
| Study Period | 2020 - 2031 |
|---|---|
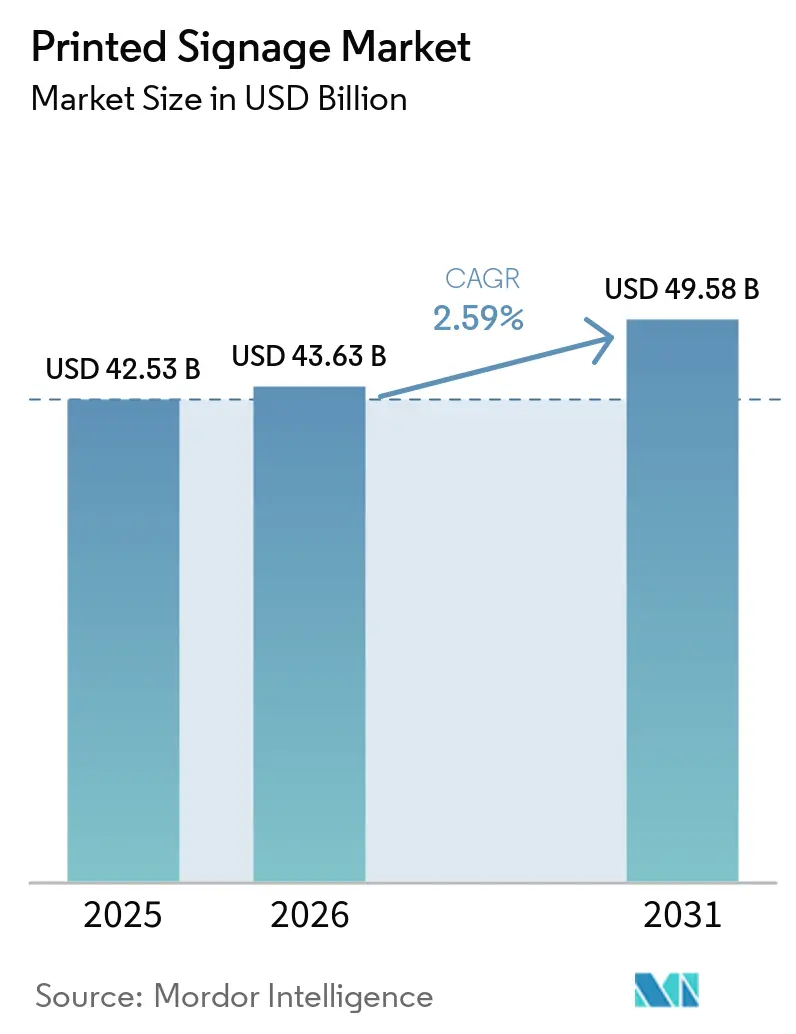
| Market Size (2026) | USD 43.63 Billion |
| Market Size (2031) | USD 49.58 Billion |
| Growth Rate (2026 - 2031) | 2.59% CAGR |
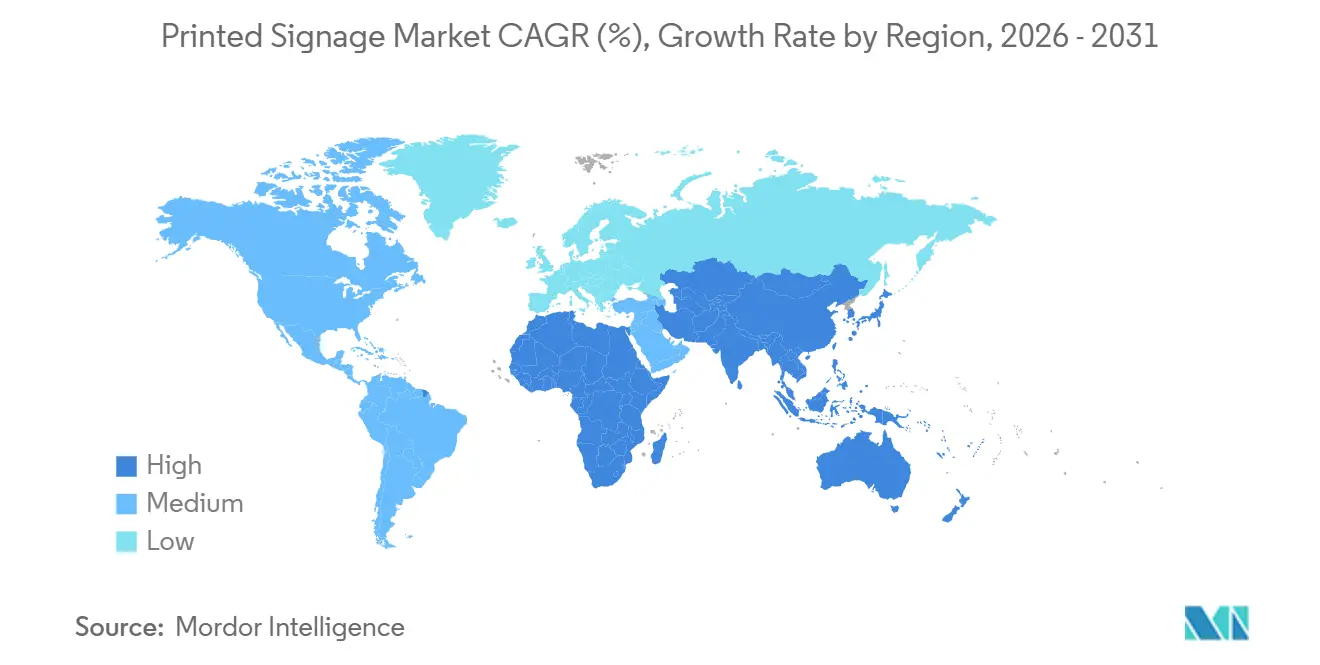
| Fastest Growing Market | Africa |
| Largest Market | Asia Pacific |
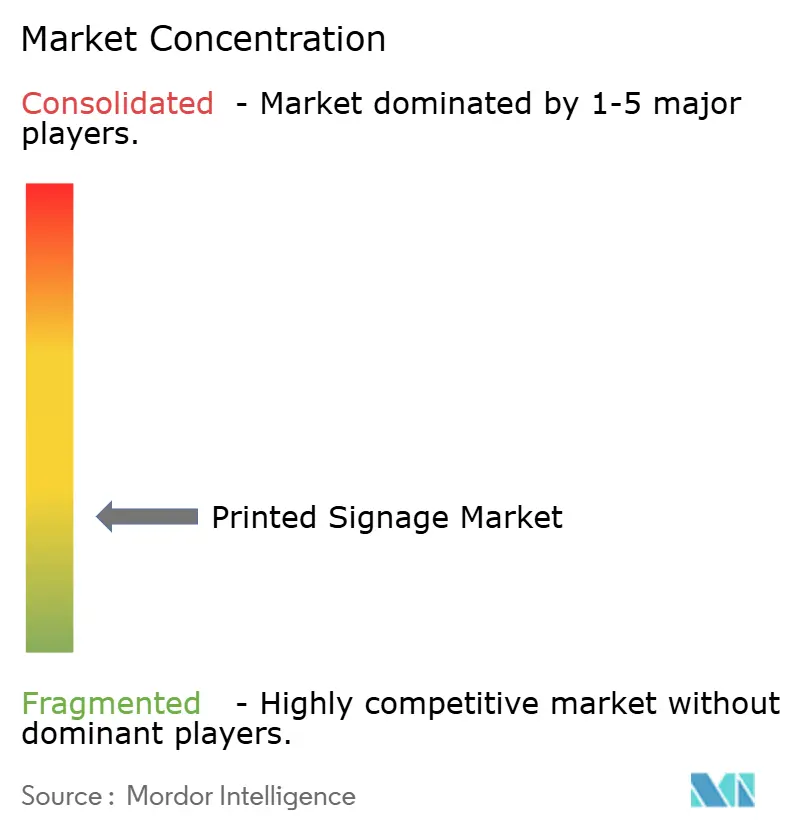
| Market Concentration | Low |
Major Players *Disclaimer: Major Players sorted in no particular order Image © Mordor Intelligence. Reuse requires attribution under CC BY 4.0. | |
Printed Signage Market Analysis by Mordor Intelligence
The printed signage market size is projected to expand from USD 42.53 billion in 2025 and USD 43.63 billion in 2026 to USD 49.58 billion by 2031, registering a 2.59% CAGR between 2026 to 2031. Interest in sustainability is redefining procurement priorities, nudging buyers toward UV-curable and latex systems that eliminate hazardous air pollutants while still undercutting the total installed cost of digital screens by 60-70%. Retailers, e-commerce fulfillment centers, and pop-up venues continue to anchor demand for short-run, custom graphics even as outdoor-advertising bans in several European historic districts remove legacy billboard inventory. Advances in water-based and solvent-free formulations are broadening substrate compatibility to include textiles, floor films, and wood, helping vendors counter the gradual incursion of LED video walls into transportation hubs. Competitive intensity is shifting from raw throughput to ecosystem stickiness, with leading suppliers bundling hardware, inks, workflow software, and carbon footprint calculators to satisfy environmental, social, and governance (ESG) reporting mandates.
Key Report Takeaways
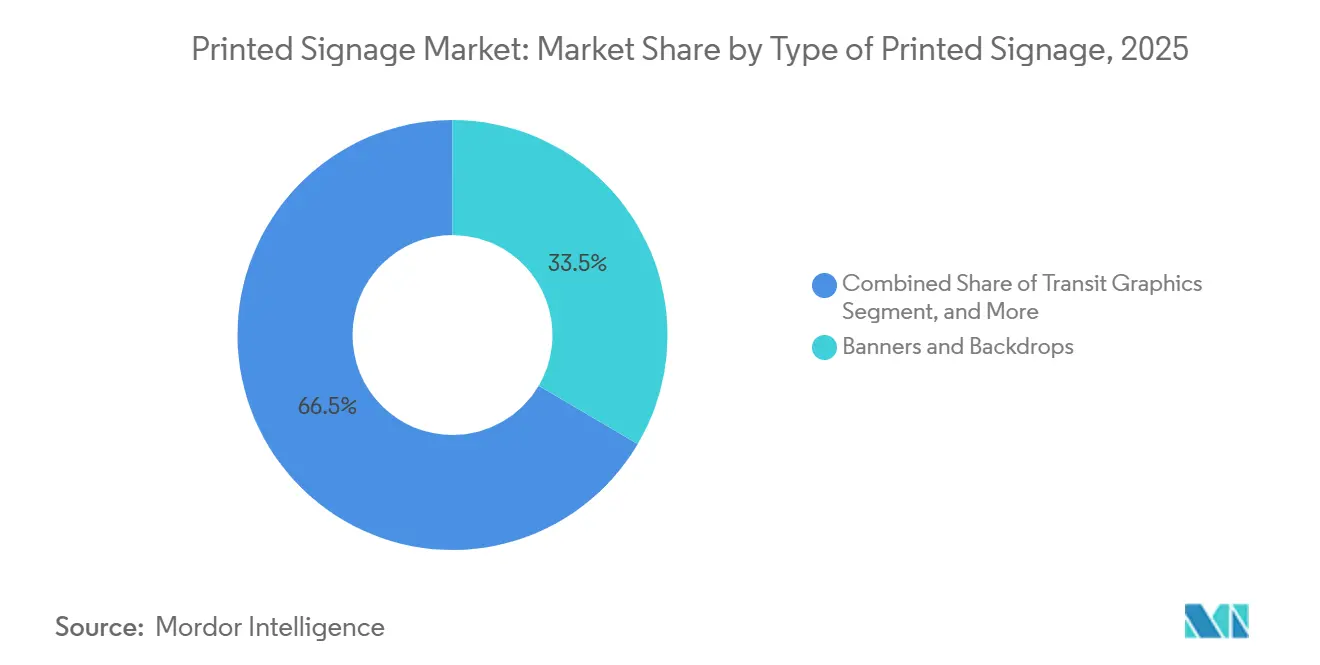
- By type of printed signage, banners and backdrops accounted for 33.46% of the printed signage market share in 2025, whereas transit graphics are forecast to grow at a 4.27% CAGR between 2026 and 2031.
- By print technology, inkjet captured 58.91% of the printed signage market share in 2025, yet UV inkjet is projected to grow at a 3.89% CAGR through 2031.
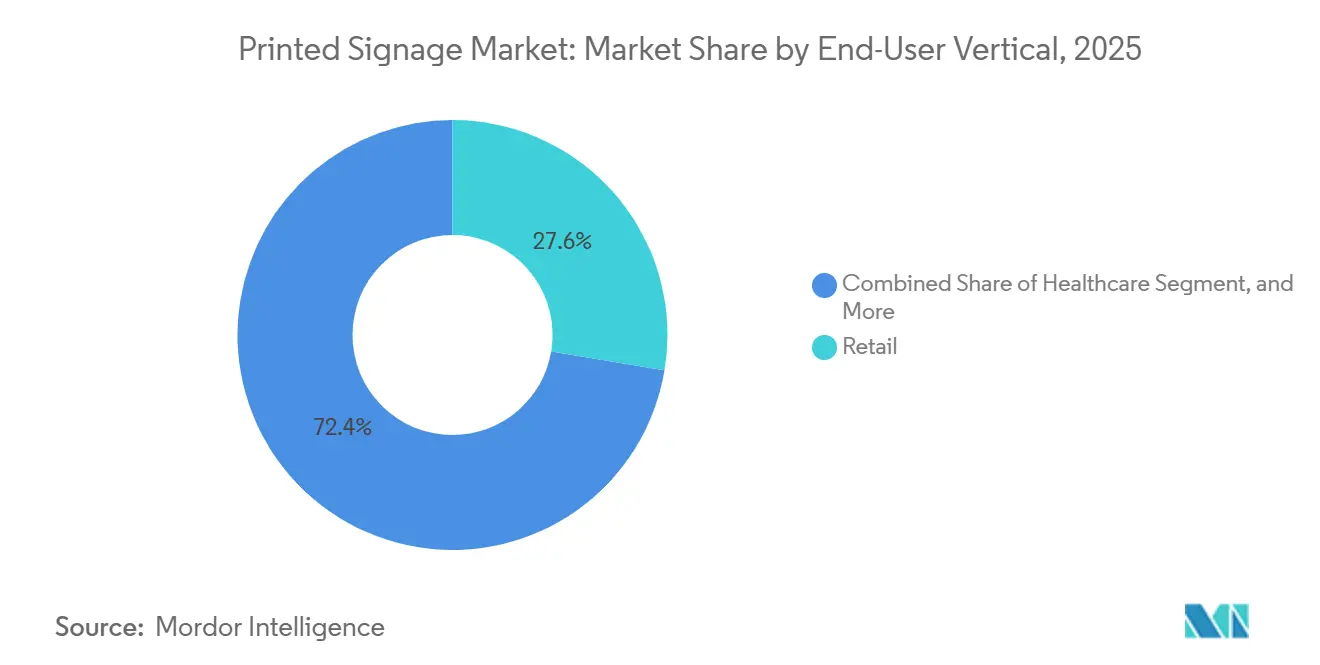
- By end user, retail accounted for 27.63% of spending in 2025, and healthcare is poised to record a 4.22% CAGR over the same forecast window.
- By application, outdoor signage represented 62.34% of 2025 installations, while indoor signage is on track for a 3.93% CAGR through 2031.
- By geography, Asia Pacific led with 38.71% of the printed signage market share in 2025, while Africa is advancing at a 3.63% CAGR through 2031.
Note: Market size and forecast figures in this report are generated using Mordor Intelligence’s proprietary estimation framework, updated with the latest available data and insights as of 2026.
Global Printed Signage Market Trends and Insights
Drivers Impact Analysis*
| Driver | (~) % Impact on CAGR Forecast | Geographic Relevance | Impact Timeline |
|---|---|---|---|
| Cost-effectiveness versus digital screens | +0.6% | Global, stronger uptake in South America and Africa | Medium term (2-4 years) |
| Retailers' sustained spend on visual merchandising | +0.5% | North America and Europe, expanding to Asia Pacific | Short term (≤ 2 years) |
| Advances in UV and latex eco-inks | +0.4% | Global, led by Europe and North America | Long term (≥ 4 years) |
| Custom short-run demand from e-commerce and pop-ups | +0.3% | North America and Asia Pacific e-commerce hubs | Short term (≤ 2 years) |
| Mandatory multi-language safety labels | +0.2% | Asia Pacific core, spill-over to Middle East manufacturing zones | Medium term (2-4 years) |
| Carbon-neutral substrates for ESG procurement | +0.2% | Europe and North America, early adoption in Australia and New Zealand | Long term (≥ 4 years) |
| Source: Mordor Intelligence | |||
Cost-Effectiveness Versus Digital Screens
Printed signage maintains procurement and operating costs 60-70% lower than comparable LED or LCD panels, a gap that widens when continuous power consumption and content-management infrastructure are factored in. A typical 55-inch digital display draws 150-300 watts, while a printed banner incurs no post-installation energy expense. This economic reality confines large digital networks to airports and premium malls, leaving small retailers and quick-service restaurants to refresh printed menu boards on weekly or monthly cycles without the hardware premium. Manufacturers are targeting this value pocket: the DesignJet Z6dr enables same-day point-of-purchase (PoP) production on 44-inch rolls, bypassing the complex programming required for digital screens.[1]HP Inc., “HP DesignJet Z6dr PostScript Printer,” HP.COM
Retailers' Sustained Spend on Visual Merchandising
Experiential in-store design continues to differentiate physical retail from pure-play e-commerce, and printed graphics remain at the core of that strategy. A 2025 McKinsey survey showed that retailers allocate 3-5% of renovation budgets to signage, window clings, and floor decals that create immersive journeys. Pop-up concepts rely on 48-hour production cycles for high-impact visuals, a speed digital integrators struggle to match once hardware provisioning and IT compliance reviews are added. Bubble-free, air-release films such as MPI 3000 shorten installation windows, enabling fashion brands to refresh every 4-6 weeks without specialist crews.[2]Avery Dennison Corporation, “MPI 3000 Series Films and Carbon Footprint Calculator,” AVERYDENNISON.COM Omnichannel fulfillment centers also require clear wayfinding and safety graphics, a new growth pocket as e-commerce logistics proliferate.
Advances in UV and Latex Eco-Inks
Water-based latex and LED-cured UV inks have eliminated volatile organic compounds (VOCs), sidestepping ventilation permits and allowing immediate indoor installation. HP’s Latex 2700 line cures by heat rather than solvent evaporation, so window graphics can be mounted in hospitals or schools the same day without odor concerns. The SureColor V7000 prints metallic and white layers directly onto acrylic, glass, or wood, expanding into architectural signage once monopolized by screen printing.[3]Seiko Epson Corporation, “SureColor V7000 UV Printer Product Information,” EPSON.COM Carbon-footprint calculators embedded in substrate portals now quantify Scope 3 emissions, giving corporate buyers data to satisfy ESG audits.
Custom Short-Run Demand from E-Commerce and Pop-Ups
Direct-to-consumer brands often demand 50 unique posters rather than 500 identical ones, pushing run lengths below the economic threshold of offset lithography. Canon’s imageFORCE C7165 meets this niche with inline finishing and variable-data prints that personalize store-level graphics at industrial speed. North American and Asian fulfillment centers have doubled since 2020, each requiring localized safety labels that comply with ISO 7010 pictogram standards. Event marketers also leverage on-demand production to avoid inventory and accelerate design changes, favoring agile print shops over rigid digital-signage networks.
Restraints Impact Analysis*
| Restraint | (~) % Impact on CAGR Forecast | Geographic Relevance | Impact Timeline |
|---|---|---|---|
| Cannibalization by digital signage networks | -0.4% | North America and Europe high-traffic venues, Asia Pacific metros | Medium term (2-4 years) |
| Rising PVC and aluminium composite prices | -0.3% | Global, acute in Europe and North America | Short term (≤ 2 years) |
| Waste-disposal compliance for solvent prints | -0.2% | Europe and North America, emerging in Australia and Japan | Long term (≥ 4 years) |
| Restrictive outdoor advertising bans | -0.1% | Europe, especially Switzerland, France, and Italy | Long term (≥ 4 years) |
| Source: Mordor Intelligence | |||
Cannibalization by Digital Signage Networks
Programmatic advertising income now underwrites high-density LED walls in transportation hubs, premium malls, and quick-service chains. North America added 12% more digital-out-of-home (DOOH) screens in 2025, concentrating in the top 50 metropolitan areas where audience measurement justifies the 3-5-times hardware premium. Printed billboards in these corridors face declining occupancy, prompting operators to discount static inventory or convert to digital. Yet, outside premium zones, rural highways, secondary retail strips, and emerging markets, electric grid constraints maintain a protective moat for the printed signage market.
Rising PVC and Aluminium Composite Prices
Vinyl and aluminium composite panels (ACP) saw price spikes of 15-20% in 2025, driven by energy volatility and ongoing tariff regimes in North America and Europe. Margins on fixed-price fabrication contracts narrowed, and some shops shifted to corrugated plastic or paperboard, although these substitutes rarely match the outdoor durability of PVC or ACP. The trend is hastening uptake of UV-curable direct-to-substrate workflows that skip laminated overlays, but the initial capital outlay in printheads and curing units remains a hurdle for small enterprises.
*Our forecasts treat driver/restraint impacts as directional, not additive. The impact forecasts reflect baseline growth, mix effects, and variable interactions.
Segment Analysis
By Type of Printed Signage: Transit Graphics Emerge as Growth Beacon
The printed signage market for banners and backdrops remained the largest at USD 14.23 billion in 2025, accounting for 33.46% of the total value. Transit graphics vehicle wraps on delivery vans, buses, and ride-hailing fleets are accelerating at a 4.27% CAGR through 2031 as advertisers pivot to mobile assets that bypass static billboard bans. Ink improvements, such as TrueVIS TR2, enable wraps to withstand five years of outdoor exposure without lamination, shaving 15-20% off material costs.
Fleet electrification supports this trend: smoother body panels simplify installation, and corporate ESG reports now highlight wraps as lower-carbon alternatives to backlit billboards. Backlit displays are gradually ceding high-traffic territories to LED video walls, but still serve secondary transit corridors where power supply is constrained. Point-of-purchase displays retain day-to-day importance in retail, especially with corrugated and foamboard substrates that can be turned around in 24 hours. Floor and window graphics benefit from air-release adhesives that allow non-specialists to apply and remove visuals during overnight store resets.


By Print Technology: UV-Inkjet Widens Substrate Frontier
Ink-jet output accounted for 58.91% of total printed square footage in 2025, underscoring its reliability across banners, posters, and soft signage. The printed signage market share for UV-inkjet is projected to grow at a 3.89% CAGR, driven by its ability to print white, metallic, and embossed textures onto acrylic, wood, and glass. The SureColor V7000’s ten-color configuration expands gamut while removing primer steps, reducing cycle times for architectural signage.
Screen and offset lithography maintain niche relevance for very long runs where per-unit costs still undercut digital. However, declining average run lengths, combined with SKU proliferation, pull work toward digital toner and hybrid UV systems that integrate workflow software for variable data. HP’s Latex 2700 underscores the environmental argument, curing odorless prints that can be installed in occupied healthcare or education facilities the same day. Roland DG’s D-EA2 outdoor ink further compresses the total cost of ownership by eliminating lamination, a key for budget-sensitive print shops serving regional fleets.
By End-User Vertical: Healthcare Wayfinding Accelerates
Retail contributed 27.63% of 2025 revenue, yet hospitals and clinics are expected to deliver the fastest 4.22% CAGR to 2031 as new construction and remodeling comply with the Americans with Disabilities Act and ISO 7010. Investments include high-contrast corridor maps, tactile door signs, and color-coded department identifiers that guide patients efficiently. E-commerce logistics hubs are another bright spot, demanding aisle markers and safety labels in multiple languages to serve diverse workforces.
Fleet operators within transportation and logistics lean on vehicle wraps to create rolling billboards, while banking and financial service branches refresh corporate graphics in support of omni-channel strategies. Government agencies procure signage for transit infrastructure that adheres to strict accessibility standards. Entertainment and sports venues integrate printed event branding with digital overlays, but budget allocations still favor durable vinyl for concourses and back-of-house areas.
By Application: Indoor Signage Gains Momentum
Outdoor applications controlled 62.34% of 2025 installs, buttressed by building wraps, roadside billboards, and transit shelters that require weather-resistant substrates. Indoor applications, however, are on track for a 3.93% CAGR, driven by corporate hybrid-workspace reconfigurations and immersive retail displays. Companies replace static office directories with modular panels that adapt to ongoing seating rotations, while retailers deploy floor decals and murals to orchestrate customer journeys.
Municipal bans in European heritage districts are shrinking outdoor inventory, nudging advertisers toward interior assets or mobiles such as vehicle wraps. Latex and LED-cured inks underpin the indoor surge, permitting same-day installation without VOCs. Designers now specify printed wood, textile, and acrylic elements in brand guidelines, blurring the line between signage and decor. Healthcare projects amplify the indoor dynamic, demanding sterilizable, slip-resistant graphics in surgical centers and outpatient wings.
Geography Analysis
Asia Pacific accounted for 38.71% of global revenue in 2025, buoyed by manufacturing, infrastructure expansions, and multi-language safety mandates across China, India, Vietnam, and Indonesia. Port upgrades and industrial corridors require wayfinding, hazard labels, and compliance decals in English, Mandarin, and local languages, lifting demand for on-demand digital printers. Roland DG’s 2025 decision to establish a fully owned subsidiary in India underscores confidence in rising domestic volumes. Japan and South Korea continue to refine high-mix, short-run models using UV-inkjet, while Australia invests in experiential retail and corporate graphics.
Africa is forecast to log the fastest CAGR of 3.63% from 2026-2031, as continental free-trade initiatives catalyze port modernization, rail connectivity, and the development of special economic zones. The African Development Bank documented USD 68 billion in annual infrastructure needs in 2024, 40% of which were earmarked for transport, translating into substantial signage procurement. South Africa remains the largest national market, but Nigeria, Kenya, and Egypt are closing the gap with event, retail, and logistics graphics.
Europe faces structural headwinds from billboard bans in historic precincts, with Swiss municipalities leading policy adoption. Print service providers are therefore pivoting to peri-urban and highway corridors. Sustainability imperatives also dominate procurement, encouraging adoption of take-back programs and carbon calculators that clarify Scope 3 metrics. Central and Eastern Europe capture spillover as manufacturers relocate from higher-cost Western regions.
North America shows steady replacement cycles in healthcare wayfinding and vehicle wraps, as electrified fleets search for brand canvases that travel. The United States Department of Veterans Affairs specifications for tactile hospital signage further stimulate domestic demand. South America and the Middle East are smaller but strategically important, especially Brazil’s retail corridor and Gulf Cooperation Council megaprojects that require bilingual or trilingual wayfinding.

Competitive Landscape
The printed signage market remains highly fragmented, with no vendor exceeding a 10% share of revenue. Hardware leaders HP, Canon, Epson, Roland DG, and Mimaki differentiate through ink chemistry and workflow software that together lower per-print costs. Material specialists 3M, Avery Dennison, Orafol, and Lintec compete on film durability, adhesive innovations, and integrated ESG reporting. The battleground is shifting from speeds and feeds to platform ecosystems that bundle financing, training, and consumables.
White-space opportunities exist in direct-to-substrate UV printing for interior architecture, where skipping vinyl overlays cuts labor and expands creative surface treatments. Epson’s SureColor V7000 and Roland DG’s VersaOBJECT flatbeds target this niche. Software automation is another disruptor; online portals now route orders directly into production queues, reducing human touchpoints and enabling next-day fulfillment even for variable-data jobs. Patent filings in 2024-2025 from Canon, HP, and Epson focus on droplet optimization and rapid LED curing, locking in differentiation for the mid-term.
Material inflation remains a risk factor, but vendors are mitigating it through thinner, higher-opacity films that maintain outdoor durability while reducing resin consumption. Carbon-neutral product lines are gaining traction among Fortune 500 procurement teams that incorporate Scope 3 criteria into supplier evaluations. Overall, competitive strategies hinge on lowering the total cost of ownership and aligning product portfolios with increasingly stringent environmental regulations.
Printed Signage Industry Leaders
3M Company
Avery Dennison Corp.
HP Inc.
Canon Inc.
Seiko Epson Corp.
- *Disclaimer: Major Players sorted in no particular order

Recent Industry Developments
- January 2026: Epson Corporation unveiled the SureColor F10070H Plus, a 64-inch dye-sublimation unit offering 15% higher throughput and integrated waste-ink recycling, targeting growth segments in soft signage and sports apparel.
- October 2025: Roland DG Corporation formed a wholly owned Indian subsidiary to deepen sales and service reach across organized retail, e-commerce logistics, and manufacturing hubs.
- September 2025: Roland DG introduced the DIMENSE DA-640, a 64-inch direct-to-apparel printer with inline pretreatment, designed for textile and soft-signage applications.
- August 2025: Roland DG released the VersaOBJECT MO-180 flatbed UV system capable of 7.1-inch thick substrates, opening opportunities in promotional items and 3-D signage.


Global Printed Signage Market Report Scope
The Printed Signage Market Report is Segmented by Type of Printed Signage (Banners and Backdrops, Corporate Graphics, Exhibitions and Trade Shows, Back-lit Displays, Point-of-Purchase (PoP) Displays, Billboards, Transit Graphics, Floor Graphics, Window Graphics), Print Technology (Screen, Ink-jet, UV-inkjet, Sheet-fed, Offset Lithography, Digital Toner / Electrophotography), End-user Vertical (BFSI, Retail, Transportation and Logistics, Healthcare, Food and Beverage, Education, Entertainment and Sports Venues, Government and Public Sector), Application (Indoor, and Outdoor), and Geography (North America, South America, Europe, Asia Pacific, Middle East, Africa). The Market Forecasts are Provided in Terms of Value (USD).
By Type of Printed Signage
| Banners and Backdrops |
| Corporate Graphics, Exhibitions and Trade Shows |
| Back-lit Displays |
| Point-of-Purchase (PoP) Displays |
| Billboards |
| Transit Graphics |
| Floor Graphics |
| Window Graphics |
By Print Technology
| Screen |
| Ink-jet |
| UV-inkjet |
| Sheet-fed |
| Offset Lithography |
| Digital Toner / Electrophotography |
By End-user Vertical
| BFSI |
| Retail |
| Transportation and Logistics |
| Healthcare |
| Food and Beverage |
| Education |
| Entertainment and Sports Venues |
| Government and Public Sector |
By Application
| Indoor |
| Outdoor |
By Geography
| North America | United States | |
| Canada | ||
| Mexico | ||
| South America | Brazil | |
| Argentina | ||
| Rest of South America | ||
| Europe | United Kingdom | |
| Germany | ||
| France | ||
| Italy | ||
| Rest of Europe | ||
| Asia Pacific | China | |
| Japan | ||
| India | ||
| South Korea | ||
| Rest of Asia Pacific | ||
| Middle East and Africa | Middle East | United Arab Emirates |
| Saudi Arabia | ||
| Rest of Middle East | ||
| Africa | South Africa | |
| Egypt | ||
| Rest of Africa | ||
| By Type of Printed Signage | Banners and Backdrops | ||
| Corporate Graphics, Exhibitions and Trade Shows | |||
| Back-lit Displays | |||
| Point-of-Purchase (PoP) Displays | |||
| Billboards | |||
| Transit Graphics | |||
| Floor Graphics | |||
| Window Graphics | |||
| By Print Technology | Screen | ||
| Ink-jet | |||
| UV-inkjet | |||
| Sheet-fed | |||
| Offset Lithography | |||
| Digital Toner / Electrophotography | |||
| By End-user Vertical | BFSI | ||
| Retail | |||
| Transportation and Logistics | |||
| Healthcare | |||
| Food and Beverage | |||
| Education | |||
| Entertainment and Sports Venues | |||
| Government and Public Sector | |||
| By Application | Indoor | ||
| Outdoor | |||
| By Geography | North America | United States | |
| Canada | |||
| Mexico | |||
| South America | Brazil | ||
| Argentina | |||
| Rest of South America | |||
| Europe | United Kingdom | ||
| Germany | |||
| France | |||
| Italy | |||
| Rest of Europe | |||
| Asia Pacific | China | ||
| Japan | |||
| India | |||
| South Korea | |||
| Rest of Asia Pacific | |||
| Middle East and Africa | Middle East | United Arab Emirates | |
| Saudi Arabia | |||
| Rest of Middle East | |||
| Africa | South Africa | ||
| Egypt | |||
| Rest of Africa | |||


Key Questions Answered in the Report
What is the projected value of the printed signage market by 2031?
The sector is forecast to reach USD 49.58 billion by 2031.
Which region leads current revenue?
Asia Pacific held 38.71% of global revenue in 2025.
Which application is growing fastest?
Indoor signage is projected to rise at a 3.93% CAGR through 2031 as hybrid workspaces and experiential retail expand.
Why are UV-inkjet systems gaining share?
They print directly on diverse substrates without VOCs, meeting stringent environmental rules while reducing finishing steps.
How do printed wraps compare with digital billboards on cost?
Vehicle wraps can be 60-70% less expensive up front and carry no ongoing power costs, making them attractive for fleet branding.
What factor most restrains growth?
Digital signage continues to displace static formats in high-traffic venues, trimming demand in premium corridors.
Page last updated on:


