
Market Overview
| Study Period | 2021 - 2031 |
|---|---|
| Market Size (2026) | USD 7.11 Billion |
| Market Size (2031) | USD 11.27 Billion |
| Growth Rate (2026 - 2031) | 9.67 % |
| Fastest Growing Market | Asia Pacific |
| Largest Market | Europe |
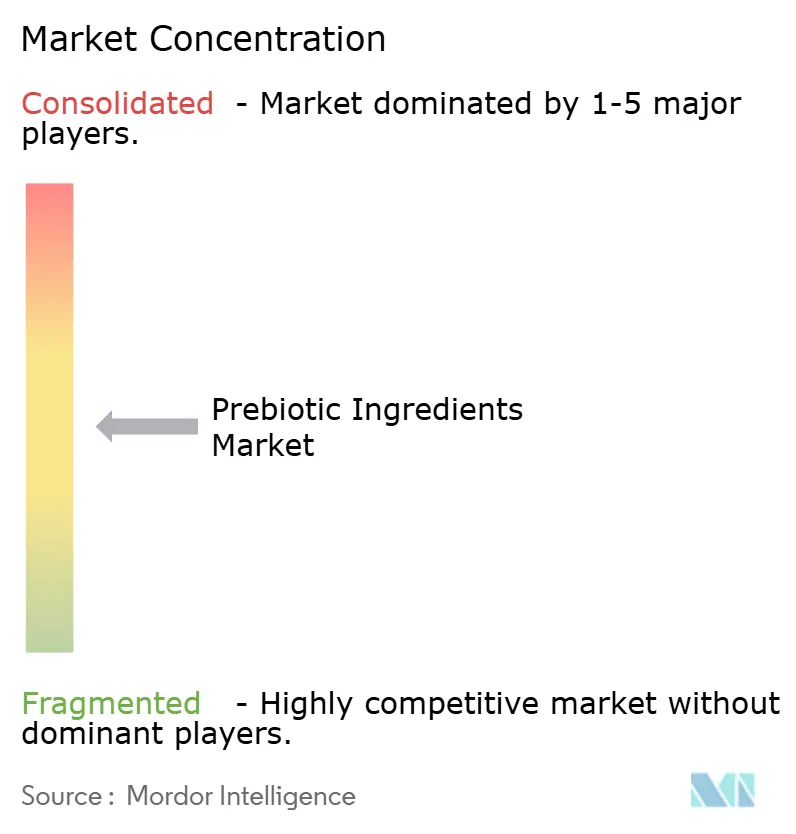
| Market Concentration | Medium |
Major Players *Disclaimer: Major Players sorted in no particular order Image © Mordor Intelligence. Reuse requires attribution under CC BY 4.0. | |
Prebiotic Ingredients Market Analysis by Mordor Intelligence
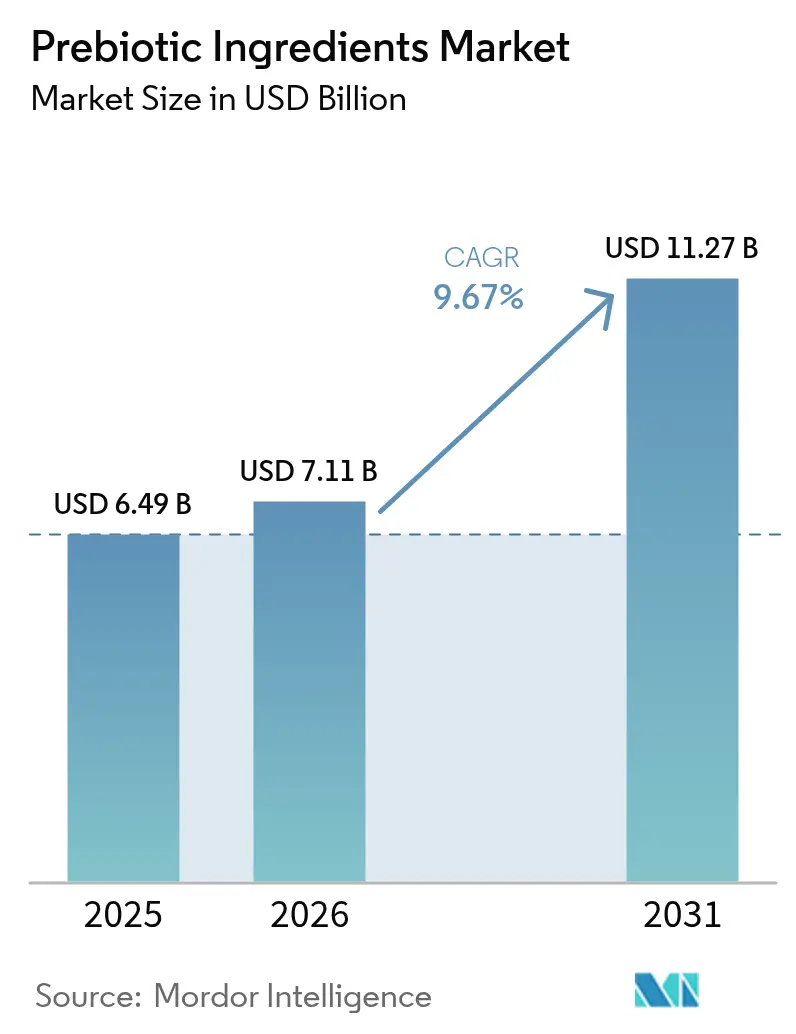
The prebiotic ingredients market size is projected to expand from USD 6.49 billion in 2025 and USD 7.11 billion in 2026 to USD 11.27 billion by 2031, registering a CAGR of 9.67% between 2026 to 2031. Rising penetration of clean-label supplements, tighter regulatory pathways that favor proven oligosaccharides, and diversification of chicory and dairy-whey supply underpin this trajectory. Ingredient suppliers are prioritizing botanical provenance to meet retailer mandates, while beverage manufacturers are adopting liquid concentrates that reduce mixing time and improve label clarity. Vertically integrated dairy cooperatives monetize whey streams to create galacto-oligosaccharides, and precision-fermentation startups position human-milk oligosaccharides for ultra-premium infant formula. Supply-chain resilience remains a strategic imperative amid drought-related chicory shortages and energy-intensive spray-drying, which are inflating costs.
Key Report Takeaways
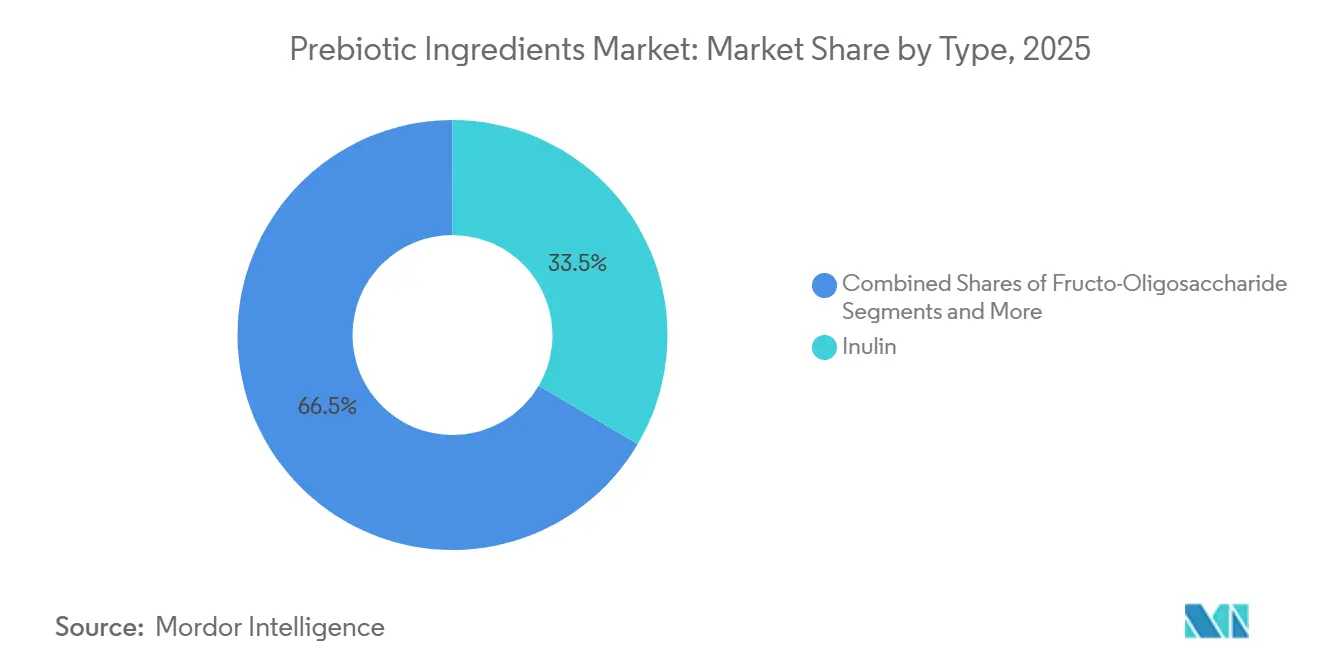
- By type, inulin captured a 33.46% share in 2025, while galacto-oligosaccharides are expected to grow the fastest at an 11.59% CAGR to 2031.
- By source, plant-based inputs dominated with 69.75% of sales in 2025 and are also projected to post the quickest expansion at a 10.67% CAGR through 2031.
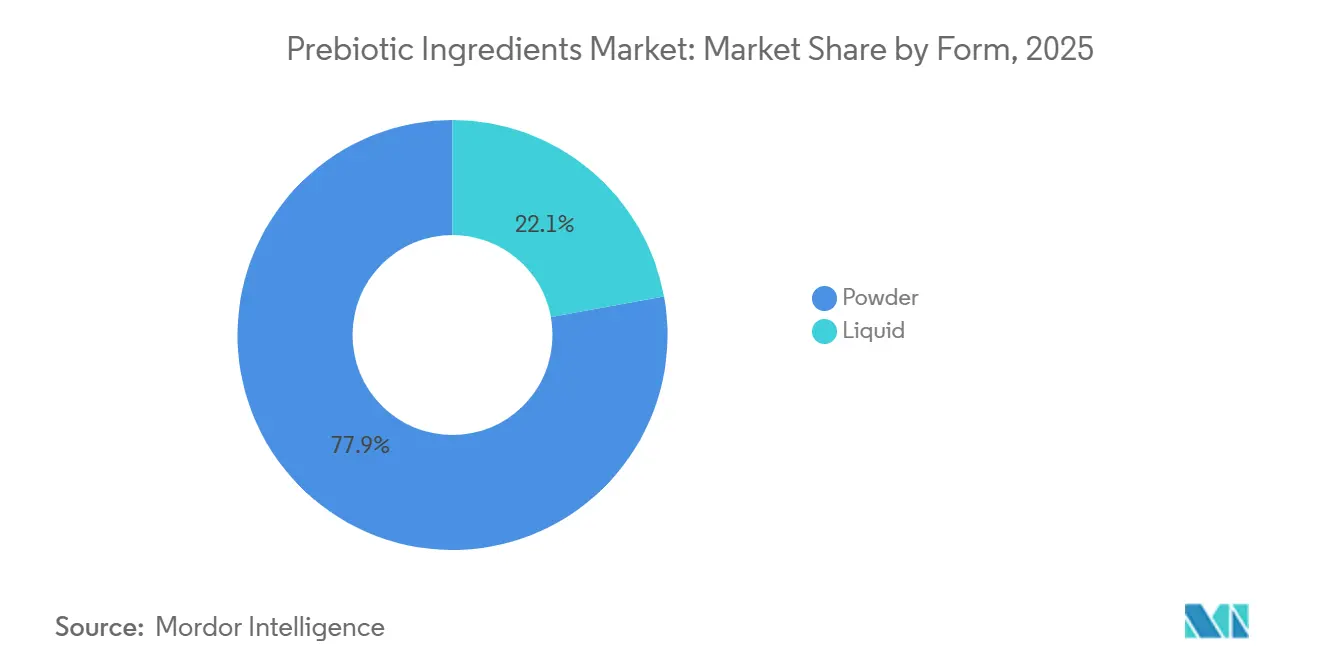
- By form, powders led with 77.87% of 2025 volume, whereas liquid concentrates are forecast to advance at an 11.10% CAGR through 2031.
- By application, functional foods and beverages accounted for 42.92% of demand in 2025, while dietary supplements are slated to expand the fastest at a 12.51% CAGR to 2031.
- By region, Europe accounted for 30.58% of global sales in 2025, whereas Asia-Pacific is on track for the fastest growth with an 11.17% CAGR between 2026 and 2031.
Note: Market size and forecast figures in this report are generated using Mordor Intelligence’s proprietary estimation framework, updated with the latest available data and insights as of 2026.
Market Trends and Insights
Drivers Impact Analysis of Prebiotic Ingredients Market*
| Drivers | (~)% Impact on CAGR Forecasts | Geographic Relevance | Impact Timeline |
|---|---|---|---|
| Expansion of the global dietary supplements market | +2.1% | Global, with concentration in North America and Europe | Medium term (2-4 years) |
| Rising demand for natural and plant-based functional ingredients | +1.8% | Global, led by North America, Europe, and urban APAC markets | Long term (≥ 4 years) |
| Increasing use of prebiotics in functional food and beverage products | +1.5% | Global, with early adoption in Europe and North America | Medium term (2-4 years) |
| Growing scientific validation of microbiome health benefits | +1.3% | Global, with research concentration in North America and Europe | Long term (≥ 4 years) |
| Increasing incorporation of prebiotics in fiber enrichment and gut health reformulation | +1.2% | North America, Europe, and APAC urban centers | Short term (≤ 2 years) |
| Growth of infant nutrition and clinical nutrition sectors | +1.7% | APAC core (China, India), with spillover to MEA and South America | Medium term (2-4 years) |
| Source: Mordor Intelligence | |||
Expansion of the Global Dietary Supplements Market
The dietary supplements industry is expanding at 8.9% annually, and prebiotics are capturing a disproportionate share of formulation budgets as brands pivot from single-strain probiotics to synbiotic blends that combine live cultures with fermentable fibers, according to the Council for Responsible Nutrition[1]Source: Council for Responsible Nutrition, “Dietary Supplements Market,” CRN, crnusa.org . Capsule and tablet formats accounted for 68% of prebiotic supplement sales in 2025, reflecting consumer preference for dosage precision and shelf stability over powders that require reconstitution. Regulatory clarity in the United States, where the FDA granted GRAS status to chicory-root inulin in 2018 and subsequently to galacto-oligosaccharides in 2024, has enabled brands to make structure-function claims without pre-market approval, a streamlined pathway that accelerated product launches by an estimated 14 months compared to novel-food routes in the European Union. E-commerce channels drove 41% of supplement sales in North America in 2025, and direct-to-consumer brands are leveraging prebiotic positioning to differentiate from legacy multivitamin portfolios, with average retail prices for prebiotic-fortified products commanding a 23% premium over non-fortified equivalents. The shift toward personalized nutrition is creating demand for targeted oligosaccharide blends tailored to specific microbiome profiles, a trend that favors ingredient suppliers with analytical capabilities to validate bifidogenic and butyrogenic effects through in vitro fermentation assays.
Rising Demand for Natural and Plant-Based Functional Ingredients
Plant-based sources captured 69.75% of the prebiotic ingredients market in 2025, driven by clean-label mandates from retailers such as Whole Foods Market and Tesco, which require suppliers to disclose extraction solvents and processing aids on technical data sheets. Chicory-root inulin and agave-derived fructans are displacing synthetic fructo-oligosaccharides in premium formulations, as consumers associate botanical origins with lower processing intensity, even though enzymatic synthesis from sucrose can achieve identical molecular structures. Organic certification added USD 0.40 to USD 0.60 per kilogram to ingredient costs in 2025, yet brands targeting Whole30 and paleo demographics absorbed these premiums to maintain positioning. The European Union's Farm to Fork strategy, updated in 2024, set a target for 25% of agricultural land to be under organic management by 2030, a policy that is incentivizing chicory growers in Belgium and the Netherlands to transition acreage and secure long-term contracts with inulin processors[2]Source: European Commission, “Farm to Fork Strategy,” European Commission, ec.europa.eu. Non-GMO Project verification became a de facto requirement for U.S. market entry in 2025, with 78% of surveyed brands indicating they would not source ingredients lacking third-party verification, a threshold that disadvantages suppliers relying on genetically modified chicory varieties developed for higher inulin yields.
Increasing Use of Prebiotics in Functional Food and Beverage Products
Functional food and beverage applications accounted for 42.92% of prebiotic demand in 2025, with bakery and dairy categories leading adoption due to their compatibility with powder formats that disperse readily in dough and yogurt matrices. Yogurt manufacturers in Europe incorporated an average of 2.8 grams of inulin per 150-gram serving in 2025, a dosage sufficient to carry "source of fiber" claims under EU Regulation 1924/2006 while avoiding the laxative effects associated with doses exceeding 10 grams per day, according to the EFSA. Beverage formulators are gravitating toward short-chain fructo-oligosaccharides with degree-of-polymerization values below 10, as these variants exhibit superior solubility in cold-fill processes and do not precipitate during pasteurization, a technical advantage that reduces production downtime by an estimated 12% compared to long-chain inulin. The U.S. Food and Drug Administration's 2024 update to its definition of dietary fiber, which now includes non-digestible carbohydrates with demonstrated physiological benefits, has enabled brands to front-of-pack fiber claims for products fortified with galacto-oligosaccharides and resistant maltodextrin, a labeling change that correlates with 19% higher purchase intent in consumer testing. Taste masking remains a constraint, as inulin concentrations above 4% impart a chalky mouthfeel that negatively impacts sensory scores, prompting formulators to blend short- and long-chain variants to balance fiber content with organoleptic acceptability.
Growing Scientific Validation of Microbiome Health Benefits
Peer-reviewed publications on prebiotic mechanisms increased by 34% between 2023 and 2025, with meta-analyses demonstrating that daily intake of 5 grams to 10 grams of galacto-oligosaccharides significantly increased fecal bifidobacteria counts and reduced markers of systemic inflammation in adults with metabolic syndrome, according to Nature Reviews Gastroenterology and Hepatology. The International Scientific Association for Probiotics and Prebiotics updated its consensus definition in 2024 to require evidence of selective fermentation by beneficial microbes, a standard that excluded resistant starches and polydextrose from the prebiotic category and concentrated research and development investment on oligosaccharides with validated bifidogenic effects[3]Source: International Scientific Association for Probiotics and Prebiotics, “Consensus Statement,” ISAPP, isappscience.org . Clinical trials registered on ClinicalTrials.gov in 2025 included 47 studies evaluating prebiotics for indications ranging from irritable bowel syndrome to cognitive function, reflecting pharmaceutical interest in microbiome modulation as an adjunct to conventional therapies. The European Food Safety Authority approved 2 new health claims for chicory inulin in 2025, linking regular consumption to improved bowel function and enhanced calcium absorption, claims that enable on-pack messaging in the European Union and create competitive pressure for suppliers of fructo-oligosaccharides and galacto-oligosaccharides to generate equivalent dossiers. Mechanistic research published in Cell Host and Microbe in 2024 identified specific bacterial taxa that metabolize mannan-oligosaccharides into short-chain fatty acids with anti-inflammatory properties, findings that are informing next-generation formulations targeting immune health rather than digestive wellness alone.
Restraints Impact Analysis of Prebiotic Ingredients Market*
| Restraints | (~)% Impact on CAGR Forecasts | Geographic Relevance | Impact Timeline |
|---|---|---|---|
| High production and processing costs | -1.4% | Global, with acute pressure in APAC and South America | Short term (≤ 2 years) |
| Limited consumer awareness in developing markets | -0.9% | APAC (excluding Japan, South Korea), MEA, and rural South America | Medium term (2-4 years) |
| Stringent regulatory frameworks and health claim restrictions | -1.1% | Europe and North America, with spillover to APAC | Long term (≥ 4 years) |
| Supply chain and raw material price volatility | -1.3% | Global, with concentration in Europe (chicory) and APAC (dairy whey) | Short term (≤ 2 years) |
| Source: Mordor Intelligence | |||
High Production and Processing Costs
Enzymatic synthesis of galacto-oligosaccharides from lactose requires β-galactosidase enzymes sourced from Aspergillus oryzae or Kluyveromyces lactis, inputs that added USD 1.50 to USD 2.20 per kilogram to production costs in 2025, compared to USD 0.80 to USD 1.20 per kilogram for acid-hydrolyzed inulin from chicory root. Downstream purification to remove residual lactose and monosaccharides demands chromatographic separation or nanofiltration, processes that consume 40% to 50% of total manufacturing costs and limit margin expansion for suppliers serving price-sensitive categories such as animal feed and bakery ingredients. Capital expenditure for a greenfield galacto-oligosaccharides plant with 5,000 metric tons annual capacity exceeded USD 18 million in 2025, a threshold that restricts market entry to established dairy cooperatives and specialty-ingredient houses with access to low-cost financing. Energy-intensive spray-drying to convert liquid concentrates into free-flowing powders added USD 0.30 to USD 0.50 per kilogram to production costs in 2025, prompting suppliers to offer liquid formats at discounted prices to beverage manufacturers with in-line dosing systems. Labor costs in Western Europe, where 60% of chicory-inulin production is concentrated, rose by 7.2% between 2024 and 2025, eroding competitiveness relative to emerging suppliers in Thailand and Brazil that benefit from lower wage structures but face quality-perception challenges in premium markets.
Limited Consumer Awareness in Developing Markets
Consumer surveys conducted in Indonesia, Nigeria, and Peru in 2025 revealed that fewer than 22% of respondents could differentiate between prebiotics and probiotics, a knowledge gap that constrains retail distribution outside pharmacy and specialty health channels. Educational campaigns require sustained investment, with industry estimates suggesting that achieving 50% aided awareness in a new market demands USD 2 million to USD 4 million in media spend over 24 months, a barrier for smaller brands lacking multinational scale. Retail penetration in modern trade channels such as supermarkets and hypermarkets reached only 18% in Sub-Saharan Africa in 2025, as traditional outlets lack cold-chain infrastructure for probiotic-prebiotic combination products and shelf space for dedicated gut-health sections. Language barriers complicate on-pack messaging, with regulatory requirements in India mandating ingredient declarations in 11 regional languages, a compliance burden that adds USD 0.02 to USD 0.04 per unit to labeling costs and delays product launches by 6 to 8 weeks. Healthcare practitioner endorsement remains the primary purchase driver in developing markets, yet fewer than 15% of general practitioners in surveyed APAC and MEA countries reported familiarity with prebiotic mechanisms in 2025, limiting prescription and recommendation rates.
*Our forecasts treat driver/restraint impacts as directional, not additive. The impact forecasts reflect baseline growth, mix effects, and variable interactions.
Prebiotic Ingredients Market Segment Analysis
By Type:
GOS Gains as Inulin Holds Dominant ShareInulin commanded 33.46% of the market in 2025, underpinned by established extraction infrastructure in Belgium, France, and the Netherlands that processes 180,000 metric tons of chicory root annually, yet galacto-oligosaccharides are forecast to expand at 11.59% CAGR through 2031, driven by infant-formula brands seeking EFSA-approved ingredients with documented bifidogenic effects and dairy processors monetizing whey streams through enzymatic conversion. Fructo-oligosaccharides benefit from cost advantages relative to galacto-oligosaccharides and compatibility with high-temperature processing in bakery applications, while mannan-oligosaccharides remain confined to animal-feed applications due to limited human-safety data and the absence of GRAS status in the United States. The "Others" category, encompassing xylo-oligosaccharides and resistant maltodextrin, with growth concentrated in Asia-Pacific markets, where local suppliers offer these variants at 20% to 30% discounts relative to imported inulin.
Regulatory dynamics are reshaping type preferences, as the European Food Safety Authority's 2025 rejection of health-claim applications for mannan-oligosaccharides redirected research and development investment toward galacto-oligosaccharides and fructo-oligosaccharides with established dossiers, a shift that correlates with a 14% decline in mannan-oligosaccharide patent filings between 2024 and 2025. Inulin's dominance is sustained by its dual functionality as a fat replacer and fiber source, attributes that enable formulators to achieve clean-label claims while reducing calorie density in dairy and bakery products. Galacto-oligosaccharides are gaining share in clinical-nutrition formulations targeting elderly populations, as randomized controlled trials published in 2024 demonstrated that daily intake of 8 grams improved bowel regularity and reduced antibiotic-associated diarrhea in hospitalized patients. Fructo-oligosaccharides face headwinds from negative consumer perceptions of "oligosaccharide" terminology, prompting brands to adopt "chicory root fiber" or "prebiotic fiber" on ingredient panels to enhance label appeal.



By Source:
Plant-Based Dominance Driven by Clean-Label MandatesPlant-based sources held 69.75% of the market in 2025 and are forecast to grow at 10.67% CAGR through 2031, reflecting consumer association of botanical origins with lower processing intensity and alignment with vegan and vegetarian dietary patterns. Chicory root remains the dominant feedstock for inulin extraction, with Belgium and France accounting for 55% of global chicory cultivation in 2025, yet agave and Jerusalem artichoke are emerging as alternative sources that offer geographic diversification and resilience to European drought conditions that reduced chicory yields by 12% in 2024. Dairy-based sources, primarily lactose-derived galacto-oligosaccharides, with growth concentrated in infant-formula applications where regulatory frameworks in the European Union and China mandate ingredients that mirror human-milk oligosaccharide profiles.
The European Union's Farm to Fork strategy, updated in 2024, set a target for 25% of agricultural land to be under organic management by 2030, a policy that is incentivizing chicory growers in Belgium and the Netherlands to transition acreage and secure long-term contracts with inulin processors at premiums of EUR 50 to EUR 80 per metric ton relative to conventional crops, according to the European Commission. Dairy-based galacto-oligosaccharides benefit from vertical integration opportunities, as whey is a low-value byproduct of cheese manufacturing, and enzymatic conversion into prebiotics adds USD 3.50 to USD 5.00 per kilogram of value, transforming a disposal cost into a revenue stream. Non-GMO Project verification became a de facto requirement for U.S. market entry in 2025, with 78% of surveyed brands indicating they would not source ingredients lacking third-party verification, a threshold that disadvantages suppliers relying on genetically modified chicory varieties developed for higher inulin yields. The "Others" category, encompassing seaweed-derived oligosaccharides and fungal sources, accounted for 3% of the market in 2025, with growth constrained by limited production scale and the absence of regulatory approvals in major markets.
By Form:
Powder Formats Lead Despite Liquid Concentrate GainsPowder formats represented 77.87% of volume in 2025, driven by superior shelf stability, lower transportation costs, and compatibility with capsule and tablet manufacturing processes that dominate dietary-supplement applications. Spray-drying remains the standard conversion method, consuming 1.2 to 1.5 kilowatt-hours per kilogram of finished powder and adding USD 0.30 to USD 0.50 per kilogram to production costs, yet the resulting free-flowing granules enable automated dosing in high-speed production lines and eliminate the cold-chain requirements associated with liquid concentrates. Liquid formats are forecast to expand at 11.10% CAGR through 2031, reflecting beverage manufacturers' preference for pre-dissolved ingredients that reduce mixing time by 40% to 50% and improve label clarity by avoiding anti-caking agents such as silicon dioxide that appear on ingredient panels of powdered variants.
Liquid galacto-oligosaccharides concentrates with 75% dry-matter content are gaining share in infant-formula manufacturing, as in-line dosing systems enable precise blending and reduce the risk of ingredient segregation that can occur with powdered formats during high-shear mixing. Powder formats dominate animal-feed applications, where bulk handling and extended storage periods favor ingredients with moisture content below 5%, a specification that liquid concentrates cannot meet without refrigeration. The shift toward liquid formats is most pronounced in functional beverages, where cold-fill processes and short production runs make the capital investment in spray-drying equipment uneconomical for brands producing fewer than 500,000 units annually. Regulatory frameworks in the European Union and United States do not differentiate between powder and liquid formats for labeling purposes, yet powder formats benefit from consumer perceptions of higher purity and longer shelf life, attributes that command 8% to 12% price premiums in retail channels.
By Application:
Dietary Supplements Outpace Functional FoodsFunctional food and beverage applications accounted for 42.92% of demand in 2025, yet dietary supplements are forecast to expand at 12.51% CAGR through 2031, signaling a strategic shift as formulators embed prebiotics into capsules and powders to bypass taste and texture challenges inherent in fortified foods. Infant formula and baby food with growth concentrated in China and India, where rising disposable incomes and regulatory liberalization are driving premiumization and enabling brands to incorporate galacto-oligosaccharides at 0.4 to 0.8 grams per 100 milliliters, dosages that align with European Food Safety Authority recommendations for bifidogenic effects. Animal feed accounted for 18% of demand in 2025, with mannan-oligosaccharides dominating this segment due to their immunomodulatory properties in poultry and swine, yet growth is constrained by price sensitivity and competition from antibiotic alternatives that offer faster weight-gain outcomes.
Dietary supplements are capturing share from functional foods as e-commerce channels enable direct-to-consumer brands to educate buyers on dosage precision and microbiome benefits without relying on in-store shelf space or retailer approvals, a distribution model that reduces time-to-market by 6 to 9 months compared to conventional retail launches. Capsule formats accounted for 68% of prebiotic supplement sales in 2025, reflecting consumer preference for dosage precision and shelf stability over powders that require reconstitution, and brands are leveraging delayed-release coatings to protect oligosaccharides from gastric acid and ensure delivery to the colon, a technical feature that commands 18% to 25% price premiums. Infant-formula applications face regulatory headwinds, as the U.S. Food and Drug Administration's 2024 guidance requires manufacturers to demonstrate safety through clinical trials that mirror breast-milk oligosaccharide profiles, a standard that effectively limits market entry to vertically integrated dairy cooperatives and specialty-ingredient houses. The "Others" category, encompassing clinical nutrition and pharmaceutical applications, accounted for 5% of demand in 2025, with growth driven by hospital formularies adopting prebiotic-enriched enteral feeds to reduce infection rates in critically ill patients.
Geography Analysis
Europe Prebiotic Ingredients Market
Europe accounted for 30.58% of the global prebiotics market in 2025, supported by well-established chicory-processing infrastructure in Belgium, France, and the Netherlands, which together supply approximately 55% of global inulin output. Germany represented 22% of European demand in 2025, driven by bakery and dairy manufacturers increasingly incorporating inulin as a fat replacer to meet front-of-pack nutritional targets. In contrast, the United Kingdom recorded a 3.2% contraction between 2024 and 2025, reflecting post-Brexit tariff increases on imported oligosaccharides that elevated ingredient costs by an estimated 8% to 12%. The European Food Safety Authority’s stringent health-claim requirements, particularly the need for randomized controlled trials demonstrating dose-response relationships, continue to create high entry barriers, favoring established ingredients with approved dossiers and concentrating innovation among multinational suppliers with strong regulatory capabilities. Meanwhile, Italy and Spain are emerging as growth pockets, evidenced by an increase in functional beverage launches containing short-chain fructo-oligosaccharides between 2024 and 2025.
APAC Prebiotic Ingredients Market
Asia-Pacific is forecast to be the fastest-growing region, expanding at an estimated 11.17% CAGR through 2031. Growth is underpinned by infant-formula premiumization in China, where the approval of six new galacto-oligosaccharide suppliers in 2024 intensified competition and reduced ingredient prices by 15% to 18%, enabling broader inclusion of prebiotics at clinically relevant dosages. India’s regulatory environment has also become more supportive following the Food Safety and Standards Authority’s 2024 update permitting structure-function claims for clinically validated prebiotics, accelerating product registrations by approximately 40% and attracting investment from global ingredient suppliers. Japan with growth concentrated in elderly-nutrition products targeting sarcopenia and immune health. Similar demographic-driven trends are emerging in South Korea and Taiwan. Australia recorded 12.3% growth between 2024 and 2025, largely driven by e-commerce expansion and wellness-focused marketing, although regulatory constraints continue to limit explicit on-pack claims. Southeast Asian markets, including Indonesia, Thailand, and Vietnam, remain underpenetrated, with consumer awareness below 25% in 2025, yet rising incomes and expanding modern retail channels are creating long-term opportunities for education-led brand strategies.
The Americas and MEA Prebiotic Ingredients Market
North America with the United States is being driven by dietary supplement manufacturers incorporating prebiotics into synbiotic formulations designed to enhance microbiome modulation. The U.S. Food and Drug Administration’s 2024 revision to the dietary fiber definition, recognizing non-digestible carbohydrates with demonstrated physiological benefits, has enabled stronger front-of-pack fiber claims and is associated with higher consumer purchase intent. Canada expanded by 9.8% between 2024 and 2025 following Health Canada’s approval of four new prebiotic health claims linked to bowel function and mineral absorption, supporting differentiation across dairy and cereal categories. Mexico represented 12% of regional demand, with growth centered on functional beverages featuring agave-derived fructans. South America led by Brazil, primarily driven by dairy applications aligned with public health initiatives. Argentina and Chile recorded strong momentum following regulatory approvals and innovation subsidies, although consumer awareness remains a limiting factor. The Middle East and Africa demand is concentrated in the United Arab Emirates, Saudi Arabia, and Turkey. While awareness levels remain low in several African markets, expanding middle-class populations and rising healthcare expenditures indicate favorable long-term growth prospects.


Regulatory Landscape
Regulation for prebiotic ingredients is anchored in food-safety authorization, with health claims tightly controlled. In the European Union, novel or newly produced oligosaccharides can require authorization under the Novel Food framework and entry onto the Union list, while on-pack health claims fall under Regulation (EC) No 1924/2006 and are assessed by EFSA. This framework tends to favor ingredients with robust dossiers and can slow adoption of newer categories when claims have been rejected or remain unapproved. In 2026, the European Commission authorized additional novel-food items relevant to the prebiotic space, including inulin-propionate ester (authorized under Implementing Regulation (EU) 2026/1219 with time-bound proprietary protection for the applicant) and other oligosaccharides on the Union list pathway, which increases the value of regulatory file ownership for premium applications.
In the United States, market access is typically supported by FDA GRAS conclusions based on scientific procedures, with FDA issuing “no questions” response letters to GRAS notices. This route supports use across conventional foods and supplements, while keeping claims within structure/function language that is substantiated. Recent GRAS activity has included multiple notifications around short-chain fructo-oligosaccharides (scFOS), with FDA response letters issued to suppliers in 2025 and updated submissions continuing into 2026 for expanded use cases, including infant formula in some notices. Canada adds further standardization through Health Canada’s Natural and Non-prescription Health Products Directorate (NNHPD), which manages a dedicated prebiotic monograph; it can help products position more consistently, but it also keeps expectations specific on dose, conditions of use, and permitted statements.
Value Chain Analysis
The prebiotic ingredients value chain begins with feedstock sourcing and conversion, then moves through purification and format finishing before reaching food, beverage, and supplement manufacturing. For plant-based prebiotics, key upstream inputs include chicory roots and other botanical carbohydrate sources. For dairy-based prebiotics, lactose-rich whey streams are used as inputs for enzymatic conversion into galacto-oligosaccharides. Midstream processing commonly includes extraction or enzymatic synthesis, membrane separation and/or ion exchange for purification, concentration via evaporation, and spray drying for powders, while liquid concentrates are increasingly supplied for beverage and infant-formula lines that use in-line dosing.
Downstream, prebiotic ingredients are sold either directly by large ingredient manufacturers or through specialized distributors such as IMCD, Brenntag, and Azelis. These ingredients are then incorporated into functional foods and beverages, infant nutrition, dietary supplements, and animal feed. Key bottlenecks include feedstock volatility, particularly weather-sensitive chicory crops, high purification costs for low-sugar and low-lactose specifications, and energy-intensive drying for powder formats. The market also shows selective vertical integration, including models where suppliers control the pathway from agricultural input to finished oligosaccharide, while others rely on contract processing and distribution partnerships to reach regional formulation hubs.
Competitive Landscape
The prebiotic ingredients market exhibits moderate concentration, characterized by a blend of established ingredient manufacturers and specialized prebiotic producers. Market leaders, including Tereos S.A., Ingredion Incorporated, Archer Daniels Midland Company, Kerry Group, and Cargill Incorporated, maintain competitive advantages through vertical integration, extensive distribution networks, and diversified product portfolios. These companies are increasingly focusing on prebiotic ingredients as strategic growth platforms.
The prebiotic market is experiencing increased innovation as manufacturers aim to differentiate their products in a competitive environment. Companies are developing proprietary prebiotic ingredients with targeted functional benefits. This market activity indicates the growing importance of prebiotics in mainstream consumer products and points to potential consolidation as larger companies establish positions in this expanding segment.
Companies are pouring significant resources into research and development to innovate new prebiotic ingredients or refine the existing ones. This effort encompasses sourcing prebiotics from unconventional plant-based materials, such as chicory root (a well-known source of inulin), and leveraging cutting-edge technologies to boost their efficacy and user-friendliness across diverse products. For instance, industry players are crafting prebiotics designed to blend effortlessly into functional foods and beverages, such as yogurts, snacks, and drinks, ensuring they uphold taste and texture, thus aligning with consumer desires for both health advantages and culinary pleasure.
Prebiotic Ingredients Industry Leaders
Archer Daniels Midland Company
Ingredion Inc.
Tereos Group
Cargill Inc.
Kerry Group
- *Disclaimer: Major Players sorted in no particular order
Prebiotic Ingredients Market Companies Covered in this Report
- Tereos S.A.
- Ingredion Incorporated
- Archer Daniels Midland Company
- Cargill Incorporated
- International Flavors & Fragrances Inc.
- Cosun Beet Company (Sensus B.V.)
- Kerry Group plc
- Cosucra Groupe Warcoing S.A.
- Roquette Frères S.A.
- Samyang Corporation
- Clasado Biosciences Ltd.
- AIDP Inc.
- Chr. Hansen A/S
- DSM-firmenich
- Südzucker Group
- Royal FrieslandCampina N.V.
- Nexira A/S
- Bunge Limited
- Prenexus Health
- Beghin Meiji S.A.

Market Opportunities and Future Outlook
Opportunities are increasingly tied to proprietary, clinically supported fibers and to novel-food authorizations that allow differentiation within functional categories where “fiber” claims can be harder to distinguish. In 2026, Ingredion’s acquisition of NutriLeads’ Benicaros prebiotic fiber business (including intellectual property and clinical data) underscores continued demand for branded, substantiated ingredients that can be positioned beyond generic “fiber” at low inclusion rates, which matters for supplements and functional beverages where taste and texture constraints are often more visible. In parallel, EU novel-food authorizations in 2026, including inulin-propionate ester under Commission Implementing Regulation (EU) 2026/1219 with time-bound proprietary protection for the applicant, point to a clearer pathway for next-generation prebiotics tied to defined physiological endpoints and protected regulatory dossiers.
Capacity and capability expansion in fermentation and carbohydrate processing also stands out, particularly where suppliers can deliver reliable output and consistent specifications for infant nutrition and premium wellness products. Fermentation-focused investments, including Novonesis’ agreement to acquire a production facility in Rayong, Thailand (USD 50 million) to strengthen fermentation capabilities including HMO production, and Galam’s new GOFOS production plant reaching full operation in early 2026 alongside prior investment to expand scFOS capacity, illustrate a shift toward scale and regional redundancy. These actions can broaden the addressable customer base for liquid concentrates and support customized oligosaccharide profiles, which helps beverage manufacturers run faster formulation cycles and can improve supply consistency for regulated nutrition categories.
Recent Industry Developments in Prebiotic Ingredients Market
- June 2026: Ingredion acquired NutriLeads’ Benicaros prebiotic fiber business, including its intellectual property and clinical data package. The deal adds a differentiated, clinically supported fiber platform to Ingredion’s portfolio and strengthens its positioning with food, beverage, and supplement customers seeking substantiated gut and immune health ingredients.
- November 2025: Tereos launched Actifiber, a soluble non-GMO fiber produced in France for food and beverage applications. The launch expands Tereos’ functional fiber offering and supports formulators working on fiber enrichment and sugar or calorie reduction while maintaining clean-label positioning.
- October 2025: Archer Daniels Midland (ADM) received Therapeutic Goods Administration (TGA) approval in Australia for Fibersol as an active ingredient for health products. This regulatory milestone supports higher-value applications and can help brand owners and contract manufacturers accelerate compliant product development for regulated wellness channels.


Prebiotic Ingredients Market Report Scope and Research Methodology
Market Definition and Coverage
This market covers revenues generated from prebiotic ingredients that are sold as inputs and blended into food, beverage, dietary supplements, infant nutrition, and related formulations to support gut health benefits.
Scope exclusions: We exclude finished consumer products and retail margins, and we also exclude probiotics and other live cultures that are not prebiotic ingredients.
Segments Covered in This Report
- By Type
- Inulin
- Fructo-oligosaccharides (FOS)
- Galacto-oligosaccharides (GOS)
- Mannan-oligosaccharides (MOS)
- Others
- By Source
- Plant-Based Source
- Dairy-Based Source
- Others
- By Form
- Powder
- Liquid
- By Application
- Functional Food and Beverage
- Infant Formula and Baby Food
- Dietary Supplements
- Animal Feed
- Others
- By Geography
- North America
- United States
- Canada
- Mexico
- Rest of North America
- Europe
- Germany
- United Kingdom
- Italy
- France
- Spain
- Netherlands
- Poland
- Belgium
- Sweden
- Rest of Europe
- Asia-Pacific
- China
- India
- Japan
- Australia
- Indonesia
- Thailand
- Singapore
- South Korea
- Rest of Asia-Pacific
- South America
- Brazil
- Argentina
- Colombia
- Chile
- Peru
- Rest of South America
- Middle East and Africa
- South Africa
- Saudi Arabia
- United Arab Emirates
- Nigeria
- Egypt
- Morocco
- Turkey
- Rest of Middle East and Africa
- North America
Data Sources, Market Sizing, and Validation
Desk Research
Desk work starts by building the supply and demand backdrop for prebiotic ingredients, and then aligning it to how ingredient sales are typically reported by producers and distributors. We rely on public sources such as USDA and other national agriculture statistics, US FDA and EFSA publications for ingredient and label context, UN Comtrade trade statistics for key carbohydrate and fiber inputs, and peer-reviewed nutrition journals that clarify usage patterns and functional claims.
To keep the model grounded, we also review company annual reports, investor decks, and press releases that discuss capacity moves, product launches, and pricing direction for fibers and oligosaccharides. In addition, we use paid subscriptions for company financials and intelligence, patent databases, and shipment-level import and export views when they help confirm trade flows and route-to-market signals. The desk sources listed above are illustrative only, and many other public documents were also used for data collection, validation, and research clarification.
Primary Interviews and Surveys
Primary work is used to pressure test the desk assumptions with ingredient producers, distributors, and large end users serving food and beverage, dietary supplements, and infant nutrition. We also ask about typical inclusion rates, price realization versus list prices, and how demand shifts with clean label reformulations across APAC, EMEA, and the Americas.
Distribution of primary research fieldwork respondents
| Company type | Respondent position | Region |
|---|---|---|
| Top tier: 31% | CXOs: 15% | APAC: 37% |
| Mid tier: 49% | Functional/Unit leaders: 37% | EMEA: 36% |
| Smaller Players: 20% | Managers: 48% | Americas: 27% |
Market-Sizing & Forecasting
Sizing is built using a top-down approach where production and trade signals for key prebiotic ingredient families are reconstructed, and then converted into value using observed pricing ranges by region and application. Since not every country reports prebiotic ingredient volumes cleanly, proxies like soluble fiber output, tariff-line trade movement, and documented capacity utilization are used, and the main totals are then adjusted using insights from primary conversations.
To keep the math practical, we track variables such as average selling price movement for inulin and oligosaccharides, the share of use in fortified foods and beverages versus supplements, infant formula demand momentum, and regulatory and label acceptance trends that affect adoption. Where a value chain step is not visible, the gap is handled by using regional penetration ranges and conservative conversion factors that were validated with respondents.
For forecasting, scenario analysis is applied around a base case, with a light multivariate check against drivers like health and wellness spending, functional food launches, and raw material pricing direction. The outputs are corroborated with selective bottom-up approximations, such as sampled supplier revenue mix checks and ASP multiplied by estimated volumes, so the final numbers remain realistic and repeatable.
Data Validation & Update Cycle
Results are validated through triangulation across independent indicators, and large variances are flagged for follow-up checks before sign-off. When a region shows a sudden jump, the drivers are re-tested against trade movement, capacity additions, and any known regulatory or labeling changes, and then rechecked with one more expert touchpoint if needed.
A multi-step analyst review is followed so assumptions, conversions, and currency treatments are consistent across the model. The report is refreshed annually, and interim updates are made when material events occur, such as large capacity expansions or sharp feedstock price shifts. Before delivery, a final freshness pass is completed so clients receive the most up-to-date view available.
Mordor Intelligence's Prebiotic Ingredient Market Size Versus Other Published Estimates
Published market sizes for prebiotic ingredients often do not match because the studies do not always count the same revenue layers, and they use different timing for prices and currency conversions. Differences can also come from whether the focus stays on ingredient revenues only, or expands into adjacent finished product value.
The main gap comes from whether finished functional foods and supplements are mixed into the total, where Mordor Intelligence counts only ingredient-level revenues and then tests pricing using application-level inclusion rates and region-specific ASP ranges. Some external estimates also use a more aggressive price progression path or a different base year, which can lift the value even if the underlying demand pool is similar.
Benchmark comparison
| Source | Market Size | Gaps in Research Methodology |
|---|---|---|
| Mordor Intelligence | USD 7.11 B (2026) | |
| Global Consultancy A | USD 8.43 B (2024) | Uses a different base year and can blend broader health and nutrition revenue layers, which inflates totals versus ingredient-only revenue counting, and it may also apply a faster price ramp assumption. |
| Industry Publisher B | USD 7.53 B (2025) | Relies on a 2025 base year with a wider application sweep, and the valuation can shift depending on how blended fibers and premix sales are treated and how currency rates are averaged. |
Taken together, the spread mainly reflects scope and timing choices rather than a totally different demand story. By keeping the calculation tied to ingredient revenues, realistic inclusion rates, and cross-checked pricing, the final total stays traceable to clear steps that can be repeated when new data points appear.


Key Questions Answered in the Report
What is the projected value of the prebiotic ingredients market by 2031
It is expected to reach USD 11.27 billion driven by a 9.67% CAGR from 2026 to 2031
Which region is growing fastest for prebiotic ingredients
Asia–Pacific leads with an anticipated 11.17% CAGR through 2031 as China and India liberalize claims
Why are galacto-oligosaccharides gaining share
Infant-formula brands seek EFSA-approved ingredients with documented bifidogenic effects fueling an 11.59% CAGR
How are manufacturers coping with chicory price volatility
They diversify into agave and Jerusalem artichoke sources and expand liquid-concentrate offerings to offset cost spikes
What application segment is set to outpace others by growth
Dietary supplements should grow at 12.51% CAGR as capsules bypass taste challenges seen in fortified foods
Page last updated on:


 Your data is secure and never sold or shared.


