Market Overview
| Study Period | 2021 - 2031 |
|---|---|
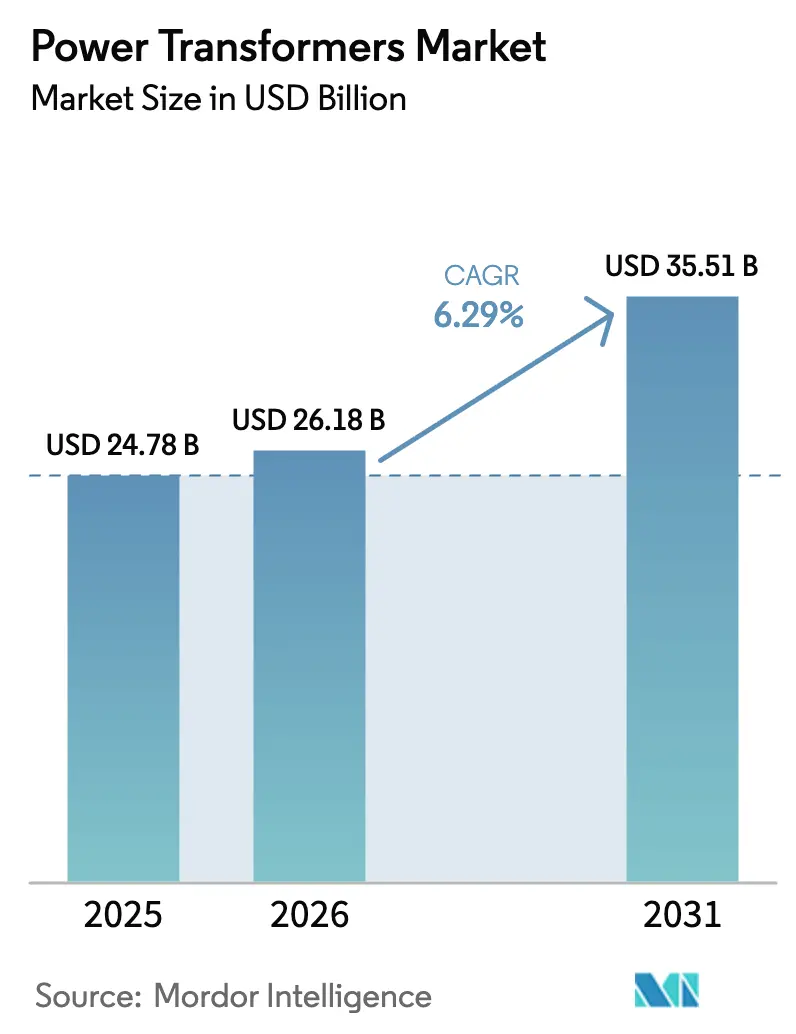
| Market Size (2026) | USD 26.18 Billion |
| Market Size (2031) | USD 35.51 Billion |
| Growth Rate (2026 - 2031) | 6.29% CAGR |
| Fastest Growing Market | Asia Pacific |
| Largest Market | Asia Pacific |
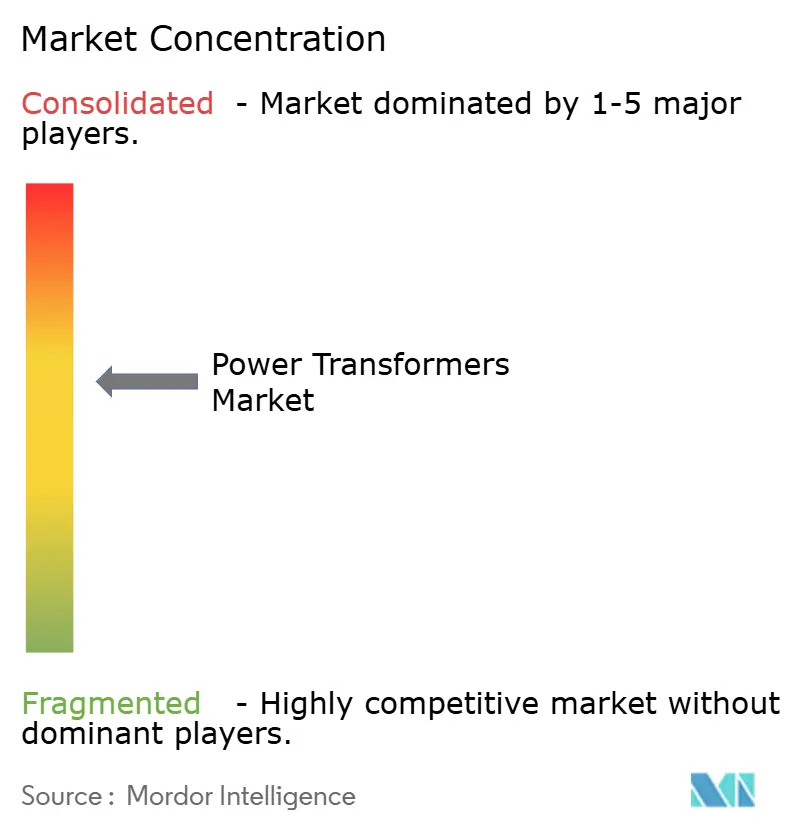
| Market Concentration | Medium |
Major Players *Disclaimer: Major Players sorted in no particular order Image © Mordor Intelligence. Reuse requires attribution under CC BY 4.0. | |
Power Transformers Market Analysis by Mordor Intelligence
The Power Transformers Market size was valued at USD 24.78 billion in 2025 and is estimated to grow from USD 26.18 billion in 2026 to reach USD 35.51 billion by 2031, at a CAGR of 6.29% during the forecast period (2026-2031).
Renewables now dominate new-build generation, so utilities are replacing aging step-up and step-down assets with digitally monitored units that tolerate higher thermal stress and enable ±10% on-load tap-changing. Grid-modernization packages enacted in the United States and the European Union, plus ultra-high-voltage (UHV) corridors across China and India, are accelerating tenders for >500 MVA converter transformers. Fire-safety statutes in dense urban substations and hyperscale data-center campuses are also pushing buyers toward ester-filled or dry-type designs. Meanwhile, price-aggressive Asian suppliers are winning bids by bundling financing and localized after-sales support, squeezing incumbent margins even as overall demand rises.
Key Report Takeaways
- By power rating, medium-rated (10–100 MVA) units led with 52.4% of power transformer market share in 2025, while large units above 100 MVA are forecast to post the fastest 7.5% CAGR through 2031.
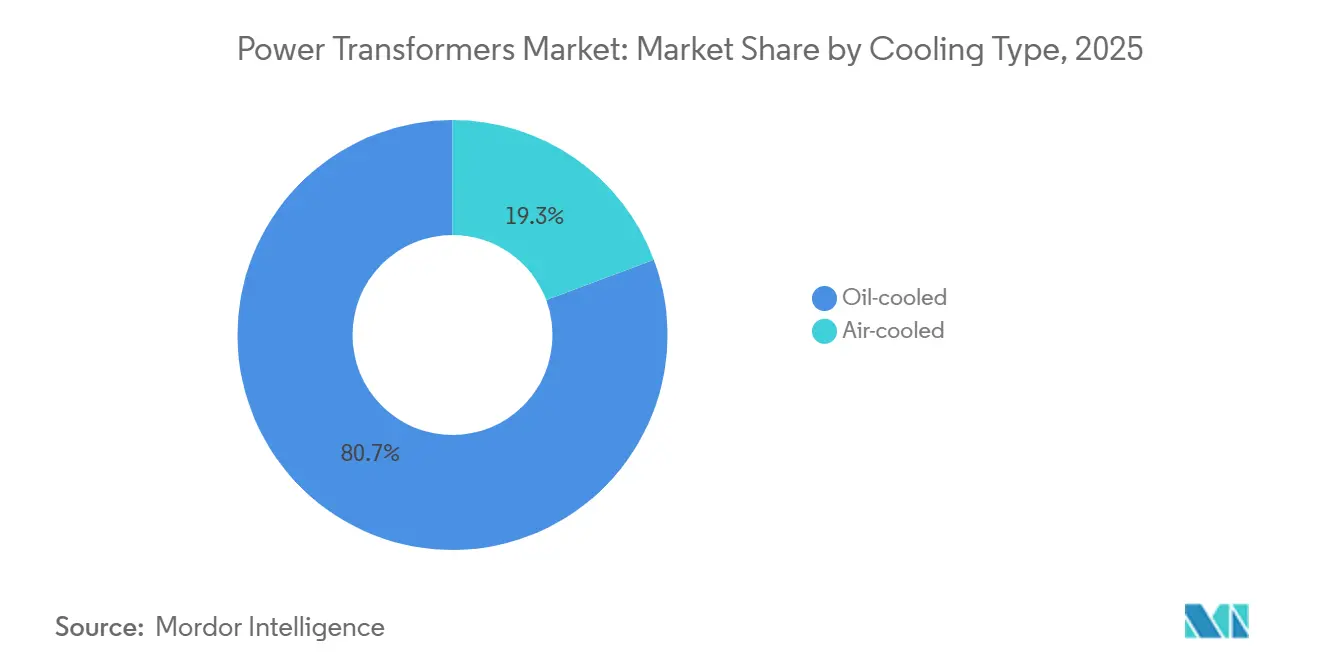
- By cooling type, oil-cooled designs held 80.7% revenue share in 2025; air-cooled variants are advancing at a 7.6% CAGR, buoyed by strict fire-safety codes in data-center and metro-substation projects.
- By phase, three-phase configurations captured 71.5% installations in 2025 and will sustain a 6.8% CAGR to 2031 on the back of utility-scale solar and offshore-wind buildouts.
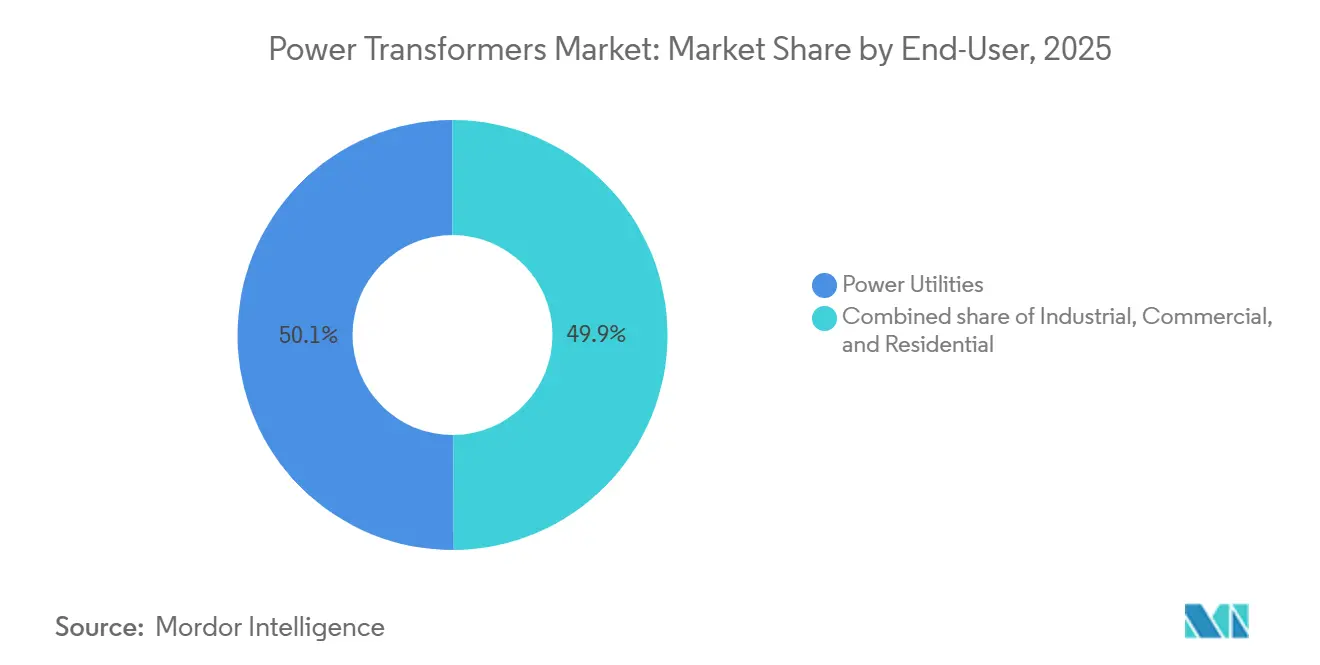
- By end-user, power utilities absorbed 50.1% shipments in 2025, yet the industrial segment is projected to expand at the fastest 8.3% CAGR as manufacturers electrify process heat and add captive renewables.
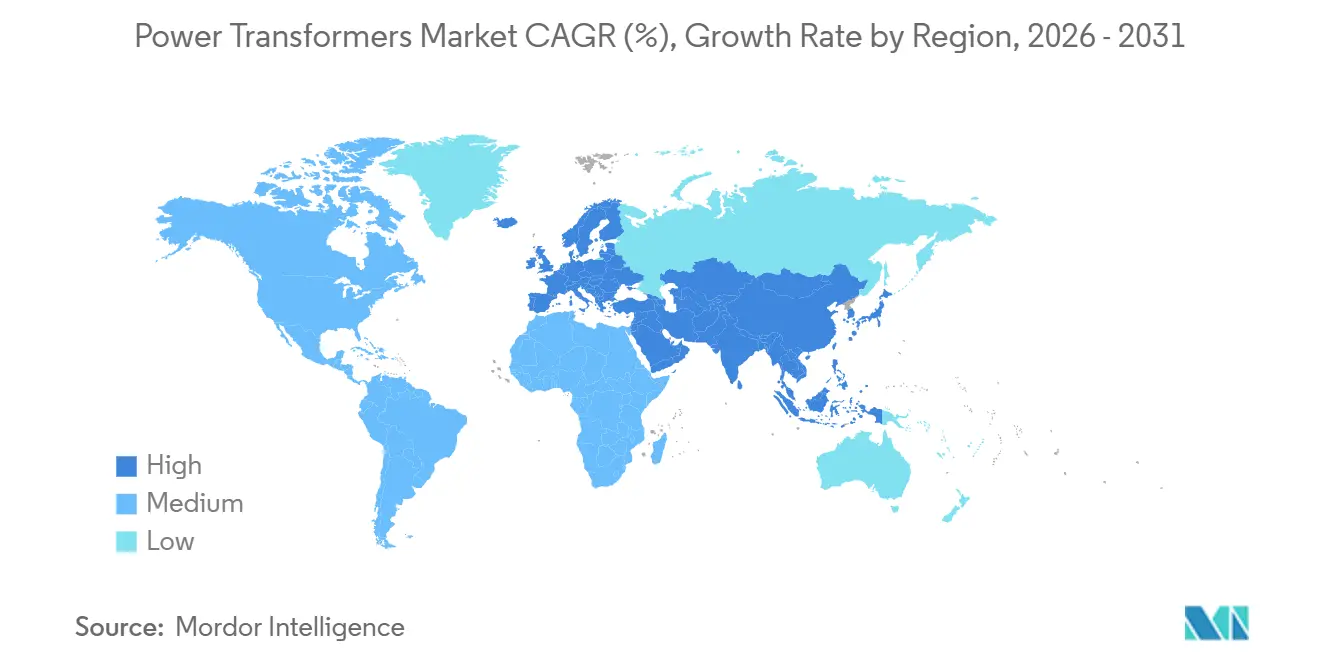
- By geography, Asia-Pacific dominated with 42.6% revenue in 2025 and is forecast to grow at 7.0% owing to China’s ±800 kV HVDC links and India’s INR 3.03 trillion distribution-reform scheme.
Note: Market size and forecast figures in this report are generated using Mordor Intelligence’s proprietary estimation framework, updated with the latest available data and insights as of 2026.
Global Power Transformers Market Trends and Insights
Drivers Impact Analysis*
| Driver | (~) % Impact on CAGR Forecast | Geographic Relevance | Impact Timeline |
|---|---|---|---|
| Increasing integration of renewable energy generation | +1.8% | China, India, EU, US | Medium term (2-4 years) |
| Aging power grids & heavy T&D refurbishment pipelines | +1.5% | North America, Europe, Japan | Long term (≥4 years) |
| Stricter grid-reliability standards & HVDC interconnections | +1.2% | APAC core, EU, Middle East | Medium term (2-4 years) |
| Electrification of rail & e-bus networks | +0.7% | China, India, EU corridors | Short term (≤2 years) |
| Data-center ultra-HV demand for flexible-core LPTs | +0.6% | North America, EU, Singapore | Short term (≤2 years) |
| Green-hydrogen electrolysers’ step-up needs | +0.5% | Middle East, Australia, EU | Long term (≥4 years) |
| Source: Mordor Intelligence | |||
Understand The Key Trends Shaping This Market
Download Sample Report
Increasing Integration of Renewable Energy Generation
Solar and wind additions outstripped thermal builds for a second consecutive year, forcing utilities to specify transformers with faster tap-changers and harmonic-filtering windings that shield inverters from over-voltage events.[1]International Renewable Energy Agency, “Renewable Power Generation Costs in 2024,” irena.org China commissioned 12 new 1,000 kV AC substations in 2025, each fitted with multiple 1,000 MVA autotransformers for long-haul green power evacuation. India’s Solar Energy Corporation linked 15 GW of PV to the grid in fiscal 2025 using ester-filled transformers that tolerate 45 °C desert temperatures. Europe’s offshore-wind buildout requires subsea-rated 66 kV–220 kV units mounted on floating platforms, a niche dominated by two incumbents holding critical IP.[2]European Commission, “REPowerEU,” ec.europa.eu
Aging Power Grids & Heavy T&D Refurbishment Pipelines
Roughly 70% of U.S. power transformers now exceed their 40-year design life, and dissolved-gas-analysis logs show rising cellulose degradation risk.[3]U.S. Energy Information Administration, “Today in Energy,” eia.gov Washington’s Infrastructure Investment and Jobs Act earmarked USD 65 billion through 2026 for single-contingency transformer replacement at critical nodes.[4]U.S. Department of Energy, “Infrastructure Investment and Jobs Act,” energy.gov Germany’s transmission operators budgeted EUR 20 billion in 2025 for north-south corridor upgrades that require 420 kV ester-filled units. Japan is enforcing seismic retrofits on every substation in high-risk zones by 2027, pushing demand for base-isolated designs.
Stricter Grid-Reliability Standards & HVDC Interconnections
N-2 criteria now embedded in EU and North American reliability codes oblige operators to install redundant transformer capacity and adopt HVDC backbones that decouple asynchronous AC grids. China energized three ±800 kV corridors in 2025, each anchored by 500 MVA converter transformers with valve windings engineered for 2.5 p.u. over-voltage tolerances. India’s 6 GW Rajasthan–Delhi HVDC link specifies ester-insulated units to mitigate fire risk along populated routes. ENTSO-E’s Ten-Year Plan coordinates 15 cross-border links needing standardized interfaces to compress procurement lead times.
Electrification of Rail & E-Bus Networks
Electric multiple units and battery buses are reshaping depot electrical loads. China reported that 98% of new urban buses delivered in 2025 were electric, prompting installation of 10–20 MVA depot transformers that exploit low-tariff night charging. India’s target of 50,000 electric buses by 2027 entails fast-charge hubs with 150–350 kW dispensers powered by ester-filled units. European capitals are mandating zero-emission fleets by 2030, favoring compact dry-type designs that meet <50 dB noise caps.
Restraints Impact Analysis*
| Restraint | (~) % Impact on CAGR Forecast | Geographic Relevance | Impact Timeline |
|---|---|---|---|
| High CAPEX & multi-year payback periods | -0.9% | South Asia, Sub-Saharan Africa, Latin America | Medium term (2-4 years) |
| Volatile prices of electrical steel & copper | -0.7% | Global, acute in import-dependent regions | Short term (≤2 years) |
| Geopolitical trade curbs on critical components | -0.5% | US-China, EU-Russia corridors | Medium term (2-4 years) |
| Shortage of experienced transformer-design engineers | -0.4% | North America, Europe, Japan | Long term (≥4 years) |
| Source: Mordor Intelligence | |||
High CAPEX & Multi-Year Payback Periods
Large transformers span USD 2–10 million each and yield 15–25-year paybacks, a hurdle for utilities whose tariff-collection efficiency lags 85%. Indian state boards posted 16.2% aggregate losses in fiscal 2025, curbing replacement budgets absent sovereign guarantees. Nigeria and Argentina defer upgrades due to subsidy reforms and currency shocks, prolonging overload exposure.
Volatile Prices of Electrical Steel & Copper
Export licensing on grain-oriented electrical steel pushed spot prices above USD 2,500/t in 2024, while copper futures averaged USD 9,200/t in 2025 on Latin-American mine disruptions. Mid-tier manufacturers lacking hedges suffered margin compression and, in several cases, consolidation.
*Our updated forecasts treat driver/restraint impacts as directional, not additive. The revised impact forecasts reflect baseline growth, mix effects, and variable interactions.
Segment Analysis
By Power Rating: Large Units Capture UHV and Offshore-Wind Momentum
Large >100 MVA transformers are projected to grow 7.5% annually to 2031, well above the overall power transformer market average, as China, India, and the EU build ±800 kV HVDC corridors and >500 MVA offshore-wind hubs. The segment accounted for 47.6% of the 2025 value and is poised to exceed USD 18 billion of the power transformer market size by 2031. Medium-rated 10–100 MVA units, while holding 52.4% revenue in 2025, will expand more modestly because distribution-substation density is maturing in developed grids. Siemens Energy’s modular platform trims on-site assembly 30%, letting utilities energize large units within nine months instead of 14, a competitive edge in fast-track renewables.
Smaller ≤10 MVA products remain relevant for microgrids and rural electrification but face substitution risk as centralized UHV backbones bypass low-voltage feeders. China deployed eighteen 1,000 MVA autotransformers in 2025 to back its Zhangbei flexible-AC demonstration, underscoring the capital gravitating toward very-large ratings. New hybrid-insulation designs using ester coolant and laminated pressboard are lifting thermal limits, which further favors scale-up of capacity per footprint.
By Cooling Type: Ester and Dry-Type Solutions Erode Mineral-Oil Dominance
Although oil-filled units still commanded 80.7% revenue in 2025, building codes and ESG mandates are catalyzing a 7.6% CAGR for air-cooled and ester-filled models. California’s revised Title 24 grants efficiency credits that effectively ban mineral-oil transformers within 200 m of waterways, shifting demand toward dry-type designs. Siemens Energy stated 40% of 2025 orders specified ester coolant, double 2023’s share, signaling an inflection.
Fire safety, insurance savings, and simplified decommissioning outweigh the 10–20% price premium for many buyers, especially data-center and hospital developers. GE Vernova’s hybrid forced-air/heat-pipe unit, launched in 2025, offers 99.1% efficiency, narrowing the density gap with mineral-oil peers and unlocking indoor deployment where space-to-rating ratios are less critical.
Note: Segment shares of all individual segments available upon report purchase
Get Detailed Market Forecasts at the Most Granular Levels
Download Sample Report
By Phase: Three-Phase Remains the Utility Workhorse
Three-phase devices held 71.5% installations and will continue leading with a 6.8% CAGR as grids migrate to balanced three-wire architectures that accommodate electric-vehicle fast charging and induction-motor loads. India converted 8 million agricultural feeders to three-phase service in 2025, boosting equipment orders. Single-phase banks survive in North-American suburbs and rail catenary systems but face gradual displacement.
Efficiency gains of roughly 15% on core and winding losses, compared with equivalent single-phase clusters, reinforce three-phase preference when substations confront land-take constraints. Vendors are embedding harmonic filters and power-factor capacitors inside three-phase tanks, curbing auxiliary-equipment footprints and accelerating procurement cycles.
By End-User: Industrial Buyers Pace Unit Growth
Utilities still dictated 50.1% shipments in 2025, yet industrial buyers will outpace all others at an 8.3% CAGR thanks to electrified heat, captive PV-plus-battery systems, and robotics. The segment is on track to command over USD 9 billion of the power transformer market size by 2031. Steelmakers, refiners, and petrochemical operators seek 60–110 MVA ester-cooled transformers that curtail unplanned downtime through online dissolved-gas analysis.
Commercial campuses such as data centers, hospitals, and universities integrate 20 kV primary distribution and microgrids, demanding 1–10 MVA liquid-filled pads with digital-twin diagnostics. Residential uptake stays relatively flat, tied to housing starts and rural electrification rather than transformative drivers.
Note: Segment shares of all individual segments available upon report purchase
Get Detailed Market Forecasts at the Most Granular Levels
Download Sample Report
Geography Analysis
Asia-Pacific led the power transformer market in 2025 with 42.6% share and is set to expand at 7.0%, propelled by China’s rollout of 1,000 kV AC and ±800 kV DC backbones and India’s INR 3.03 trillion distribution-reform spend. State Grid’s 18 UHV projects alone represent more than 11 GVA of incremental demand, while India’s scheme allocates 30% of outlay for smart-meter-linked transformer swaps. Japan and South Korea add incremental lift through seismic and offshore-wind retrofits, respectively.
North America will climb at 6.5% as the Inflation Reduction Act unlocks USD 65 billion for grid resiliency. Canada’s Hydro-Québec is reinforcing 735 kV corridors to U.S. markets, and Mexico’s CFE is revamping 400 kV routes to integrate Sonora solar and Oaxaca wind, together yielding >4 GVA of orders over 2025-2028. Collectively, the region could command nearly USD 9 billion of the power transformer market size by 2031.
Europe grows 6.2%, fueled by REPowerEU’s EUR 300 billion package. Offshore-wind interconnections in the North Sea and Celtic Sea require 66 kV-132 kV subsea units engineered for saline endurance, and cross-border HVDC projects under the Connecting Europe Facility demand 500 MVA converter transformers that meet common test protocols. Eastern European upgrades from Soviet-era hardware further widen the addressable base.
The Middle East & Africa surges 7.3% on gigawatt-scale solar farms, green-hydrogen hubs, and grid rehabilitation. Saudi Arabia’s NEOM and the UAE’s Al Dhafra solar park collectively added USD 300 million in orders during 2025, while South Africa and Egypt pivot to digital-monitoring retrofits to curb load-shedding events. South America advances 6.8%, led by Brazil’s 8 GW renewables auction and Chile’s USD 3.2 billion north-south transmission plan demanding 500 kV units with fast tap-changers for voltage-drop control.
Get Analysis on Important Geographic Markets
Download Sample Report
Competitive Landscape
The five largest suppliers, Hitachi Energy, Siemens Energy, GE Vernova, TBEA, and Hyundai Electric, captured roughly 45% global revenue in 2025, leaving ample space for regional challengers that leverage local content and faster delivery. Hitachi Energy leverages its ABB power-grids heritage to dominate HVDC converter projects, recently landing a USD 180 million NEOM order for 66 kV ester-filled units with digital twins. Siemens Energy’s Nuremberg expansion boosted capacity 40%, targeting modular HVDC platforms that trim site works 30%. GE Vernova’s Prolec-GE subsidiary is pivoting toward data-center-optimized hybrids that achieve near-oil thermal performance.
TBEA raised Xinjiang capacity 25% to serve Belt & Road corridors, while CG Power opened a 20,000 MVA Indian plant that cuts cycle times 25%. Elsewedy Electric’s local manufacturing in Egypt helps it win 500 kV ring-main contracts under sovereign funding. Standards harmonization by IEC and IEEE is curbing technology lock-in, so price, financing, and delivery lead time now dominate bid evaluations, intensifying margin pressure on incumbents.
White-space opportunities lie in green-hydrogen step-up units rated 66 kV, subsea-rated 220 kV transformers for floating wind, and compact 20 kV pads for hyperscale data-centers. Niche specialists such as Hammond Power Solutions and TriDelta Meidensha compete on application-specific engineering and eight-month delivery promises, carving share where incumbents face 15-month lead-time bottlenecks.
Power Transformers Industry Leaders
Hitachi Energy (ABB)
Siemens Energy AG
GE Vernova
Toshiba Energy Systems & Solutions
Hyundai Electric & Energy Systems
- *Disclaimer: Major Players sorted in no particular order
Need More Details on Market Players and Competitors?
Download Sample Report
Recent Industry Developments
- February 2026: Hammond Power Solutions announced an agreement to acquire AEG Power Solutions in an all-cash transaction valued at approximately CAD 365 million. This acquisition aims to enhance its electrical solutions portfolio by integrating transformer expertise with power electronics capabilities and expanding its global market presence, subject to regulatory approvals.
- February 2026: ASTA Energy Solutions AG entered into long-term supply agreements with Prolec GE Vernova and TSEA. These agreements aim to reinforce its position in the Latin American high-voltage transformer market by securing critical component supplies and fostering strategic partnerships.
- January 2026: RESA Power expanded its transformer solutions capabilities through the acquisition of 3MD Power Services LLC. This acquisition adds high-voltage testing, repair, and installation expertise to its service offerings while strengthening its regional operations in the U.S. South Atlantic.
- October 2025: Premier Energies approved key acquisitions, including a 51% stake in Transcon Industries and solar inverter manufacturer KSolare. These acquisitions signify its diversification into power transformer and inverter manufacturing, further strengthening its clean energy ecosystem.
Global Power Transformers Market Report Scope
Power transformers are electrical instruments that transmit power from one circuit to another without changing the frequency. They operate by the basic principle of electromagnetic induction and transmit electricity between generators and primary distribution circuits. Power transformers are usually expensive and tailored to the end user's requirements, resulting in longer lead times (more than 6 months) to manufacture.
The power transformer market report is segmented by size and geography. By size, the market is segmented into large power transformers, medium power transformers, and small power transformers. By geography, the market is segmented into North America, Asia-Pacific, Europe, South America, and the Middle East and Africa. The report also covers the market size and forecasts for the power transformer market across major regions. For each segment, market sizing and forecasts have been done based on revenue (value in USD).
By Power Rating (MVA)
| Large (Above 100 MVA) |
| Medium (10 to 100 MVA) |
| Small (Up to 10 MVA) |
By Cooling Type
| Air-cooled |
| Oil-cooled |
By Phase
| Single-Phase |
| Three-Phase |
By End-User
| Power Utilities (includes, Renewables, Non-renewables, and T&D) |
| Industrial |
| Commercial |
| Residential |
By Geography
| North America | United States |
| Canada | |
| Mexico | |
| Europe | Germany |
| United Kingdom | |
| France | |
| Italy | |
| Spain | |
| Russia | |
| Rest of Europe | |
| Asia-Pacific | China |
| India | |
| Japan | |
| South Korea | |
| ASEAN Countries | |
| Australia and New Zealand | |
| Rest of Asia-Pacific | |
| South America | Brazil |
| Argentina | |
| Chile | |
| Rest of South America | |
| Middle East and Africa | Saudi Arabia |
| United Arab Emirates | |
| South Africa | |
| Egypt | |
| Rest of Middle East and Africa |
| By Power Rating (MVA) | Large (Above 100 MVA) | |
| Medium (10 to 100 MVA) | ||
| Small (Up to 10 MVA) | ||
| By Cooling Type | Air-cooled | |
| Oil-cooled | ||
| By Phase | Single-Phase | |
| Three-Phase | ||
| By End-User | Power Utilities (includes, Renewables, Non-renewables, and T&D) | |
| Industrial | ||
| Commercial | ||
| Residential | ||
| By Geography | North America | United States |
| Canada | ||
| Mexico | ||
| Europe | Germany | |
| United Kingdom | ||
| France | ||
| Italy | ||
| Spain | ||
| Russia | ||
| Rest of Europe | ||
| Asia-Pacific | China | |
| India | ||
| Japan | ||
| South Korea | ||
| ASEAN Countries | ||
| Australia and New Zealand | ||
| Rest of Asia-Pacific | ||
| South America | Brazil | |
| Argentina | ||
| Chile | ||
| Rest of South America | ||
| Middle East and Africa | Saudi Arabia | |
| United Arab Emirates | ||
| South Africa | ||
| Egypt | ||
| Rest of Middle East and Africa | ||
Need A Different Region or Segment?
Customize Now
Key Questions Answered in the Report
What CAGR is projected for the power transformer market through 2031?
The market is forecast to post a 6.29% CAGR from 2026 to 2031, growing from USD 26.18 billion in 2026 to USD 35.51 billion in 2031.
Which power-rating segment grows the fastest?
Large transformers above 100 MVA will expand at a 7.5% CAGR on UHV and offshore-wind demand.
Why are ester-filled transformers gaining ground?
They offer higher fire safety, meet new environmental codes, and can eliminate costly containment pits.
Which region leads demand?
Asia-Pacific held 42.6% of 2025 revenue and is projected to grow 7.0% through 2031.
How will data centers influence future demand?
Hyperscale operators shifting to 20 kV distribution need amorphous-core, digitally monitored units, adding a high-growth niche within 1 to 10 MVA ratings.

