Power And Utilities MLCC Market Size and Share
Market Overview
| Study Period | 2020 - 2031 |
|---|---|
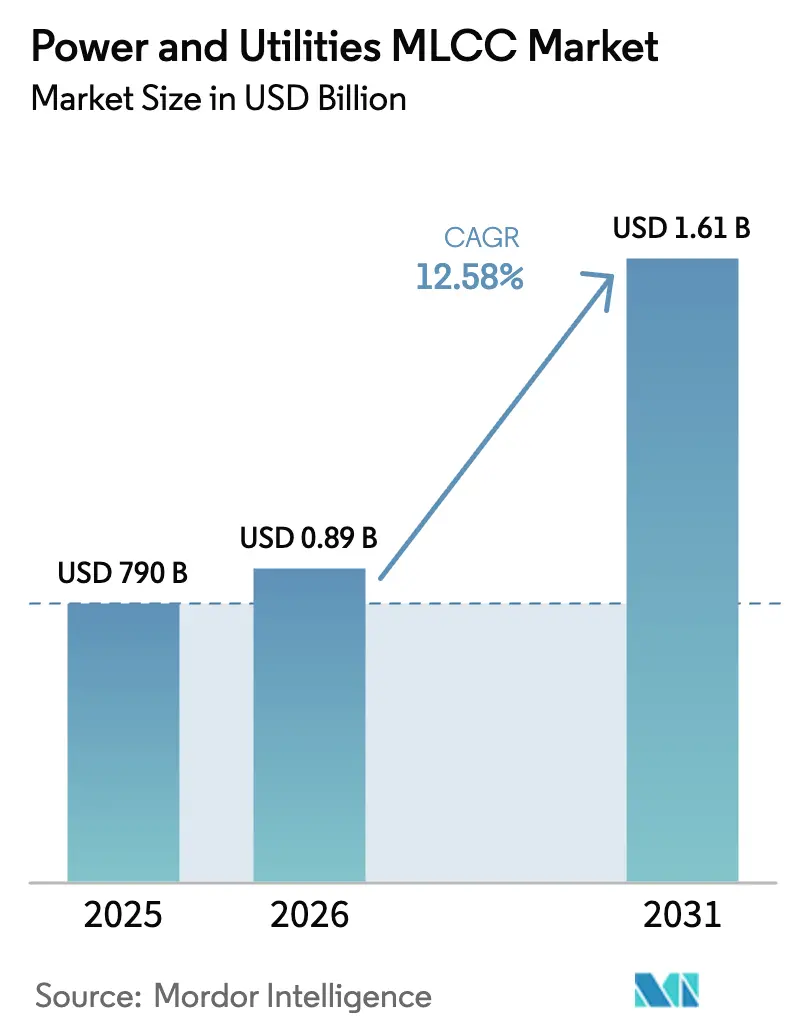
| Market Size (2026) | USD 0.89 Billion |
| Market Size (2031) | USD 1.61 Billion |
| Growth Rate (2026 - 2031) | 12.58% CAGR |
| Fastest Growing Market | North America |
| Largest Market | Asia-Pacific |
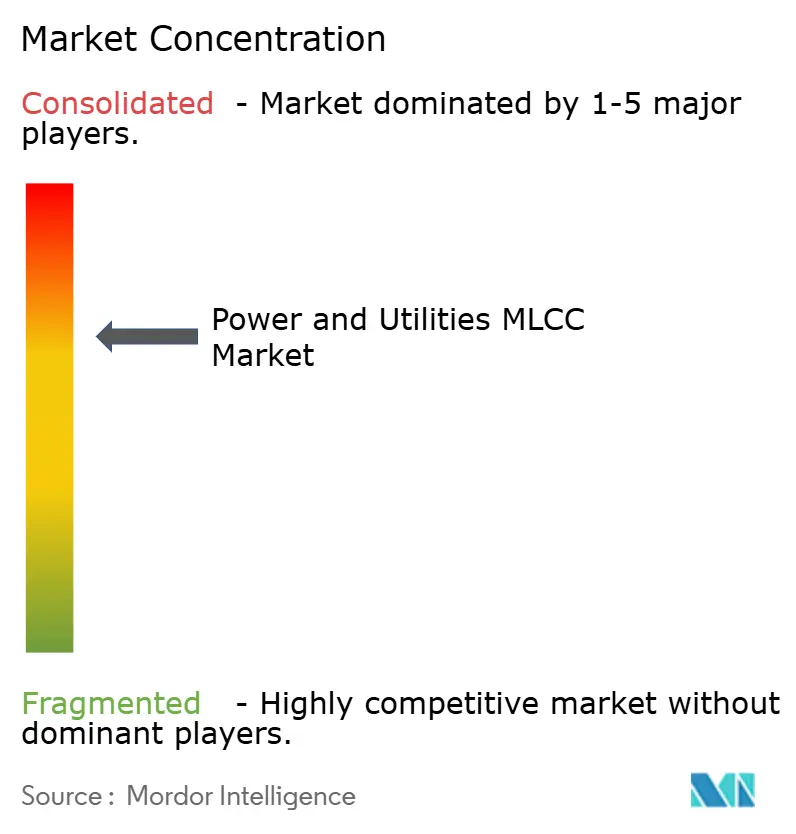
| Market Concentration | Medium |
Major Players*Disclaimer: Major Players sorted in no particular order Image © Mordor Intelligence. Reuse requires attribution under CC BY 4.0. | |
Power And Utilities MLCC Market Analysis by Mordor Intelligence
The power and utilities MLCC market size is expected to grow from USD 790 million in 2025 to USD 889.38 million in 2026 and is forecast to reach USD 1.61 billion by 2031 at 12.58% CAGR over 2026-2031. Robust capital spending on grid modernization, renewable energy integration, and advanced metering infrastructure fuels sustained demand for high-reliability multilayer ceramic capacitors that can withstand wide temperature swings and electrical transients. Utilities specify Class 1 dielectrics for critical control circuits, while miniaturization trends spur steady migration toward 402 and smaller case sizes that support automated assembly. Supply dynamics remain tight due to limited sources of high-purity ceramic powders, giving established Japanese producers pricing power. Meanwhile, the shift from legacy film capacitors to ceramic alternatives in substation and inverter environments accelerates technology substitution momentum across regions.
Key Report Takeaways
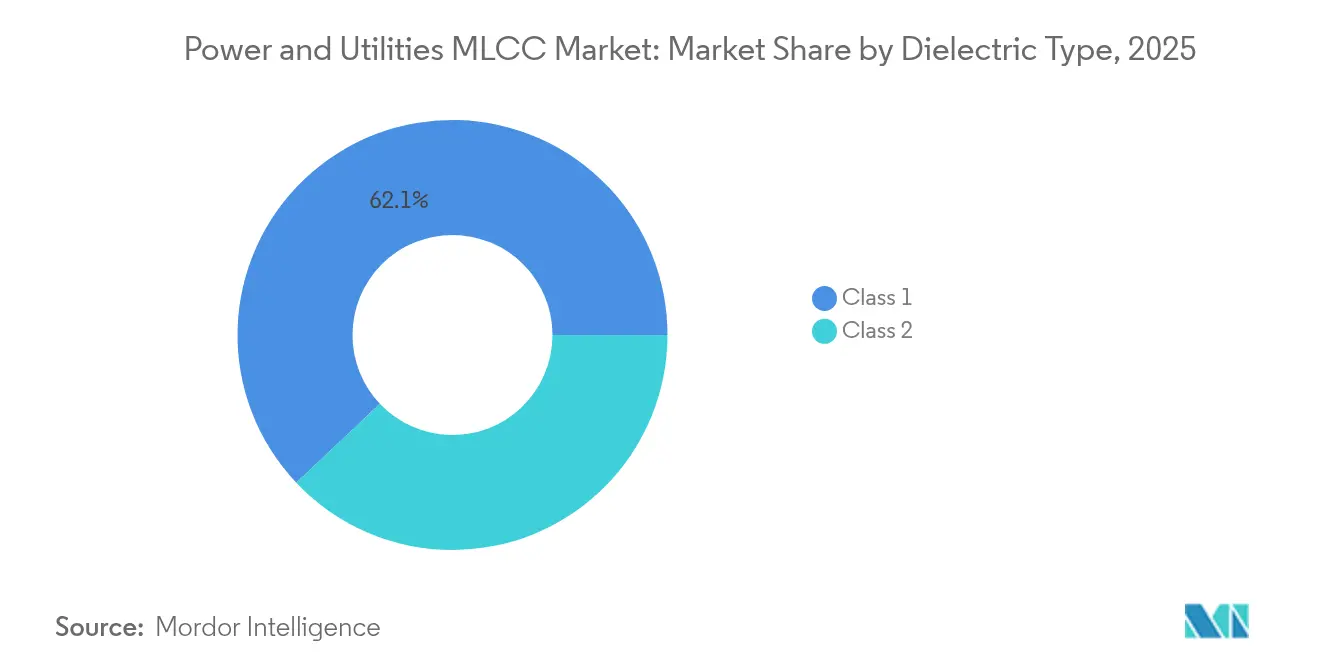
- By dielectric type, Class 1 devices led with 62.05% of power and utilities MLCC market share in 2025 and are projected to expand at a 13.94% CAGR through 2031.
- By case size, the legacy 201 package commanded 55.74% share of the power and utilities MLCC market size in 2025, while 402 devices are set to advance at a 13.65% CAGR between 2026-2031.
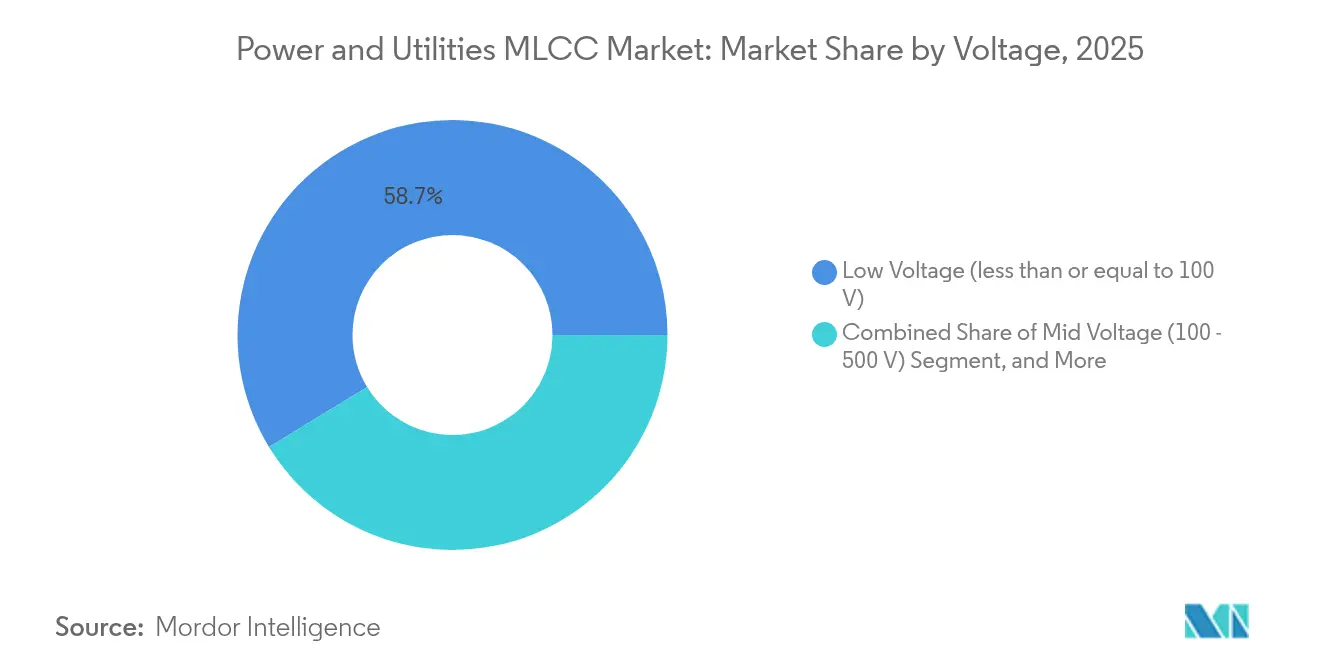
- By voltage rating, low-voltage (less than or equal to 100 V) parts accounted for 58.72% of the power and utilities MLCC market size in 2025; high-voltage (above 500 V) parts exhibit the fastest 13.88% CAGR as renewable power electronics scale.
- By mounting type, surface-mount MLCCs captured 41.15% share in 2025 in the power and utilities MLCC market and metal-cap packages record the highest 13.47% CAGR as harsh-environment installations proliferate.
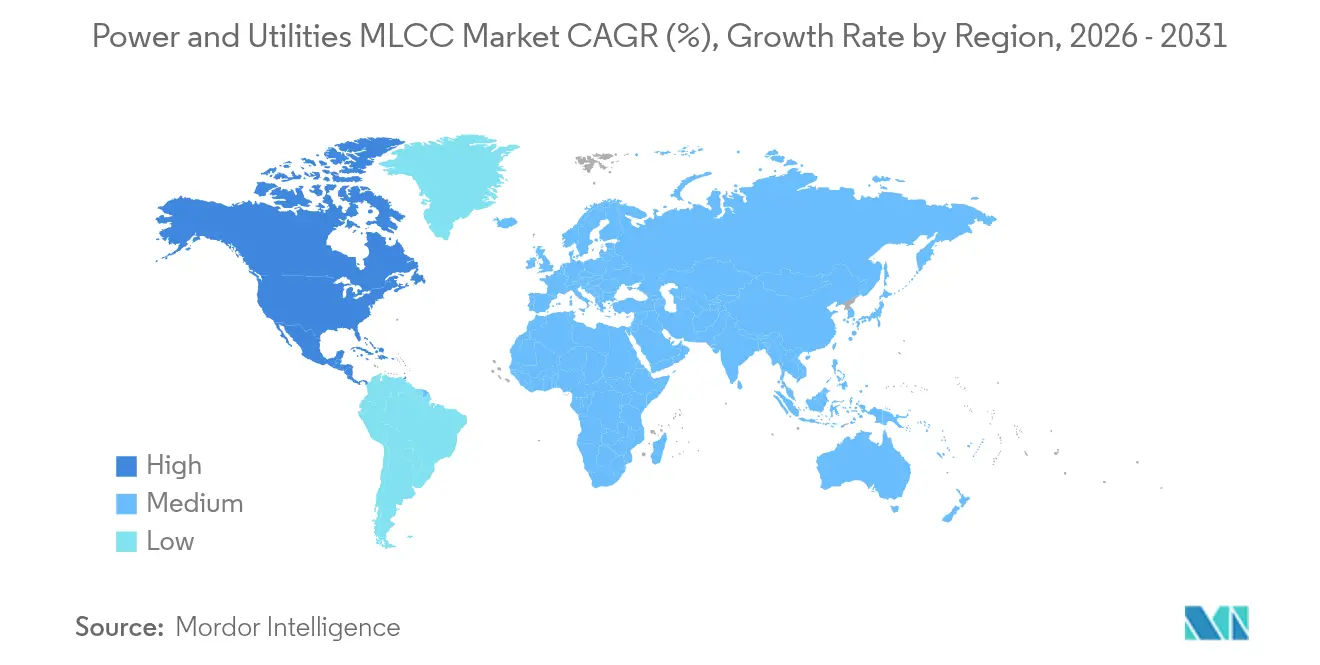
- By geography, Asia-Pacific retained 57.02% share in 2025 in the power and utilities MLCC market, whereas North America will grow at a 14.31% CAGR.
Note: Market size and forecast figures in this report are generated using Mordor Intelligence’s proprietary estimation framework, updated with the latest available data and insights as of 2026.
Global Power And Utilities MLCC Market Trends and Insights
Drivers Impact Analysis*
| Driver | (~) % Impact on CAGR Forecast | Geographic Relevance | Impact Timeline |
|---|---|---|---|
| Growing Adoption of Smart Grid Infrastructure | +2.8% | Global, with North America and EU leading deployment | Medium term (2-4 years) |
| Surge in Renewable Energy Installations Requiring High-Reliability MLCCs | +2.1% | Asia-Pacific core, spill-over to North America and Europe | Long term (≥ 4 years) |
| Increasing Demand for High-Voltage MLCCs in Power Conversion Equipment | +1.9% | Global, concentrated in manufacturing hubs | Medium term (2-4 years) |
| Government Incentives for Energy Efficiency and Electrification | +1.7% | North America, Europe, select Asia-Pacific markets | Short term (≤ 2 years) |
| Shift Toward Ceramic-Based Capacitor Alternatives to Film Capacitors | +1.4% | Global, particularly in high-temperature applications | Long term (≥ 4 years) |
| Emergence of SiC/GaN Power Electronics Triggering Ultra-High-Frequency MLCC Demand | +1.2% | North America, Europe, Japan | Long term (≥ 4 years) |
| Source: Mordor Intelligence | |||


Growing Adoption of Smart Grid Infrastructure
Utility investment in advanced metering infrastructure, distribution automation, and self-healing networks requires MLCCs that tolerate electromagnetic noise and ambient temperatures above 85 °C. Class 1 parts deliver the capacitance stability that grid controllers need to avoid false trips. Embedded IoT sensors in reclosers and feeder monitors further increase capacitor counts per device. IEEE interoperability standards guide utilities toward ceramic technology that maintains performance across humidity and voltage transients. Consequently, the power and utilities MLCC market benefits from premium pricing tied to stringent qualification cycles.
Surge in Renewable Energy Installations Requiring High-Reliability MLCCs
Utility-scale solar inverters and offshore wind converters expose components to rapid temperature cycling and salt spray, raising the bar for ripple-current endurance and low ESR performance.[1]Power Advisory LLC, “Grid Modernization and Infrastructure Investment Report,” poweradvisoryllc.com The adoption of SiC switches that operate above 100 kHz necessitates ultra-low ESL MLCCs in DC-link and snubber positions. Each megawatt of renewable capacity demands hundreds of capacitors, so the annual addition of 300 GW of renewables translates into a sizable volume uplift for the power and utilities MLCC market.
Increasing Demand for High-Voltage MLCCs in Power Conversion Equipment
Inverter DC-bus voltages above 1 kV call for capacitors with reinforced dielectric strength, pushing MLCC manufacturers to fine-tune barium titanate formulations.[2]Murata Manufacturing, “Advanced MLCC Technologies for Power Applications,” murata.com Wide-bandgap semiconductors amplify this trend as designers target smaller footprints and better thermal efficiency. Certification under IEC 61800 standards opens utility budgets to ceramic adoption, expanding addressable revenue pools.
Government Incentives for Energy Efficiency and Electrification
The U.S. Infrastructure Investment and Jobs Act allocates USD 65 billion for grid upgrades, spurring immediate procurement of control relays, sensor nodes, and charging stations packed with MLCCs. Similar incentives across Europe accelerate capacitor demand by rewarding high-efficiency switchgear that can pass Class A energy labels. Domestic-content rules also motivate capacity additions in North America, strengthening regional supply resilience.
Restraints Impact Analysis*
| Restraint | (~) % Impact on CAGR Forecast | Geographic Relevance | Impact Timeline |
|---|---|---|---|
| Supply Chain Constraints for High-Purity Ceramic Powders | -1.8% | Global, particularly affecting non-Asian manufacturers | Short term (≤ 2 years) |
| Volatility in MLCC Pricing Due to Raw Material Cost Fluctuations | -1.2% | Global, with varying regional impact | Medium term (2-4 years) |
| Accelerating Adoption of Polymer Capacitors in Niche Utility UPS Systems | -0.9% | North America and Europe, with selective APAC adoption | Medium term (2-4 years) |
| Environmental Regulations on Barium Titanate Waste Disposal | -0.7% | Europe and North America, expanding to APAC | Long term (≥ 4 years) |
| Source: Mordor Intelligence | |||
Supply Chain Constraints for High-Purity Ceramic Powders
Barium titanate feedstocks require controlled particle morphology, and only a handful of Asian vendors offer qualified supply. Environmental permitting slows capacity additions, causing extended lead times that ripple through capacitor production schedules. Utilities perceive this as a strategic risk and push for dual sourcing, yet replicating powder quality elsewhere remains challenging, pinching the growth rate of the power and utilities MLCC market.
Volatility in MLCC Pricing Due to Raw Material Cost Fluctuations
Electrode metals such as palladium and nickel trade on commodity exchanges, and price swings hamper long-term contract budgeting.[3]TDK Corporation, “TDK Announces Major Capacity Expansion for MLCC Production,” tdk.com Currency shifts between the Japanese yen and U.S. dollar further complicate forecasting. When MLCC prices rise, some utility OEMs trial polymer capacitors for UPS or control power, temporarily denting ceramic share.
*Our forecasts treat driver/restraint impacts as directional, not additive. The impact forecasts reflect baseline growth, mix effects, and variable interactions.
Segment Analysis
By Dielectric Type: Class 1 Reliability Commands Premium
Class 1 devices held 62.05% of power and utilities MLCC market share in 2025, reflecting utilities’ insistence on tight capacitance tolerance under −40 °C to +85 °C service conditions. This share is projected to climb further as Class 1 volume grows at a 13.94% CAGR through 2031, underscoring their indispensability in relay protection and phasor-measurement units. The power and utilities MLCC market benefits from continued research that lifts capacitance density without sacrificing the low TCC profile that grid operators specify.
The Class 2 segment satisfies filter and bulk-storage positions where volumetric efficiency outweighs drift, yet its uptake is tempered by utilities’ conservative qualification cycles. Competitive suppliers tout new Class 1 chemistries with doped titanium dioxide that reach 100 nF in 402 sizes, closing historical density gaps. These enhancements reinforce the market’s tilt toward precision ceramics as utilities modernize control architectures.


By Case Size: 402 Momentum Signals Ongoing Miniaturization
The 201 format remained the workhorse with 55.74% share of the power and utilities MLCC market size in 2025. However, 402 devices register the fastest 13.65% CAGR because inverter and converter designers seek higher loop gains in tighter enclosures. Automated pick-and-place lines favor standard reels of 402 chips, lowering assembly cost per kilowatt and bolstering the power and utilities MLCC market.
Larger 603 and 1210 cases persist in high-voltage snubber circuits where creepage distance outweighs board-area limits. Yet advances in copper clip terminations now permit 402 parts to tolerate 600 V peaks, hastening the shift. Field reliability data from mobile substations show fewer micro-cracks in smaller bodies when mounted on flex-rigid boards, adding another impetus for miniaturization.
By Voltage Rating: High-Voltage Segment Gains Strategic Importance
Low-voltage (less than or equal to 100 V) MLCCs dominated utility control boards with 58.72% power and utilities MLCC market share in 2025, supported by the explosion of digital sensors and PLC modules. The segment keeps a 12.22% CAGR through 2031 as each feeder automation cabinet adds Ethernet switches and cellular gateways. Simultaneously, the high-voltage tier (above 500 V) posts the fastest growth because SiC inverters are migrating toward 1.5 kV DC buses.
Qualification tests under IEC 60384 verify dielectric endurance at 125 °C, encouraging utilities to accept ceramics for bus stabilization. In addition, grid-forming storage systems call for high-voltage MLCC arrays that survive charged-discharged cycles exceeding 10 billion iterations, making reliability a key differentiator among suppliers.
By MLCC Mounting Type: Surface-Mount Retains Lead While Metal-Cap Expands
Surface-mount technology captured 41.15% of the power and utilities MLCC market share in 2025, validated by factory automation that dominates new relay and meter lines. The design shift toward plug-and-play modules further cements SMT adoption, especially for compact reclosers and fuse savers.
Metal-cap devices experience a 13.47% CAGR because offshore platforms and wind nacelles impose vibration loads that exceed the limits of SMT boards. Capacitors with solder-free metal end-plates distribute stress and enhance thermal paths. Radial-lead and screw-terminal formats remain viable in retrofits where PCB real estate is scarce; however, new-build preference trends overwhelmingly favor SMT and metal caps.
Geography Analysis
Asia-Pacific controlled 57.02% of the power and utilities MLCC market in 2025, leveraging regional ceramic-powder supply and aggressive grid build-outs in China and India. China’s pursuit of carbon neutrality by 2060 channels subsidy funds into UHV transmission and renewable hubs, each saturated with MLCC-rich converters. Japanese incumbents such as TDK and Murata sustain technological leadership and maintain dense supplier networks, enabling just-in-time shipments to OEMs across the region.
North America is the fastest riser with a 14.31% CAGR through 2031, propelled by federal electrification incentives that require domestic content in grid components. Utilities in the United States replace aging 1970s-era switchgear with digital units that absorb thousands of MLCCs per bay. New battery-backed solar farms across Texas and California specify high-voltage ceramic arrays that displace film bank designs, boosting regional dollar volume of the power and utilities MLCC market.
Europe posts steady growth under the Green Deal mandate and REPowerEU energy-security plan. Utilities deploy dynamic line rating sensors and HVDC links from Scandinavia to continental load centers, elevating MLCC demand in harsh-weather nodes. Brexit prompts U.K. grid operators to diversify sourcing, creating pilot orders for North American MLCC newcomers. Elsewhere, Latin America, the Middle East, and Africa witness incremental uptake as electrification of remote communities spurs compact inverter rollouts; these price-sensitive markets often adopt previous-generation MLCC lines, balancing cost and reliability.

Competitive Landscape
The power and utilities MLCC market remains concentrated, with a handful of Japanese conglomerates controlling the high-reliability supply chain. TDK invested USD 1.4 billion in 2024 to expand capacity and secure upstream ceramic-powder feedstock, reinforcing its vertical integration advantage. Murata followed with a 1000 µF breakthrough that challenges film capacitors in DC-link roles. Samsung Electro-Mechanics scaled its high-voltage lines by 30%, carving share in the fast-charging and renewable niches.
Technology rivalry centers on dielectric chemistry, electrode metallurgy, and vibration-proof packaging. Patent portfolios act as defensive moats, prolonging qualification hurdles for emerging players. End-user utilities require two-year field pilots before full adoption, which cements incumbents’ position and keeps the overall switching cost high. Smaller firms like Kyocera AVX and TAIYO YUDEN target niche high-temperature or ultra-low ESL pockets, often collaborating with OEMs on custom stacks.
Strategic movements also involve regional manufacturing footprints. Several leaders announce U.S. and European pilot lines to capture government incentives tied to domestic sourcing. Partnerships with grid OEMs accelerate co-development of SiC/GaN-ready MLCCs, aligning product roadmaps with next-generation power semiconductors. Collectively, these actions maintain a steep learning curve that deters commoditization.
Power And Utilities MLCC Industry Leaders
Kyocera AVX Components Corporation (Kyocera Corporation)
Taiyo Yuden Co., Ltd
Yageo Corporation
Samsung Electro-Mechanics Co., Ltd.
Murata Manufacturing Co., Ltd.
- *Disclaimer: Major Players sorted in no particular order

Recent Industry Developments
- October 2024: TDK Corporation announced a USD 1.4 billion expansion to scale global MLCC capacity, prioritizing automotive and industrial demand including utility converters.
- September 2024: Murata Manufacturing unveiled 1000 µF MLCCs that rival electrolytic capacitors in inverter DC-link roles.
- August 2024: Samsung Electro-Mechanics increased automotive and power MLCC output by 30%, adding high-voltage specialty lines.
- July 2024: Kyocera AVX launched a high-capacitance line with enhanced temperature stability for outdoor substations.


Global Power And Utilities MLCC Market Report Scope
1210, 1812, 2 220, 3 640, 4 540, Others are covered as segments by Case Size. 600V to 1100V, Less than 600V, More than 1100V are covered as segments by Voltage. 10 μF to 100 μF, Less than 10 μF, More than 100 μF are covered as segments by Capacitance. Class 1, Class 2 are covered as segments by Dielectric Type. Asia-Pacific, Europe, North America are covered as segments by Region.| Class 1 |
| Class 2 |
| 201 |
| 402 |
| 603 |
| 1005 |
| 1210 |
| Other Case Sizes |
| Low Voltage (less than or equal to 100 V) |
| Mid Voltage (100 – 500 V) |
| High Voltage (above 500 V) |
| Metal Cap |
| Radial Lead |
| Surface Mount |
| North America | United States |
| Rest of North America | |
| Europe | Germany |
| United Kingdom | |
| Rest of Europe | |
| Asia-Pacific | China |
| India | |
| Japan | |
| South Korea |
| By Dielectric Type | Class 1 | |
| Class 2 | ||
| By Case Size | 201 | |
| 402 | ||
| 603 | ||
| 1005 | ||
| 1210 | ||
| Other Case Sizes | ||
| By Voltage | Low Voltage (less than or equal to 100 V) | |
| Mid Voltage (100 – 500 V) | ||
| High Voltage (above 500 V) | ||
| By MLCC Mounting Type | Metal Cap | |
| Radial Lead | ||
| Surface Mount | ||
| By Geography | North America | United States |
| Rest of North America | ||
| Europe | Germany | |
| United Kingdom | ||
| Rest of Europe | ||
| Asia-Pacific | China | |
| India | ||
| Japan | ||
| South Korea | ||


Market Definition
- MLCC (Multilayer Ceramic Capacitor) - A type of capacitor that consists of multiple layers of ceramic material, alternating with conductive layers, used for energy storage and filtering in electronic circuits.
- Voltage - The maximum voltage that a capacitor can safely withstand without experiencing breakdown or failure. It is typically expressed in volts (V)
- Capacitance - The measure of a capacitor's ability to store electrical charge, expressed in farads (F). It determines the amount of energy that can be stored in the capacitor
- Case Size - The physical dimensions of an MLCC, typically expressed in codes or millimeters, indicating its length, width, and height
| Keyword | Definition |
|---|---|
| MLCC (Multilayer Ceramic Capacitor) | A type of capacitor that consists of multiple layers of ceramic material, alternating with conductive layers, used for energy storage and filtering in electronic circuits. |
| Capacitance | The measure of a capacitor's ability to store electrical charge, expressed in farads (F). It determines the amount of energy that can be stored in the capacitor |
| Voltage Rating | The maximum voltage that a capacitor can safely withstand without experiencing breakdown or failure. It is typically expressed in volts (V) |
| ESR (Equivalent Series Resistance) | The total resistance of a capacitor, including its internal resistance and parasitic resistances. It affects the capacitor's ability to filter high-frequency noise and maintain stability in a circuit. |
| Dielectric Material | The insulating material used between the conductive layers of a capacitor. In MLCCs, commonly used dielectric materials include ceramic materials like barium titanate and ferroelectric materials |
| SMT (Surface Mount Technology) | A method of electronic component assembly that involves mounting components directly onto the surface of a printed circuit board (PCB) instead of through-hole mounting. |
| Solderability | The ability of a component, such as an MLCC, to form a reliable and durable solder joint when subjected to soldering processes. Good solderability is crucial for proper assembly and functionality of MLCCs on PCBs. |
| RoHS (Restriction of Hazardous Substances) | A directive that restricts the use of certain hazardous materials, such as lead, mercury, and cadmium, in electrical and electronic equipment. Compliance with RoHS is essential for automotive MLCCs due to environmental regulations |
| Case Size | The physical dimensions of an MLCC, typically expressed in codes or millimeters, indicating its length, width, and height |
| Flex Cracking | A phenomenon where MLCCs can develop cracks or fractures due to mechanical stress caused by bending or flexing of the PCB. Flex cracking can lead to electrical failures and should be avoided during PCB assembly and handling. |
| Aging | MLCCs can experience changes in their electrical properties over time due to factors like temperature, humidity, and applied voltage. Aging refers to the gradual alteration of MLCC characteristics, which can impact the performance of electronic circuits. |
| ASPs (Average Selling Prices) | The average price at which MLCCs are sold in the market, expressed in USD million. It reflects the average price per unit |
| Voltage | The electrical potential difference across an MLCC, often categorized into low-range voltage, mid-range voltage, and high-range voltage, indicating different voltage levels |
| MLCC RoHS Compliance | Compliance with the Restriction of Hazardous Substances (RoHS) directive, which restricts the use of certain hazardous substances, such as lead, mercury, cadmium, and others, in the manufacturing of MLCCs, promoting environmental protection and safety |
| Mounting Type | The method used to attach MLCCs to a circuit board, such as surface mount, metal cap, and radial lead, which indicates the different mounting configurations |
| Dielectric Type | The type of dielectric material used in MLCCs, often categorized into Class 1 and Class 2, representing different dielectric characteristics and performance |
| Low-Range Voltage | MLCCs designed for applications that require lower voltage levels, typically in the low voltage range |
| Mid-Range Voltage | MLCCs designed for applications that require moderate voltage levels, typically in the middle range of voltage requirements |
| High-Range Voltage | MLCCs designed for applications that require higher voltage levels, typically in the high voltage range |
| Low-Range Capacitance | MLCCs with lower capacitance values, suitable for applications that require smaller energy storage |
| Mid-Range Capacitance | MLCCs with moderate capacitance values, suitable for applications that require intermediate energy storage |
| High-Range Capacitance | MLCCs with higher capacitance values, suitable for applications that require larger energy storage |
| Surface Mount | MLCCs designed for direct surface mounting onto a printed circuit board (PCB), allowing for efficient space utilization and automated assembly |
| Class 1 Dielectric | MLCCs with Class 1 dielectric material, characterized by a high level of stability, low dissipation factor, and low capacitance change over temperature. They are suitable for applications requiring precise capacitance values and stability |
| Class 2 Dielectric | MLCCs with Class 2 dielectric material, characterized by a high capacitance value, high volumetric efficiency, and moderate stability. They are suitable for applications that require higher capacitance values and are less sensitive to capacitance changes over temperature |
| RF (Radio Frequency) | It refers to the range of electromagnetic frequencies used in wireless communication and other applications, typically from 3 kHz to 300 GHz, enabling the transmission and reception of radio signals for various wireless devices and systems. |
| Metal Cap | A protective metal cover used in certain MLCCs (Multilayer Ceramic Capacitors) to enhance durability and shield against external factors like moisture and mechanical stress |
| Radial Lead | A terminal configuration in specific MLCCs where electrical leads extend radially from the ceramic body, facilitating easy insertion and soldering in through-hole mounting applications. |
| Temperature Stability | The ability of MLCCs to maintain their capacitance values and performance characteristics across a range of temperatures, ensuring reliable operation in varying environmental conditions. |
| Low ESR (Equivalent Series Resistance) | MLCCs with low ESR values have minimal resistance to the flow of AC signals, allowing for efficient energy transfer and reduced power losses in high-frequency applications. |


Research Methodology
Mordor Intelligence has followed the following methodology in all our MLCC reports.
- Step 1: Identify Data Points: In this step, we identified key data points crucial for comprehending the MLCC market. This included historical and current production figures, as well as critical device metrics such as attachment rate, sales, production volume, and average selling price. Additionally, we estimated future production volumes and attachment rates for MLCCs in each device category. Lead times were also determined, aiding in forecasting market dynamics by understanding the time required for production and delivery, thereby enhancing the accuracy of our projections.
- Step 2: Identify Key Variables: In this step, we focused on identifying crucial variables essential for constructing a robust forecasting model for the MLCC market. These variables include lead times, trends in raw material prices used in MLCC manufacturing, automotive sales data, consumer electronics sales figures, and electric vehicle (EV) sales statistics. Through an iterative process, we determined the necessary variables for accurate market forecasting and proceeded to develop the forecasting model based on these identified variables.
- Step 3: Build a Market Model: In this step, we utilized production data and key industry trend variables, such as average pricing, attachment rate, and forecasted production data, to construct a comprehensive market estimation model. By integrating these critical variables, we developed a robust framework for accurately forecasting market trends and dynamics, thereby facilitating informed decision-making within the MLCC market landscape.
- Step 4: Validate and Finalize: In this crucial step, all market numbers and variables derived through an internal mathematical model were validated through an extensive network of primary research experts from all the markets studied. The respondents are selected across levels and functions to generate a holistic picture of the market studied.
- Step 5: Research Outputs: Syndicated Reports, Custom Consulting Assignments, Databases, and Subscription Platform


