Mid Voltage MLCC Market Size and Share
Market Overview
| Study Period | 2020 - 2031 |
|---|---|
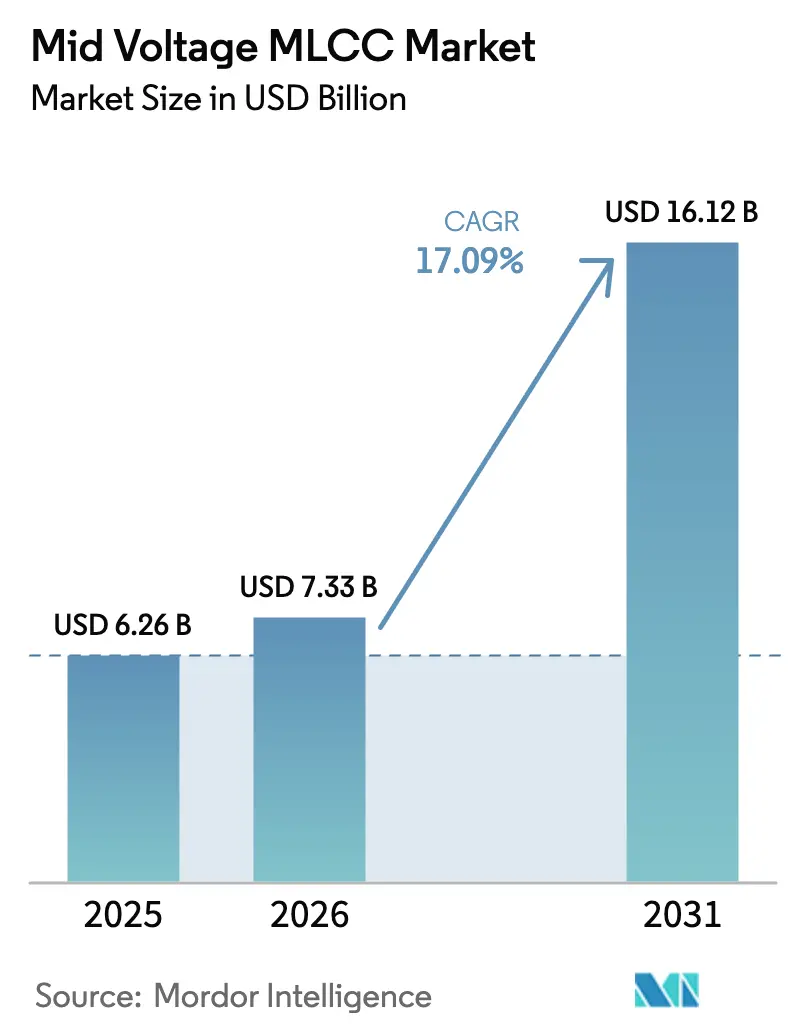
| Market Size (2026) | USD 7.33 Billion |
| Market Size (2031) | USD 16.12 Billion |
| Growth Rate (2026 - 2031) | 17.09% CAGR |
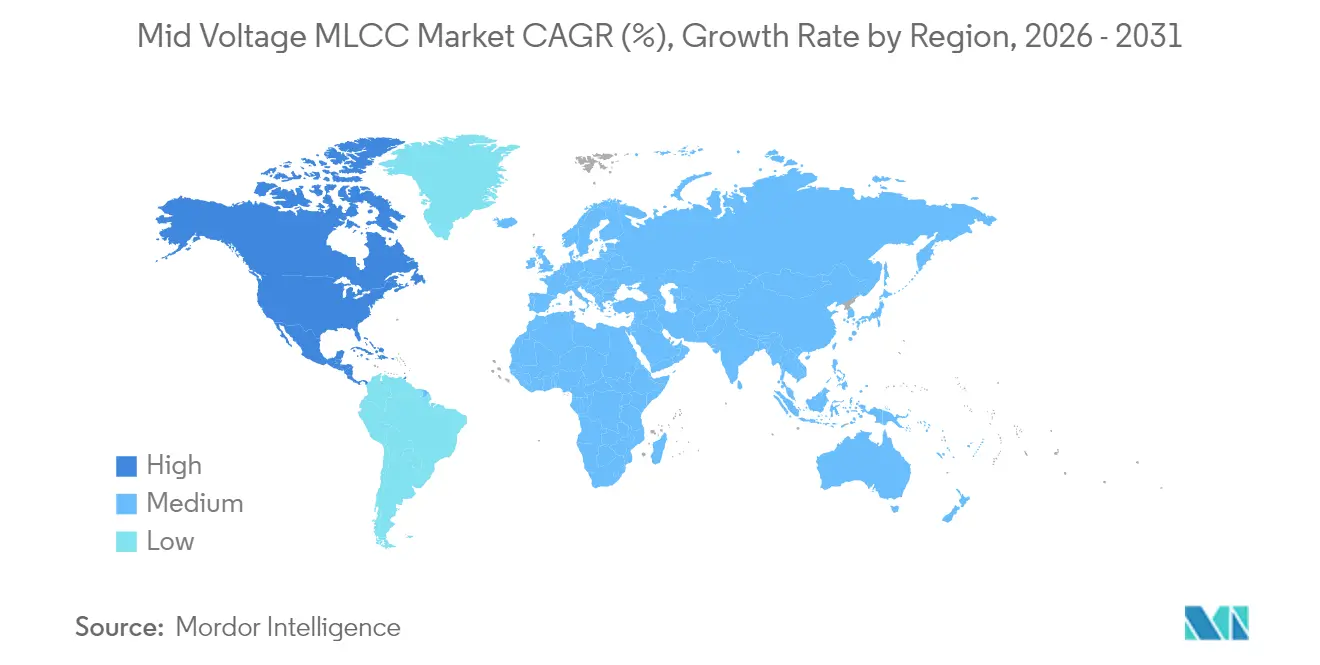
| Fastest Growing Market | North America |
| Largest Market | Asia-Pacific |
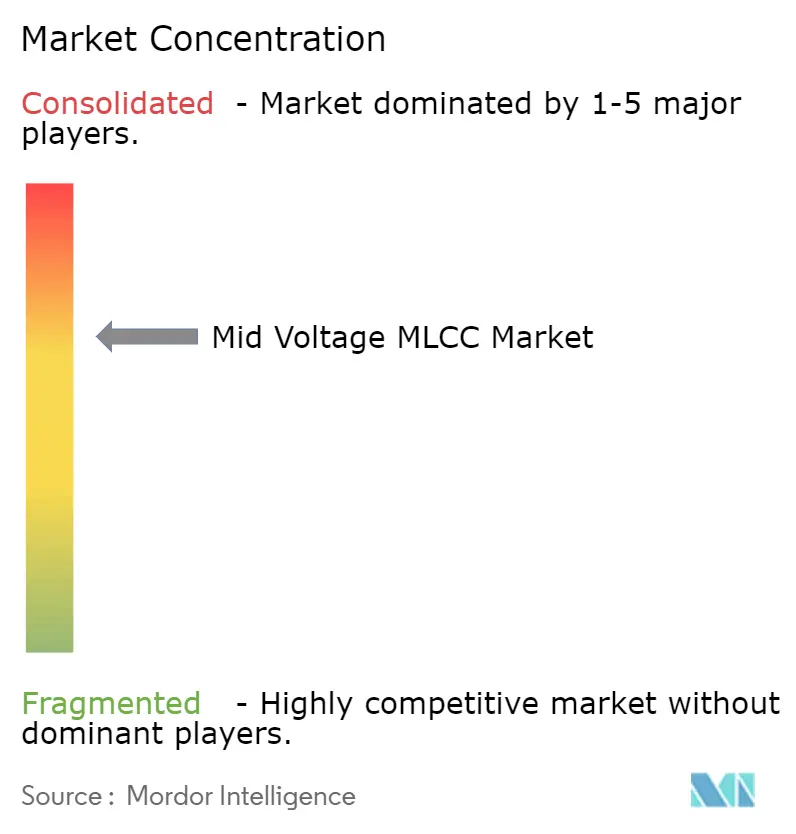
| Market Concentration | High |
Major Players*Disclaimer: Major Players sorted in no particular order Image © Mordor Intelligence. Reuse requires attribution under CC BY 4.0. | |
Mid Voltage MLCC Market Analysis by Mordor Intelligence
The mid voltage MLCC market size was valued at USD 6.26 billion in 2025 and estimated to grow from USD 7.33 billion in 2026 to reach USD 16.12 billion by 2031, at a CAGR of 17.09% during the forecast period (2026-2031). Rising electric-vehicle (EV) penetration, the migration of server power rails toward 48 V, and the broader shift to AI-centric datacenter architectures are simultaneously expanding the voltage window and the volume requirements that multilayer ceramic capacitors must meet. Automotive platforms alone now embed 12,000-18,000 MLCCs per vehicle, a three- to four-fold increase over internal-combustion designs, and more than half of those parts must be rated above 25 V to satisfy 48 V mild-hybrid subsystems. Datacenter operators are likewise standardizing on 48 V distribution to cut I²R losses, which elevates demand for mid-voltage decoupling capacitors able to combine high capacitance with compact footprints. Regional industrial policies add momentum; the U.S. CHIPS Act’s 25% manufacturing tax credit is incentivizing fresh North American capacity that shortens supply chains and improves long-term sourcing resilience.
Key Report Takeaways
- By dielectric type, Class 1 devices commanded 61.78% share of the 2025 Mid Voltage MLCC market size and are expected to grow at an 18.18% CAGR over the forecast period.
- By case size, 201 parts captured 55.05% share in 2025 in the Mid Voltage MLCC market; 402 components are advancing at an 17.97% CAGR owing to a better balance between miniaturization and yield.
- By mounting format, surface-mount parts held 40.12% share in 2025 in the Mid Voltage MLCC market, whereas metal-cap/stacked variants register the fastest CAGR at 17.88% thanks to superior vibration tolerance.
- By end-user application, consumer electronics led with 50.72% revenue share in 2025 in the Mid Voltage MLCC market; automotive is projected to expand at an 18.62% CAGR to 2031.
- By geography, Asia-Pacific accounted for 57.12% of the Mid Voltage MLCC market share in 2025, while North America is poised for the highest regional CAGR at 17.95% through 2031.
Note: Market size and forecast figures in this report are generated using Mordor Intelligence’s proprietary estimation framework, updated with the latest available data and insights as of 2026.
Global Mid Voltage MLCC Market Trends and Insights
Drivers Impact Analysis*
| Driver | (~) % Impact on CAGR Forecast | Geographic Relevance | Impact Timeline |
|---|---|---|---|
| EV and xEV proliferation elevates MLCC content/vehicle | +4.2% | Global, Asia-Pacific and North America | Medium term (2-4 years) |
| 48 V automotive subsystems shift demand to 100 V class parts | +3.8% | Global automotive | Medium term (2-4 years) |
| 5G/AI server DDR5 VRMs require above 25 V, high-µF MLCCs | +3.1% | Data-center hubs | Short term (≤ 2 years) |
| AI/datacenter power rails move to 48 V to mid-V decoupling | +2.9% | Global | Short term (≤ 2 years) |
| Government incentives for regional passive-component reshoring | +2.1% | North America, Europe | Long term (≥ 4 years) |
| Thin-film and shield electrode tech boosts CV/size ratio | +1.1% | Global tech leaders | Long term (≥ 4 years) |
| Source: Mordor Intelligence | |||


EV and xEV Proliferation Elevates MLCC Content per Vehicle
Electrified powertrains need 12,000-18,000 capacitors, up from 3,000-10,000 in gasoline cars, translating into a direct volume multiplier for the Mid Voltage MLCC market.[1]Samsung Electro-Mechanics, “Automotive and Server MLCC Roadmap,” samsungsem.com High-density battery-management systems, on-board chargers, and 48 V DC-DC converters all run at operating voltages that a traditional low-voltage capacitor cannot withstand. Demand is also tilting toward AEC-Q200-qualified parts, which carry higher margins and stringent reliability metrics. TDK’s 100 V, 10 µF 3225 MLCC showcases how suppliers are converging high capacitance and high voltage to reduce component counts per board.[2]TDK Corporation, “Press Release: 100 V Automotive MLCC,” tdk.com With EV penetration accelerating in China, Europe, and the U.S., the content-per-vehicle uplift drives both unit growth and average selling price expansion.
48 V Automotive Subsystems Shift Demand to 100 V Class Parts
A global move from 12 V to 48 V electrical backbones delivers lighter wiring harnesses and greater power efficiency. However, it also forces designers to specify capacitors rated at least twice the bus voltage for safety margin, making 50 V-100 V MLCCs indispensable. TDK’s new 100 V automotive series doubles capacitance in the same footprint by blending optimized dielectrics with a redesigned electrode stack. Luxury sedans, pickup trucks, and even light commercial vehicles are embracing the 48 V standard, ensuring a wide field of addressable platforms. Component suppliers that already master nickel-electrode chemistry and X7R stability are capitalizing, whereas newcomers face multi-year qualification hurdles.
5G/AI Server DDR5 VRMs Require Above 25 V, High-µF MLCCs
The migration to DDR5 memory raises rail voltages and switching frequencies, so voltage-regulator modules demand capacitors that marry high capacitance with low ESL at above 25 V ratings. Samsung Electro-Mechanics rolled out a tailored 25 V series for DDR5 decoupling, citing the need to tame power-delivery noise in AI servers. These servers also feature GPUs that generate step-load transients exceeding 800 A/µs, positioning MLCCs as the first line of defense against voltage sags. Continuous uptime expectations in cloud datacenters further tighten lifetime and failure-rate specifications, amplifying the value of automotive-grade reliability in the computing aisle.
AI/Datacenter Power Rails Move to 48 V to Mid-V Decoupling
Hyperscalers now deploy 48 V distribution at the rack level, which cuts copper weight and boosts efficiency but obliges every board-level buck stage to confront a higher input voltage. Mid-voltage MLCCs situated close to CPU and accelerator packages must absorb switching spikes without adding inductive penalties. Thin-film embedded capacitors from TDK achieve sub-50 µm thickness and minimal ESL, letting designers place them directly beneath ICs for sub-nanosecond response. The approach sustains high power density while satisfying thermal budgets that have tightened as silicon reaches 700 W per package.
Restraints Impact Analysis*
| Restraint | (~) % Impact on CAGR Forecast | Geographic Relevance | Impact Timeline |
|---|---|---|---|
| Chronic supply shortages and above 30-week lead-times | -2.8% | Global, particularly affecting automotive supply chains | Medium term (2-4 years) |
| Raw-material price volatility (Ni, Pd, Ag) | -2.1% | Global manufacturing regions | Short term (≤ 2 years) |
| Yield losses when thinning dielectric less than 0.5 µm at above 100V | -1.4% | APAC manufacturing centers, technology leaders | Long term (≥ 4 years) |
| Micro-cracking risk in high-vibration e-powertrain zones | -0.9% | Global automotive markets | Medium term (2-4 years) |
| Source: Mordor Intelligence | |||
Chronic Supply Shortages and above 30-Week Lead-Times
Mid-voltage MLCC lines run on specialized pastes, longer sintering cycles, and elevated test criteria, so capacity is harder to flex upward quickly. When AEC-Q200 lots slip, carmakers cannot qualify drop-in alternates, prompting build-stops that echo across OEM pipelines. Samsung Electro-Mechanics’ December-2024 inventory correction revealed how rapidly demand swings can strand capacity, yet the firm still cited eight-month order visibility for 100 V automotive grades. With only a handful of global vendors certified for high-reliability supply, customers must either dual-source early or carry costly buffer stock.
Raw-Material Price Volatility (Ni, Pd, Ag)
Palladium touched multi-year highs before sliding in mid-2024, but every 10 USD/oz move shifts MLCC electrode cost models materially. The World Platinum Investment Council forecasts 1,387 koz of palladium for electronics in 2025 and cautions that any rebound would squeeze margins or trigger price-list surcharges. Nickel-electrode migration mitigates precious-metal exposure yet raises oxidation-control expenses during sintering. Suppliers hesitate to hedge fully, so ASPs remain partially indexed to spot metals, complicating long-term agreements in automotive and telecom contracts.
*Our forecasts treat driver/restraint impacts as directional, not additive. The impact forecasts reflect baseline growth, mix effects, and variable interactions.
Segment Analysis
By Dielectric Type: Class 1 Dominates Through Stability Advantages
Class 1 parts represented 61.78% of the mid voltage MLCC market in 2025, anchored by their C0G and NP0 temperature coefficients that cap capacitance drift and dielectric loss over –55 °C to +125 °C profiles. The segment is projected to record an 18.18% CAGR through 2031 as EV inverters and lidar modules prioritize phase-accuracy and low ESR. The mid voltage MLCC market size for Class 1 capacitors is on track to add USD 5.96 billion between 2026 and 2031, underscoring how stability now carries monetizable value. Next-generation barium-titanate chemistries laced with calcium achieve breakdown strengths above 170 V/µm while preserving permittivity, extending the feasible layer count per chip.
Class 2 devices keep shipping in bulk for bulk-decoupling roles yet cede share in design-win counts where tolerance and aging undermine closed-loop accuracy. Hybrid stacks that pair Class 1 and Class 2 inside the same package surface as a mitigation, letting OEMs co-optimize footprint and precision without multiple placements. Vendors able to mass-produce ultra-thin C0G layers below 0.8 µm hold a differentiating advantage as voltage ratings climb beyond 100 V.


By Case Size: Miniaturization Drives 402 Growth
In 2025, 201 chips still made up 55.05% of shipments, as smartphones and wearables continue to dominate unit counts. However, the 402 outline logs an 17.97% CAGR to 2031, capturing designs where higher voltage or capacitance justifies a slightly larger pad. The mid voltage MLCC market size attached to 402 packages is poised to exceed USD 2.48 billion by 2031 as automotive body electronics and gateway ECUs standardize on the form factor. Murata’s mass production of a 47 µF 0402 capacitor demonstrates the enduring appetite for extreme miniaturization; however, yield drops sharply when the dielectric thickness approaches 0.5 µm.
Design engineers now deploy “right-sized” footprints rather than defaulting to the smallest possible pads, because vibration, solder-joint fatigue, and reflow warpage outweigh board-area savings in harsh-duty environments. Consequently, 603 and 1210 sizes remain entrenched in DC-link and snubber roles where 630 V ratings are mandatory.
By Mounting Type: Surface-Mount Leads Despite Metal-Cap Growth
Surface-mount technology (SMT) keeps a 40.12% hold on shipment value because pick-and-place infrastructure and panelized reflow drive cost efficiency. Still, metal-cap/stacked packages sprint at an 17.88% CAGR because they dissipate heat better and absorb vibration loads. The mid voltage MLCC market size tied to metal-cap variants jumps from USD 848.7 million in 2026 to nearly USD 1.93 billion in 2031 as under-hood ECUs and traction inverter boards migrate en masse. Radial leads linger for aerospace harnesses that specify additional creepage distances, but volumes are modest relative to SMT.
Package innovation now targets polymer end-termination layers that cut conductive-filament risk when boards flex. Suppliers able to certify such ruggedized terminations under AEC-Q200 Rev E secure sticky, decade-long revenue streams.

By End-User Application: Automotive Growth Outpaces Consumer Electronics
Consumer electronics captured 50.72% of the 2025 value, yet its forward CAGR trails at single digits as handset refresh cycles lengthen. Automotive grows 18.62% on the tailwind of EV adoption, eventually absorbing an 80 USD share of the average battery-electric vehicle’s BOM for MLCC alone. The mid voltage MLCC market size for automotive is forecast to swell from USD 2.02 billion in 2026 to over USD 4.7 billion by 2031 as zonal architectures and battery-management redundancy augment component counts. Industrial automation and renewable-energy inverters are expected to together exceed USD 1 billion by mid-decade, underpinned by strict uptime contracts that favor high-reliability grades.
Telecom base stations and edge nodes rebuild inventories as 5G rollouts mature, and power and utilities players deploy medium-voltage switchgear that still relies on ceramic capacitors for snubber networks.
Geography Analysis
Asia-Pacific held 57.12% of mid voltage MLCC market revenue in 2025 on the strength of a dense supplier ecosystem in Japan, South Korea, and China. Japanese incumbents, such as Murata and TDK, guard critical know-how in nickel-electrode processing and nano-sized barium-titanate slurry preparation, allowing them to ship parts with failure-in-time values below 0.5 ppm. South Korea leverages its scale in consumer electronics and a growing EV supply chain to internalize demand, while China’s state subsidies accelerate fab buildouts aimed at reducing import dependence in passenger EV platforms.
North America, although with only 11.76% of 2025 shipments, posts the fastest 17.95% CAGR through 2031. The CHIPS Act’s tax incentives reduce capital payback by roughly four years on new passive-component fabs, tempting Asian leaders to establish localized lines for automotive and defense customers. Detroit automakers now stipulate a minimum 20% North American sourcing ratio for safety-critical capacitors starting with 2027 model years, amplifying urgency. Datacenter clusters in Virginia, Texas, and Arizona additionally underpin volume, as every AI rack can host over 5,000 mid-voltage capacitors. Europe remains steady as German, French, and Nordic automakers pursue 800 V powertrains that need small yet rugged snubber capacitors across inverter legs. Renewable-energy build-outs, from offshore wind to utility-scale storage, keep factory utilization elevated for X7R grades rated 630 V. Rest-of-World regions, South America, Middle East, and Africa, trail on share but gain relevance as tier-one suppliers expand after-sales service hubs to trim logistics costs and shorten RMAs.

Competitive Landscape
The mid voltage MLCC market exhibits moderate concentration, with the top five vendors accounting for roughly 76% of the combined 2024 revenue, driven by Murata, TDK, Samsung Electro-Mechanics, Kyocera-AVX, and Taiyo Yuden. Technology leadership centers on dielectric formulation, ultra-thin layering, and automated optical inspection; these intangibles are shielded by years of tacit knowledge and high capital barriers. Murata’s July 2025 jump to mass-producing a 47 µF 0402 chip trimmed board area by 60%, raising the bar for volumetric efficiency. TDK earmarks 30% of its three-year USD 4.7 billion capex for passive-component expansion, with half devoted to automotive lines. Samsung Electro-Mechanics is leveraging AI-driven process control to improve yield on 100V-class parts and raise blended ASPs by mid-single digits in Q4 2024, driven by an enriched automotive mix.
Chinese entrants, Yageo, Fenghua, and Sanan, scale their domestic capacity aggressively, buoyed by provincial grants that cover up to 20% of the equipment cost. Yet penetrating safety-critical tiers remains challenging due to extended PPAP cycles and field-failure traceability demands. Niche specialists, primarily in Europe and the U.S., focus on aerospace, implantable medical, and oil downhole applications where lot-traceability and radiation performance outweigh unit cost.
Competitive thrust has migrated from pure price to packaging differentiation such as metal-cap and embedded-substrate solutions that handle high ripple current while mitigating board flex. Suppliers able to integrate simulation-to-silicon workflows shorten design-in cycles, further consolidating share around incumbents.
Mid Voltage MLCC Industry Leaders
Taiyo Yuden Co., Ltd
TDK Corporation
Yageo Corporation
Samsung Electro-Mechanics Co., Ltd.
Murata Manufacturing Co., Ltd.
- *Disclaimer: Major Players sorted in no particular order

Recent Industry Developments
- July 2025: Murata Manufacturing began the world’s first mass production of a 47 µF MLCC in the 0402-inch case, shrinking mounting area by 60% versus an equivalent 0603 part while targeting AI server thermal envelopes.
- April 2025: TDK Corporation introduced a 100 V, 10 µF automotive MLCC in 3225 size with AEC-Q200 qualification, doubling capacitance compared with its prior generation and focusing on 48 V mild-hybrid converters.
- February 2025: TDK confirmed passive-component net sales of JPY 565.6 billion for FY 2024 and allocated 30% of its three-year JPY 700 billion capex plan to expand MLCC lines for EV and AI server demand.
- January 2025: Samsung Electro-Mechanics reported Q4 2024 component-division revenue of KRW 1,081.8 billion with automotive MLCC shipments growing high single digits quarter-over-quarter, citing qualification premiums.


Global Mid Voltage MLCC Market Report Scope
Class 1, Class 2 are covered as segments by Dielectric Type. 201, 402, 603, 1005, 1210, Others are covered as segments by Case Size. High-Range Capacitance, Low-Range Capacitance, Mid-Range Capacitance are covered as segments by Capacitance. Metal Cap, Radial Lead, Surface Mount are covered as segments by Mlcc Mounting Type. Aerospace and Defence, Automotive, Consumer Electronics, Industrial, Medical Devices, Power and Utilities, Telecommunication, Others are covered as segments by End User. Asia-Pacific, Europe, North America are covered as segments by Region.
| Class 1 |
| Class 2 |
| 201 |
| 402 |
| 603 |
| 1005 |
| 1210 |
| Other Case Sizes |
| Surface-Mount |
| Radial Lead |
| Metal-Cap/Stacked |
| Automotive |
| Consumer Electronics |
| Industrial |
| Telecommunication |
| Power and Utilities |
| Aerospace and Defence |
| Medical Devices |
| Other End-User Applications |
| North America | United States |
| Rest of North America | |
| Europe | Germany |
| United Kingdom | |
| Rest of Europe | |
| Asia-Pacific | China |
| India | |
| Japan | |
| South Korea | |
| Rest of Asia-Pacific | |
| Rest of the World |
| By Dielectric Type | Class 1 | |
| Class 2 | ||
| By Case Size | 201 | |
| 402 | ||
| 603 | ||
| 1005 | ||
| 1210 | ||
| Other Case Sizes | ||
| By Mounting Type | Surface-Mount | |
| Radial Lead | ||
| Metal-Cap/Stacked | ||
| By End-User Application | Automotive | |
| Consumer Electronics | ||
| Industrial | ||
| Telecommunication | ||
| Power and Utilities | ||
| Aerospace and Defence | ||
| Medical Devices | ||
| Other End-User Applications | ||
| By Geography | North America | United States |
| Rest of North America | ||
| Europe | Germany | |
| United Kingdom | ||
| Rest of Europe | ||
| Asia-Pacific | China | |
| India | ||
| Japan | ||
| South Korea | ||
| Rest of Asia-Pacific | ||
| Rest of the World | ||


Market Definition
- MLCC (Multilayer Ceramic Capacitor) - A type of capacitor that consists of multiple layers of ceramic material, alternating with conductive layers, used for energy storage and filtering in electronic circuits.
- Voltage - The maximum voltage that a capacitor can safely withstand without experiencing breakdown or failure. It is typically expressed in volts (V)
- Capacitance - The measure of a capacitor's ability to store electrical charge, expressed in farads (F). It determines the amount of energy that can be stored in the capacitor
- Case Size - The physical dimensions of an MLCC, typically expressed in codes or millimeters, indicating its length, width, and height
| Keyword | Definition |
|---|---|
| MLCC (Multilayer Ceramic Capacitor) | A type of capacitor that consists of multiple layers of ceramic material, alternating with conductive layers, used for energy storage and filtering in electronic circuits. |
| Capacitance | The measure of a capacitor's ability to store electrical charge, expressed in farads (F). It determines the amount of energy that can be stored in the capacitor |
| Voltage Rating | The maximum voltage that a capacitor can safely withstand without experiencing breakdown or failure. It is typically expressed in volts (V) |
| ESR (Equivalent Series Resistance) | The total resistance of a capacitor, including its internal resistance and parasitic resistances. It affects the capacitor's ability to filter high-frequency noise and maintain stability in a circuit. |
| Dielectric Material | The insulating material used between the conductive layers of a capacitor. In MLCCs, commonly used dielectric materials include ceramic materials like barium titanate and ferroelectric materials |
| SMT (Surface Mount Technology) | A method of electronic component assembly that involves mounting components directly onto the surface of a printed circuit board (PCB) instead of through-hole mounting. |
| Solderability | The ability of a component, such as an MLCC, to form a reliable and durable solder joint when subjected to soldering processes. Good solderability is crucial for proper assembly and functionality of MLCCs on PCBs. |
| RoHS (Restriction of Hazardous Substances) | A directive that restricts the use of certain hazardous materials, such as lead, mercury, and cadmium, in electrical and electronic equipment. Compliance with RoHS is essential for automotive MLCCs due to environmental regulations |
| Case Size | The physical dimensions of an MLCC, typically expressed in codes or millimeters, indicating its length, width, and height |
| Flex Cracking | A phenomenon where MLCCs can develop cracks or fractures due to mechanical stress caused by bending or flexing of the PCB. Flex cracking can lead to electrical failures and should be avoided during PCB assembly and handling. |
| Aging | MLCCs can experience changes in their electrical properties over time due to factors like temperature, humidity, and applied voltage. Aging refers to the gradual alteration of MLCC characteristics, which can impact the performance of electronic circuits. |
| ASPs (Average Selling Prices) | The average price at which MLCCs are sold in the market, expressed in USD million. It reflects the average price per unit |
| Voltage | The electrical potential difference across an MLCC, often categorized into low-range voltage, mid-range voltage, and high-range voltage, indicating different voltage levels |
| MLCC RoHS Compliance | Compliance with the Restriction of Hazardous Substances (RoHS) directive, which restricts the use of certain hazardous substances, such as lead, mercury, cadmium, and others, in the manufacturing of MLCCs, promoting environmental protection and safety |
| Mounting Type | The method used to attach MLCCs to a circuit board, such as surface mount, metal cap, and radial lead, which indicates the different mounting configurations |
| Dielectric Type | The type of dielectric material used in MLCCs, often categorized into Class 1 and Class 2, representing different dielectric characteristics and performance |
| Low-Range Voltage | MLCCs designed for applications that require lower voltage levels, typically in the low voltage range |
| Mid-Range Voltage | MLCCs designed for applications that require moderate voltage levels, typically in the middle range of voltage requirements |
| High-Range Voltage | MLCCs designed for applications that require higher voltage levels, typically in the high voltage range |
| Low-Range Capacitance | MLCCs with lower capacitance values, suitable for applications that require smaller energy storage |
| Mid-Range Capacitance | MLCCs with moderate capacitance values, suitable for applications that require intermediate energy storage |
| High-Range Capacitance | MLCCs with higher capacitance values, suitable for applications that require larger energy storage |
| Surface Mount | MLCCs designed for direct surface mounting onto a printed circuit board (PCB), allowing for efficient space utilization and automated assembly |
| Class 1 Dielectric | MLCCs with Class 1 dielectric material, characterized by a high level of stability, low dissipation factor, and low capacitance change over temperature. They are suitable for applications requiring precise capacitance values and stability |
| Class 2 Dielectric | MLCCs with Class 2 dielectric material, characterized by a high capacitance value, high volumetric efficiency, and moderate stability. They are suitable for applications that require higher capacitance values and are less sensitive to capacitance changes over temperature |
| RF (Radio Frequency) | It refers to the range of electromagnetic frequencies used in wireless communication and other applications, typically from 3 kHz to 300 GHz, enabling the transmission and reception of radio signals for various wireless devices and systems. |
| Metal Cap | A protective metal cover used in certain MLCCs (Multilayer Ceramic Capacitors) to enhance durability and shield against external factors like moisture and mechanical stress |
| Radial Lead | A terminal configuration in specific MLCCs where electrical leads extend radially from the ceramic body, facilitating easy insertion and soldering in through-hole mounting applications. |
| Temperature Stability | The ability of MLCCs to maintain their capacitance values and performance characteristics across a range of temperatures, ensuring reliable operation in varying environmental conditions. |
| Low ESR (Equivalent Series Resistance) | MLCCs with low ESR values have minimal resistance to the flow of AC signals, allowing for efficient energy transfer and reduced power losses in high-frequency applications. |


Research Methodology
Mordor Intelligence has followed the following methodology in all our MLCC reports.
- Step 1: Identify Data Points: In this step, we identified key data points crucial for comprehending the MLCC market. This included historical and current production figures, as well as critical device metrics such as attachment rate, sales, production volume, and average selling price. Additionally, we estimated future production volumes and attachment rates for MLCCs in each device category. Lead times were also determined, aiding in forecasting market dynamics by understanding the time required for production and delivery, thereby enhancing the accuracy of our projections.
- Step 2: Identify Key Variables: In this step, we focused on identifying crucial variables essential for constructing a robust forecasting model for the MLCC market. These variables include lead times, trends in raw material prices used in MLCC manufacturing, automotive sales data, consumer electronics sales figures, and electric vehicle (EV) sales statistics. Through an iterative process, we determined the necessary variables for accurate market forecasting and proceeded to develop the forecasting model based on these identified variables.
- Step 3: Build a Market Model: In this step, we utilized production data and key industry trend variables, such as average pricing, attachment rate, and forecasted production data, to construct a comprehensive market estimation model. By integrating these critical variables, we developed a robust framework for accurately forecasting market trends and dynamics, thereby facilitating informed decision-making within the MLCC market landscape.
- Step 4: Validate and Finalize: In this crucial step, all market numbers and variables derived through an internal mathematical model were validated through an extensive network of primary research experts from all the markets studied. The respondents are selected across levels and functions to generate a holistic picture of the market studied.
- Step 5: Research Outputs: Syndicated Reports, Custom Consulting Assignments, Databases, and Subscription Platform


