
Pour Point Depressants Market Size and Share
Market Overview
| Study Period | 2020 - 2031 |
|---|---|
| Forecast Data Period | 2026 - 2031 |
| Historical Data Period | 2020 - 2024 |
| Growth Rate | 4.58 % |
| Fastest Growing Market | Asia Pacific |
| Largest Market | Asia Pacific |
| Market Concentration | Medium |
Major Players *Disclaimer: Major Players sorted in no particular order Image © Mordor Intelligence. Reuse requires attribution under CC BY 4.0. | |
Pour Point Depressants Market Analysis by Mordor Intelligence
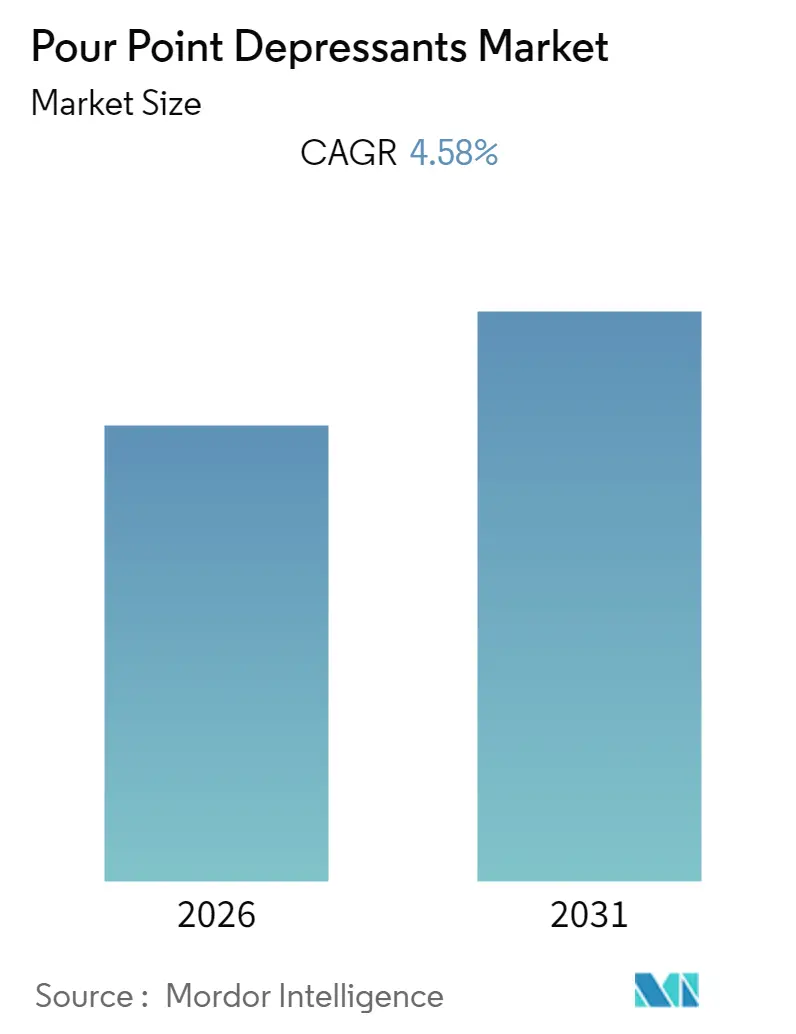
The Pour Point Depressants Market size is expected to register a CAGR of 4.58% during the forecast period.
- Refining of opportunity crude or heavy crude is expected to create new opportunities for the market to grow.
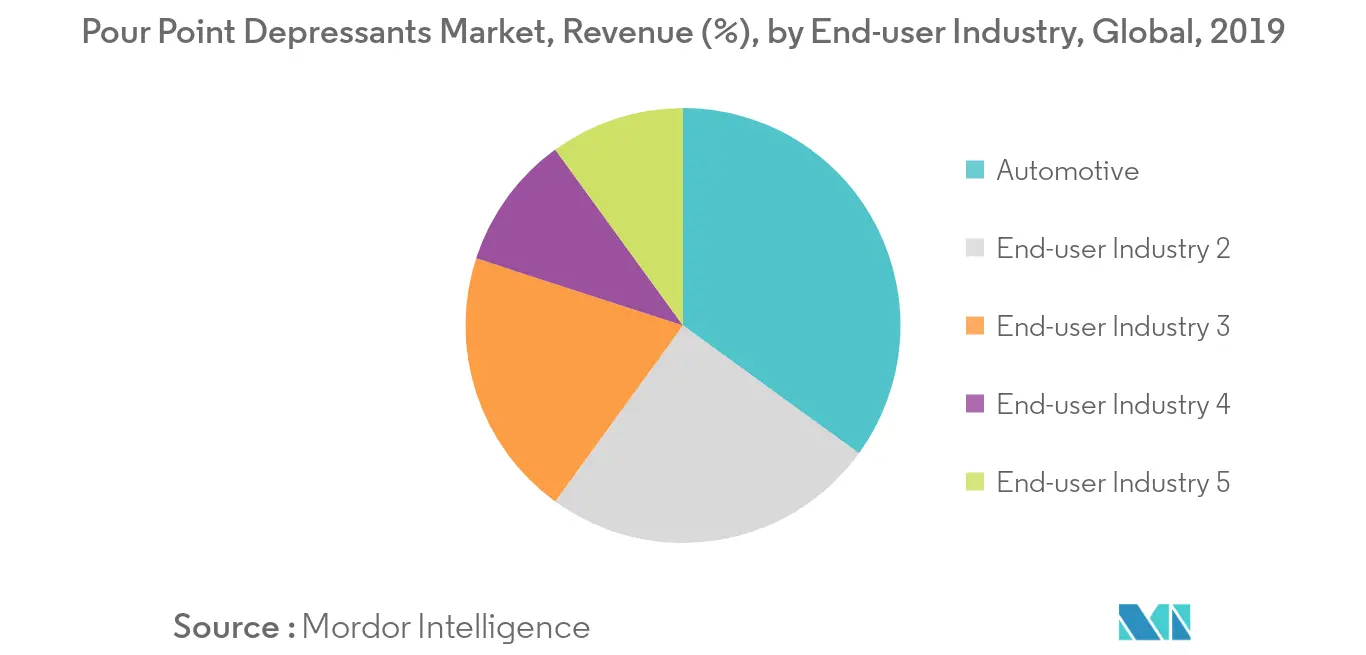
- The automotive industry is expected to dominate the end-user industry segment of the global pour point depressants market as it offers excellent high weather resistance and ability to control wax formation in lubricants at extremely low temperatures.
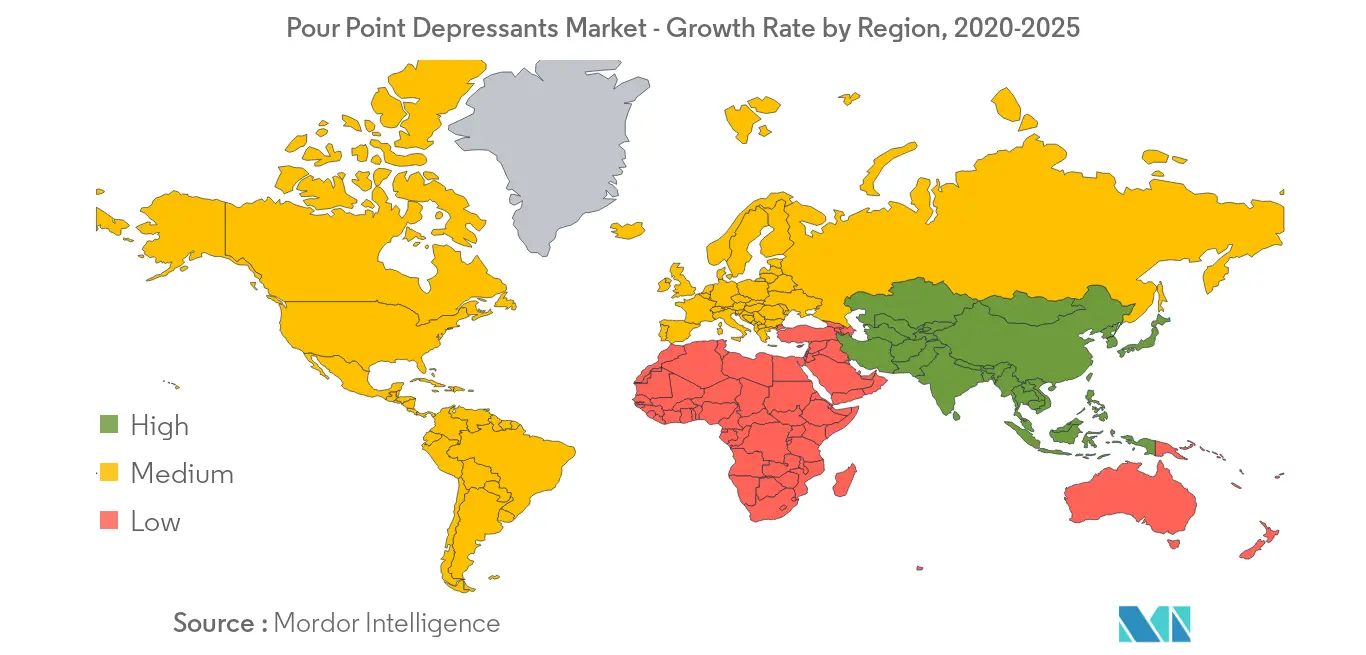
- Asia-Pacific region represents the largest market and is also expected to be the fastest-growing market over the forecast period owing to the consumption from countries such as China, India, and Japan.
Note: Market size and forecast figures in this report are generated using Mordor Intelligence’s proprietary estimation framework, updated with the latest available data and insights as of 2026.
Global Pour Point Depressants Market Trends and Insights
Growing Demand for High Quality Fuels and Lubricants
- Increasing consumer awareness regarding vehicle maintenance along with rising demand for oil additives in end-user industries such as aerospace & automotive is anticipated to create surge for the product.
- Also, growing demand for lubricants & high-quality fuels and large-scale industrialization is expected to accelerate the demand for pour point depressants market.
- Furthermore, the low manufacturing costs of the product will further boost the growth of the market.
- Pour point depressants exhibits properties of resisting high temperatures and control wax formation in lubricants at lower temperatures. The ability of a lubricant to flow under low temperature conditions is crucial for optimum performance of engines and equipment. Therefore, the product has significant demand and increasing opportunities from end-user industries like oil and gas, aviation and automotive thereby promoting market growth.
- Global automotive sales in 2019 surpassed over 91 million vehicles which creates tremendous growth opportunities for the product. Rising consumer awareness for maintenance of vehicles and increasing usage of fuel additives in several end user industries will further stimulate Pour Point Depressants Market growth.
Asia Pacific Region to Dominate the Market
- One of the key factors that has been rapid economic development and presence of large-scale vehicle manufacturing units and increasing consumption with rise in income levels of the masses.
- The application of pour point depressants in various end-user industries in the region is also boosting up the growth of the market, especially in China and other Asian countries. Pour point depressants is custom made as per the base oils. Similar applications may require different pour point depressants with regard to different product specifications.
- China holds the largest car production industry in the region as well globally. The country is anticipated to witness steady growth owing to increasing technological advancements allowing automotive manufacturers to advance the product innovation in pour point depressant products which is anticipated to surge the demand for lubricant additives for automotive in the region.
- Increasing oil extraction & production activities on account of increasing demand for crude oil derivatives like gasoline and diesel shall drive the product demand. Pour point depressants are set to witness extensive usage in oil & gas production machineries owing to their ability to pump oil effectively without having any severe change on the resultant product, thereby boosting the product demand in the region.
- China styrene esters pour point depressants demand for oil extraction purposes is projected to witness significant gains during the period. Exploration and production activities requires technologically advanced drilling equipment to attain optimum oil recovery. It has inclined major oil & gas companies to incorporate wax formation inhibitors in several drilling equipment thereby swelling the Pour Point Depressants Market growth.
Value Chain Analysis
The pour point depressants (PPDs) value chain starts with upstream petrochemical and specialty-chemical feedstocks and monomers used to make key chemistries such as poly alkyl methacrylates (PAMA), ethylene co-vinyl-acetate (EVA) polymers, styrene esters, and related copolymers. PPD manufacturing typically relies on controlled polymerization in reactors, followed by finishing steps (purification, drying, and blending into liquid concentrate packages suitable for dosing into fuels or lubricant base oils). Major additive suppliers active across this chain include BASF (pour point depressants within its fuel and lubricant solutions portfolio), Evonik (VISCOPLEX brand), Clariant (DODIFLOW portfolio), as well as The Lubrizol Corporation, Afton Chemical, and Croda International Plc.
Midstream and downstream demand comes from refiners, lubricant formulators, and oil and gas operators that incorporate PPDs into middle distillates, crude oil handling, and finished lubricants to manage wax crystallization and low-temperature flow. Distribution is typically handled through direct sales to large accounts and via regional distributors for smaller blenders, with technical service and application laboratories supporting cold-flow performance qualification based on base-oil composition and test methods. Differentiation and potential bottlenecks in the chain are closely tied to proprietary polymer technology, consistent quality control for performance-sensitive grades, and the availability of local technical support for customer-specific formulations and operating conditions.
Competitive Landscape
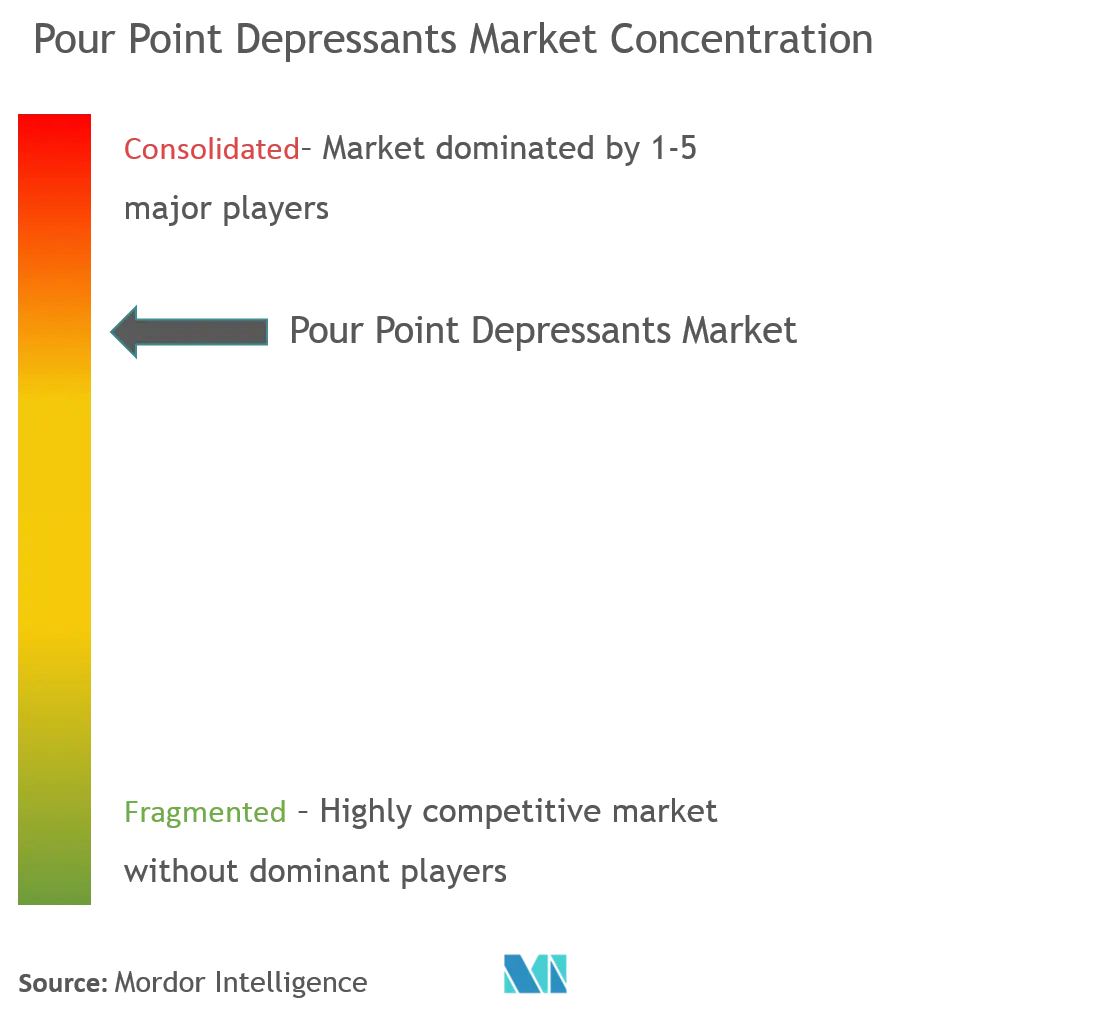
The Pour Point Depressants Market is partially consolidated in nature with a few major players dominating a significant portion of the market. Some of the major companies are Afton Chemical, Evonik Industries AG, The Lubrizol Corporation, Clariant and Croda International Plc and among others.
Pour Point Depressants Industry Leaders
-
Afton Chemical
-
Evonik Industries AG
-
The Lubrizol Corporation
-
Clariant
-
Croda International Plc
- *Disclaimer: Major Players sorted in no particular order
Market Opportunities and Future Outlook
Growth is tied to the need to maintain low-temperature operability in fuels and lubricants, while expanding feedstock flexibility across base oils and alternative streams. One commercialization pathway is the use of PPD technology to improve the handling and processing of non-traditional oils, including plastic-waste-derived pyrolysis oil, where Evonik has highlighted the use of its VISCOPLEX pour point depressants to optimize processing and handling. This creates a clearer lane for additive suppliers to package PPDs with technical services and testing support for customers evaluating more variable feedstock slates.
A second lever comes from tighter finished-lubricant performance requirements and the resulting re-formulation cycle for additive and base-oil systems. Suppliers are tailoring offerings to evolving engine-oil specifications such as ILSAC GF-7, with Evonik confirming VISCOPLEX PPD line compatibility for next-generation passenger car engine oils. Cross-technology solutions that pair additive use with refinery or process upgrades aimed at cold-flow improvement are also gaining visibility; for example, Evonik and Zeopore launched high-performance isodewaxing catalysts to improve cold-flow performance and yield for fuels and lubricants, which can support integrated cold-flow approaches where PPDs remain a formulation and operating-stage lever.
Recent Industry Developments
- April 2026: Evonik and Zeopore launched high-performance isodewaxing catalysts based on mesoporized zeolite technology to improve cold flow performance and yield for fuels and lubricants. The launch strengthens the toolkit for cold-flow management beyond additive-only approaches, supporting integrated solutions across refinery processing and finished-product formulation.
- March 2025: Evonik highlighted the use of its VISCOPLEX pour point depressant technology to optimize processing and handling of pyrolysis oil derived from plastic waste streams. This expands the addressable scope for PPDs into circular-economy feedstocks where variability and cold-flow issues can constrain downstream blending and use.
- February 2025: Evonik confirmed that its VISCOPLEX PPD product line is compliant with the ILSAC GF-7 engine oil specification. This supports lubricant formulators working on next-generation passenger car engine oils that require robust low-temperature performance, reinforcing PPD selection as part of GF-7-aligned additive packages.
Research Methodology Framework and Report Scope
Market Definition and Coverage
For this study, the pour point depressants market covers chemical additives blended into fuels, crude oil, and lubricants to improve low temperature flow behavior and help meet pour point related performance requirements.
Scope exclusions: The market count does not include non-PPD cold flow improvers, wax modifiers sold for non-hydrocarbon fluids, or broader lubricant additive packages where PPD pricing is not separable.
Segmentation Overview
- Chemistry Type
- Ethylene Co-Vinyl-Acetate
- Poly Alpha Olefin
- Poly Alkyl Methacrylates (PAMA)
- Styrene Esters
- Others
- End-user Industry
- Oil and Gas
- Automotive
- Industrial
- Marine
- Aviation
- Geography
- Asia-Pacific
- China
- India
- Japan
- South Korea
- Rest of Asia-Pacific
- North America
- United States
- Canada
- Mexico
- Europe
- Germany
- United Kingdom
- France
- Italy
- Rest of Europe
- South America
- Brazil
- Argentina
- Rest of South America
- Middle-East and Africa
- Saudi Arabia
- South Africa
- Rest of Middle-East and Africa
- Asia-Pacific
Data Sources, Market Sizing, and Validation
Desk Research
Desk research started by mapping where pour point depressants are used and how demand links back to fuel blending, crude transport, and lubricant production. We referenced public sources such as U.S. Energy Information Administration supply and refinery data, IEA oil market reports, OPEC statistical bulletins, and U.S. EPA diesel and fuel quality rulemaking notes where cold flow performance is discussed. For lubricant and additive context, we also used sources such as SAE technical papers, ASTM method references used for pour point testing, and national statistics portals that publish industrial output and trade summaries.
Next, company filings, investor presentations, and reputable press were reviewed to understand capacity additions, plant utilization direction, and mix shifts across base oils and finished lubricants. Patent databases were also checked for chemistry activity around EVA, PAMA, and related polymer systems, which helped confirm which chemistries are actively commercialized. Where available, we used paid subscriptions for company financials and intelligence, news and financials, and shipment-level import export signals to cross-check trade flows for relevant chemical intermediates. The source list shared here is illustrative, and we used additional public documents and data releases to clarify assumptions, validate trends, and fill gaps.
Primary Interviews and Surveys
Primary work focused on checking practical demand pool assumptions and the pricing logic, since public datasets rarely isolate pour point depressants on their own. We spoke with a mix of additive suppliers, lubricant blenders, fuel and refinery stakeholders, and distributors across major consuming regions, and then used the inputs to confirm mix by chemistry, typical treat rates, and how contracts are indexed through oil and polymer cost movement. When desk research inputs looked uncertain, we re-tested the assumptions through follow-up outreach so the final totals reflect real buying and blending behavior.
Distribution of primary research fieldwork respondents
| Company type | Respondent position | Region |
|---|---|---|
| Top tier: 27% | CXOs: 16% | APAC: 51% |
| Mid tier: 52% | Functional/Unit leaders: 26% | EMEA: 29% |
| Smaller Players: 21% | Managers: 58% | Americas: 20% |
Market-Sizing & Forecasting
The core sizing logic is a top-down build, where production, trade, and consumption indicators for fuels, crude logistics, and finished lubricants are reconstructed by region, then filtered through estimated adoption and average treat rates for pour point depressants. Once that demand pool is created, it is converted into value using region-specific average selling prices that reflect common contract structures and polymer feedstock pass-through timing.
To keep the totals realistic, we corroborated the outputs with selective bottom-up checks, such as supplier revenue splits where disclosed, channel checks on additive buying patterns, and sampled volume by application multiplied by indicative pricing bands. Key inputs used in the model include lubricant production and viscosity grade mix, diesel and heating fuel seasonal demand swings, crude waxiness and transport conditions that drive flow assurance needs, typical treat rate ranges by chemistry (EVA, PAMA, PAO, and styrene ester families), and the pace of regulatory and OEM-driven performance requirements. For forecasting, scenario analysis was applied around base oil mix shifts, refinery throughput direction, and pricing progression of polymer-based chemistries, and then scenarios were aligned to the consensus range shared by industry respondents. Where bottom-up views were incomplete for smaller countries, gaps were handled using regional per-ton intensity factors adjusted with local lubricant and fuel production signals.
Data Validation & Update Cycle
Validation is done in steps to keep the model aligned with observable industry signals. We compare the computed market totals against independent checks, including lubricant output direction, refinery throughput trends, and the implied additive intensity per ton, then investigate any sharp variance before sign-off. If an outlier appears, we re-check drivers, revisit conversion factors, and reconnect with contacts when the gap cannot be explained by a known market change.
Each report is refreshed annually, and interim updates are triggered when material changes occur, such as major capacity additions, sustained crude slate shifts, or unusual feedstock price moves that affect selling prices. Before delivery, a final analyst review is completed so clients receive the latest updated view, with assumptions remaining consistent across regions and applications.
Mordor Intelligence's Pour Point Depressants Market Size Compared Against Other Published Estimates
Published market values for pour point depressants can look far apart, even when the topic name is the same, because the counted products and the pricing logic are not always aligned. The biggest differences usually come from whether a stand-alone pour point depressant is counted versus what is bundled inside a larger additive package, and from whether fuel, crude flow assurance, and lubricants are all included.
Finished lubricant additive packages that bundle multiple functions sit outside Mordor Intelligence's scope for this market, which is why estimates that include full additive package revenue often land higher than a pour point depressant only revenue view. Another repeat gap comes from how treat rates are applied, since some sources assume a single average rate across applications, while actual usage changes by base oil mix, season, and the target pour point. Differences can also come from FX timing, whether prices are held constant or allowed to move with polymer and oil-linked indexation, plus how frequently the model is refreshed when refinery runs and lubricant output shift.
Benchmark comparison
| Source | Market Size | Gaps in Research Methodology |
|---|---|---|
| Mordor Intelligence | USD 1.96 B (2023) | |
| Trade Journal A | USD 2.90 B (2033) | Uses a longer-dated headline year and commonly mixes PPD demand with broader cold flow and additive package value, which inflates totals when compared to a PPD-only revenue view. |
| Industry Database B | USD 2.10 B (2025) | Leans heavily on a single base-year point and broad application labeling, with limited visibility on application-specific treat rates and regional ASP adjustments, thereby shifting the value upward. |
The table shows that most of the spread can be traced back to scope and conversion assumptions rather than a disagreement on demand direction. When the market is kept to separable pour point depressant volumes and priced using region-appropriate ASP movement, the resulting size stays traceable to clear inputs and can be repeated year to year with the same steps.
Key Questions Answered in the Report
What is the current Pour Point Depressants Market size?
The Pour Point Depressants Market is projected to register a CAGR of 4.58% during the forecast period (2026-2031)
Who are the key players in Pour Point Depressants Market?
Afton Chemical, Evonik Industries AG, The Lubrizol Corporation, Clariant and Croda International Plc are the major companies operating in the Pour Point Depressants Market.
Which is the fastest growing region in Pour Point Depressants Market?
Asia Pacific is estimated to grow at the highest CAGR over the forecast period (2026-2031).
Which region has the biggest share in Pour Point Depressants Market?
In 2025, the Asia Pacific accounts for the largest market share in Pour Point Depressants Market.
What years does this Pour Point Depressants Market cover?
The report covers the Pour Point Depressants Market historical market size for years: 2019, 2020, 2021, 2022, 2023 and 2024. The report also forecasts the Pour Point Depressants Market size for years: 2026, 2027, 2028, 2029, 2030 and 2031.