
Portable Ultrasound Devices Market Size and Share
Market Overview
| Study Period | 2020 - 2031 |
|---|---|
| Market Size (2026) | USD 2.89 Billion |
| Market Size (2031) | USD 3.57 Billion |
| Growth Rate (2026 - 2031) | 4.31 % |
| Fastest Growing Market | Asia Pacific |
| Largest Market | North America |
| Market Concentration | Medium |
Major Players *Disclaimer: Major Players sorted in no particular order Image © Mordor Intelligence. Reuse requires attribution under CC BY 4.0. | |
Portable Ultrasound Devices Market Analysis by Mordor Intelligence
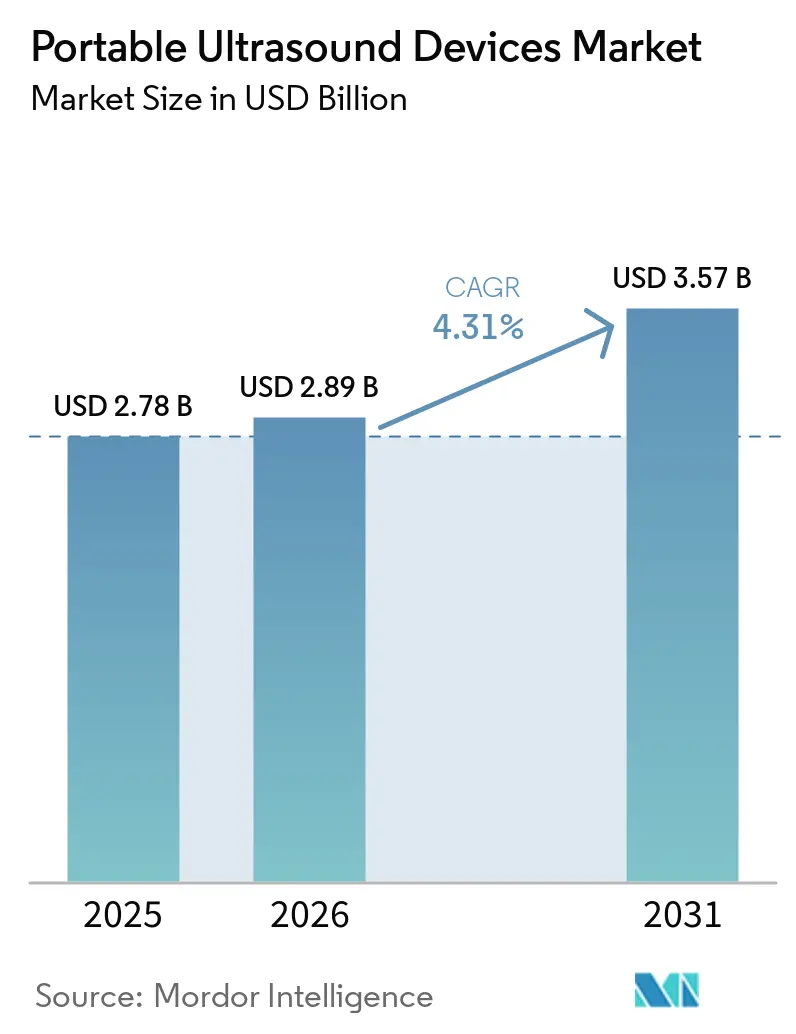
The Portable Ultrasound Devices Market size is expected to grow from USD 2.78 billion in 2025 to USD 2.89 billion in 2026 and is forecast to reach USD 3.57 billion by 2031 at 4.31% CAGR over 2026-2031.
Handheld scanners already dominate frontline imaging because emergency physicians, paramedics, and primary care clinicians value speed and mobility over workstation-grade resolution. Subscription pricing, first popularized by Butterfly Network, is lowering capital barriers for small practices and accelerating first-time adoption, while AI-guided presets shorten exam times for newly trained operators. Edge processors now render 3D volumes at the bedside, bringing obstetric and musculoskeletal applications within reach of battery-powered probes. At the same time, 5G tele-ultrasound networks knit rural clinics into tertiary radiology hubs, compressing specialist turnaround times and reinforcing the shift toward decentralized diagnostics.
Key Report Takeaways
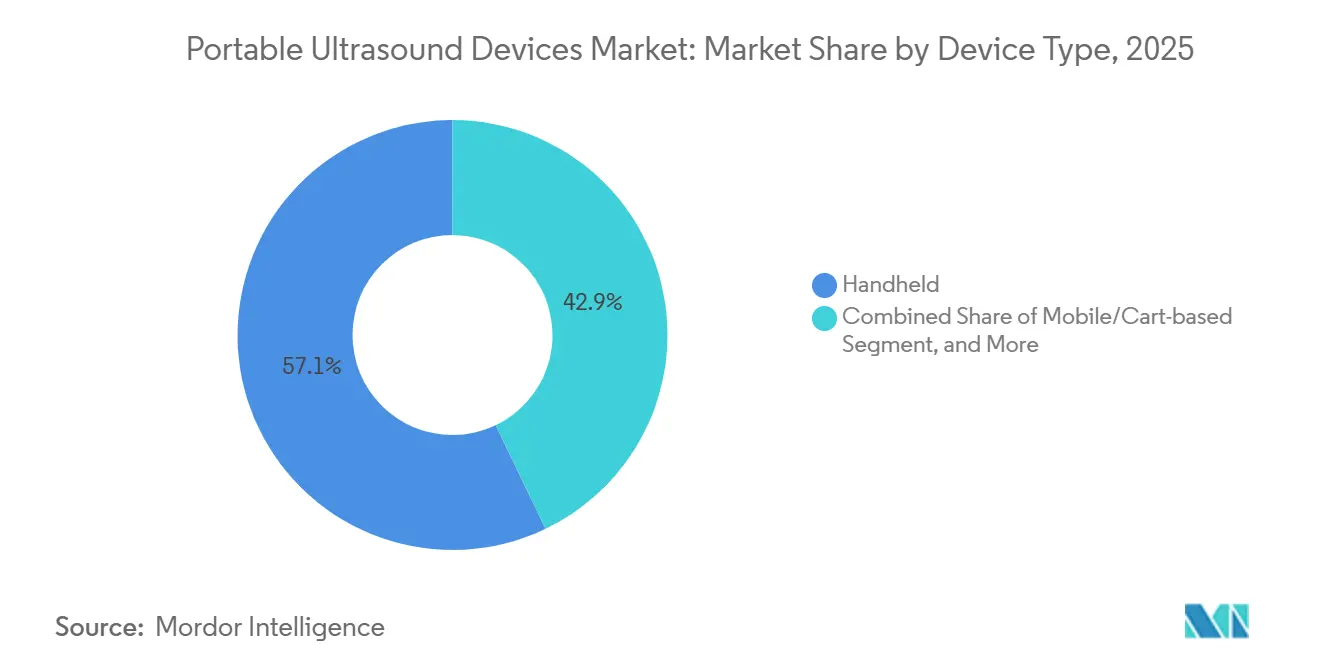
- By device type, handheld systems led with 57.12% of the portable ultrasound devices market share in 2025, whereas wearables and tablet-based platforms are advancing at a 7.06% CAGR through 2031.
- By technology, 2D ultrasound accounted for 49.58% of the portable ultrasound devices market size in 2025, and 3D/4D imaging is projected to climb at a 6.39% CAGR through 2031.
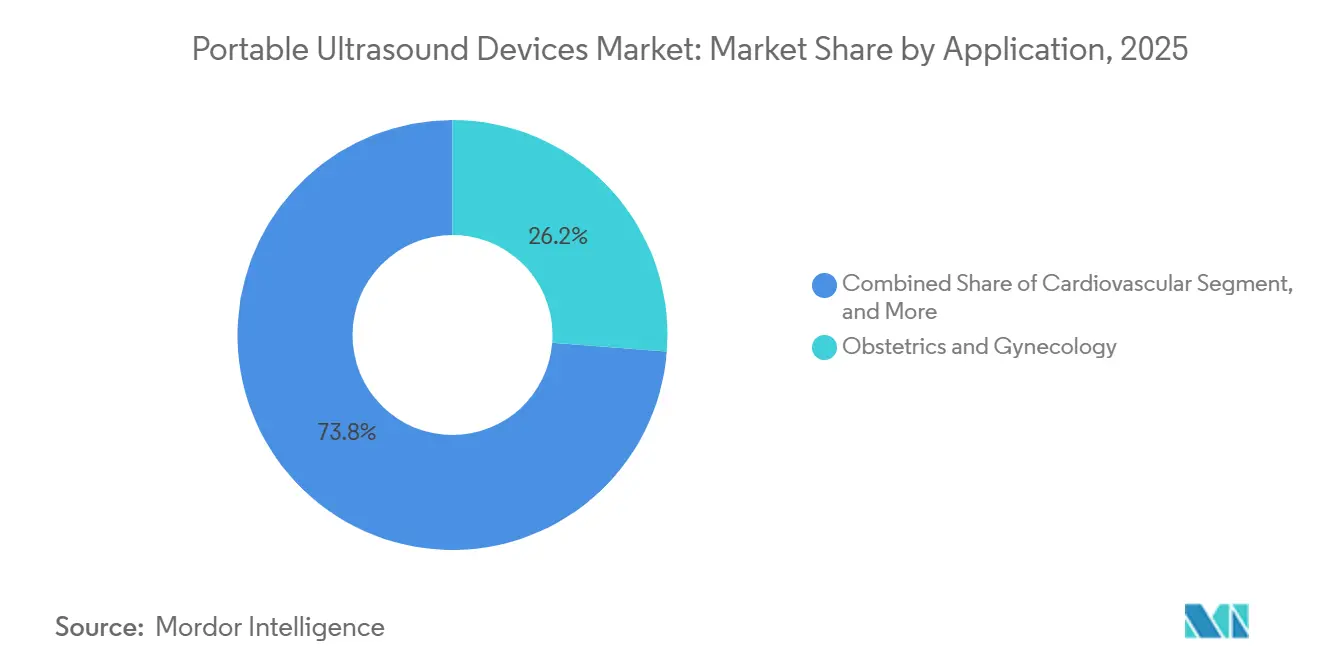
- By application, emergency medicine and trauma protocols are rising at a 7.39% CAGR, while obstetrics and gynecology retained a 26.23% revenue share in 2025.
- By end user, hospitals accounted for 55.14% of revenue in 2025, yet home care and telehealth settings are growing at an 8.13% CAGR through 2031.
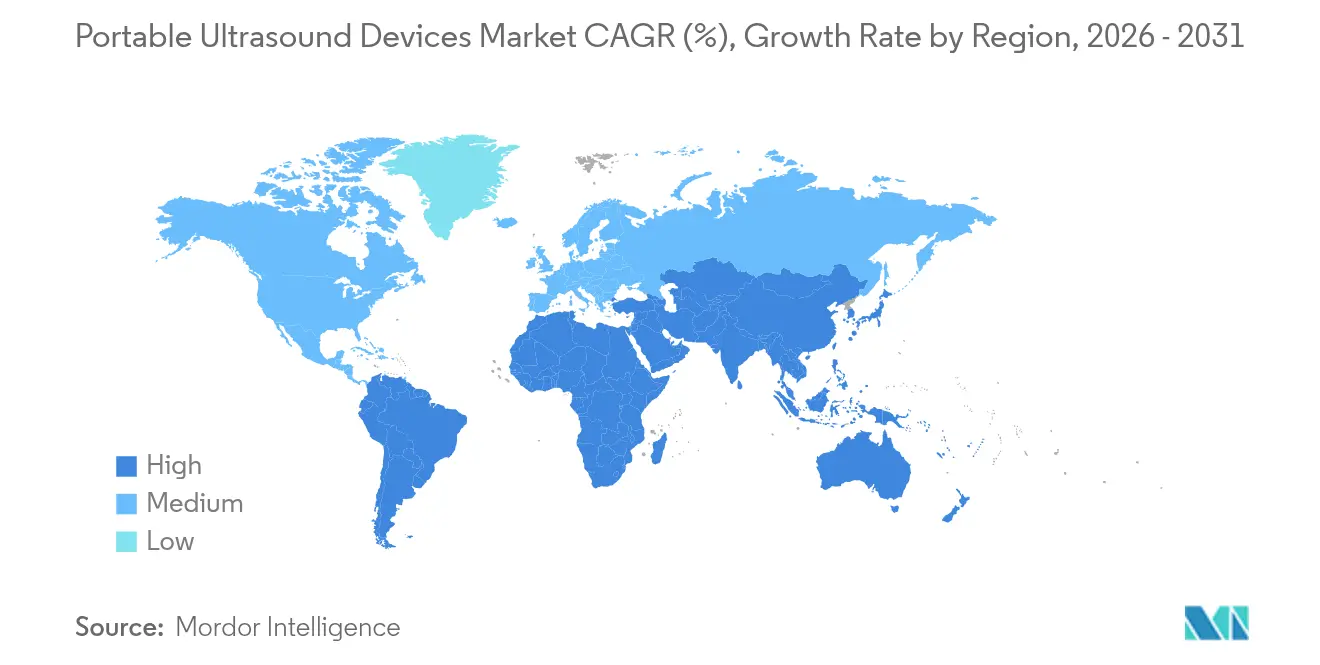
- By geography, North America captured 32.98% share of the portable ultrasound devices market in 2025; Asia-Pacific is the fastest-growing region with an 5.76% CAGR between 2026-2031.
Note: Market size and forecast figures in this report are generated using Mordor Intelligence’s proprietary estimation framework, updated with the latest available data and insights as of 2026.
Market Trends and Insights
Drivers Impact Analysis of Portable Ultrasound Devices Market*
| Driver | (~) % Impact on CAGR Forecast | Geographic Relevance | Impact Timeline |
|---|---|---|---|
| Rising Demand for Point-of-Care Diagnostics in Emergency and Critical-Care Settings | +0.9% | Global, with concentration in North America, Europe, and urban Asia-Pacific | Short term (≤ 2 years) |
| Technological Miniaturization & AI-Enabled Imaging Improve Usability and Image Quality | +1.2% | Global, led by North America and developed APAC markets (Japan, South Korea) | Medium term (2-4 years) |
| Growing Burden of Chronic Diseases Necessitating Accessible Imaging Solutions | +0.7% | Global, with acute demand in aging populations across Europe, North America, and East Asia | Long term (≥ 4 years) |
| 5G-Enabled Tele-Ultrasound Platforms Extending Reach to Rural & EMS Environments | +0.8% | APAC core (China, India), spill-over to MEA and Latin America | Medium term (2-4 years) |
| Subscription & Pay-Per-Use Models Lowering Capital Barriers for Smaller Providers | +0.5% | North America, Western Europe, with gradual adoption in emerging markets | Short term (≤ 2 years) |
| Increased Adoption in Home Healthcare Segments | +0.6% | North America, Western Europe, urban centers in APAC | Medium term (2-4 years) |
| Source: Mordor Intelligence | |||
Rising Demand for Point-of-Care Diagnostics in Emergency and Critical-Care Settings
Emergency departments now integrate handheld scanners into triage because bedside ultrasound reduces time to diagnosis for shock, pneumothorax, and cardiac arrest by 30-40% compared with conventional pathways. Wireless handheld ultrasound devices connect to mobile devices via Wi-Fi or Bluetooth and offer enhanced mobility and usability, particularly in point-of-care, emergency, and remote healthcare environments. ACEP’s 2024 statement classifies 11 core POCUS exams as mandatory competencies, making device access an accreditation requirement. Hospitals respond by equipping crash carts with pocket-sized probes that start imaging within seconds. Pilot EMS programs show that paramedics who received 8 hours of training achieved 85% sensitivity for detecting trauma-free fluid, foreshadowing broader prehospital use. Immediate revenue comes from emergency department capital budgets, while future growth hinges on alignment with EMS reimbursement.
Technological Miniaturization & AI-Enabled Imaging Improve Usability and Image Quality
Silicon-based CMUT arrays are now measuring under 2 mm thick, enabling patch and wrist-worn probes without compromising B-mode fidelity.[2] Butterfly’s iQ3 unites a single-chip CMUT with on-device AI, shortening novice exam times by 35%. Philips added AI Auto Measure to Lumify, delivering cardiac ejection fraction calculations that agree within 5% of expert readings. GE Healthcare’s Caption Guidance overlays coaching prompts until anatomical landmarks align, lifting image quality among first-year residents. Hospitals typically refresh portable fleets every 3 to 4 years, so AI-enabled models will steadily replace legacy units over the medium term.
Growing Burden of Chronic Diseases Necessitating Accessible Imaging Solutions
Almost 48% of U.S. adults 65 plus live with cardiovascular disease, doubling demand for serial echocardiograms.[3] Kaiser Permanente’s 2024 pilot cut 30-day heart-failure readmissions by 22% through biweekly home-based scans. Portable devices also streamline in-office renal staging and vascular-access checks, sparing referrals. WHO added portable ultrasound to its 2024 Essential Diagnostics List for noncommunicable diseases, priming donor agencies to fund deployments in South Asia and Africa. Longer-term sales will ride the transformation from episodic to continuous monitoring care models.
5G-Enabled Tele-Ultrasound Platforms Extending Reach to Rural & EMS Environments
China Mobile’s rural Sichuan network links township clinics to tertiary radiologists with <20 ms latency, achieving >90% diagnostic concordance for thyroid and abdominal exams. India’s National Health Mission pilots antenatal tele-ultrasound hubs in districts with obstetrician density below 1 per 10,000 people. These hubs cut referral delays by almost half, underpinning measurable drops in maternal mortality. Expansion will track 5G tower rollouts, aiming to achieve broad rural coverage by 2028-2029.
Restraints Impact Analysis of Portable Ultrasound Devices Market*
| Restraint | (~) % Impact on CAGR Forecast | Geographic Relevance | Impact Timeline |
|---|---|---|---|
| High Upfront Cost & Uneven Reimbursement Policies | -0.6% | Global, acute in emerging markets (Latin America, MEA, South Asia) | Short term (≤ 2 years) |
| Shortage of Trained Operators; Lack of Standardized Training Frameworks | -0.8% | Global, most severe in rural areas and emerging markets | Medium term (2-4 years) |
| Cyber-Security and Data-Privacy Risks with Wireless Handheld Devices | -0.3% | North America, EU (GDPR compliance zones) | Short term (≤ 2 years) |
| Regulatory Variability Affecting Global Market Entry | -0.4% | Global, with bottlenecks in markets requiring local clinical trials (Brazil, Russia, India) | Medium term (2-4 years) |
| Source: Mordor Intelligence | |||
High Upfront Cost & Uneven Reimbursement Policies
Handhelds priced at USD 5,000-15,000 remain beyond the reach of rural clinics, where per-capita health spending is under USD 200. CMS reimburses CPT 76604, yet private insurers often impose prior authorization that delays payment 30-60 days. Germany pays for specific POCUS indications, whereas France limits outpatient reimbursement, illustrating European fragmentation. Subscription fees still overshoot budgets for many sub-Saharan posts. Price-sensitive buyers will postpone purchases until list prices drop below USD 3,000 or payers guarantee prompt reimbursement.
Shortage of Trained Operators; Lack of Standardized Frameworks
Only 30% of U.S. emergency physicians held formal POCUS credentials in 2024. Credentialing bodies diverge: WINFOCUS recommends 50 scans for competency, while AIUM calls for 150. Rural hospitals struggle, with just 12% employing sonographers in 2024. India’s attempt to train 5,000 auxiliary nurses saw 40% attrition without ongoing mentorship. Standardization and curriculum integration may take three to five years, limiting device utilization in the interim.
*Our forecasts treat driver/restraint impacts as directional, not additive. The impact forecasts reflect baseline growth, mix effects, and variable interactions.
Portable Ultrasound Devices Market Segment Analysis
By Device Type:
Handheld Dominance Faces Wearable MomentumHandheld units generated 57.12% of revenue in 2025 and were driven by imaging presets. That share will gradually cede ground as wearables and tablet-based scanners post a 7.06% CAGR to 2031. Hospitals still value cart platforms for complex Doppler and 3D tasks, yet handhelds now meet quality thresholds for most bedside exams, keeping the portable ultrasound devices market size weighted toward ultra-mobile form factors. Wearable bladder-monitoring patches under development promise 48-hour data streams without user intervention, extending reach into chronic-disease home monitoring. As chip-level CMUT integration lowers the bill of materials, vendors will differentiate less on hardware and more on AI workflows, subscription analytics, and interoperability.
Tablet-based offerings such as GE Vscan Air CL bridge screen real estate gaps, pairing wireless probes with consumer tablets for field trauma triage. They deliver enough processing to display dual-mode Doppler overlays while still fitting paramedic kits. The portable ultrasound devices market continues to price-segment by use case: handhelds for broad bedside adoption, tablets for transport teams, carts for high-throughput echo labs, and wearables for longitudinal disease management. Each slice grows, but wearables accelerate fastest as power-management miniaturization and soft-transducer research converge.

By Technology:
3D/4D Edge Rendering Challenges 2D Hegemony2D imaging maintained a 49.58% share in 2025, thanks to its longstanding roles in obstetrics, emergency care, and procedures. Yet GPU advances now on the horizon enable real-time volumetric rendering that was once workstation-exclusive; consequently, 3D/4D will grow at a 6.39% CAGR through 2031. Doppler modes still underpin cardiac and vascular care, representing roughly 30% of portable exams. AI now augments baseline 2D performance: Philips Auto Follicle cuts fertility clinic exam time by 40%, proving that software keeps 2D relevant. Residency programs have lagged in volumetric curricula only 18% covered 3D in 2024 slows adoption. Vendors counter with synchronized 2D-3D views that let clinicians validate new planes against familiar slices. Over time, portability will be defined less by transducer physics and more by the software toolchain deployed on edge devices.
By Application:
Emergency Medicine Surpasses Traditional ObstetricsObstetrics and gynecology still accounted for 26.23% of revenues in 2025, but emergency medicine and trauma usage are advancing at a 7.39% CAGR, fueled by ATLS-mandated FAST exams. Cardiovascular monitoring is a high-value secondary segment, driven by home-based heart failure management programs. Musculoskeletal ultrasound is gaining traction in sports clinics, displacing MRI as the initial modality for tendon assessments. The portable ultrasound devices market share in urology is expanding as hospice and surgical wards adopt bladder scanners to prevent catheter-associated infections. Real-world evidence shows bedside ultrasound changed management in 42% of undifferentiated shock cases, cementing its role in acute-care algorithms. Consequently, vendors prioritize interface presets and AI cues that optimize trauma and cardio workflows.
By End User:
Home Care and Telehealth Erode Hospital ExclusivityHospitals captured 55.14% revenue in 2025, yet growth now tilts toward home care and telehealth, which will climb at an 8.13% CAGR to 2031 as value-based insurers reimburse remote imaging. ASCs deploy handheld probes for vascular mapping and peripheral nerve blocks, thereby reducing anesthesia time. Imaging centers confront volume leaks as primary-care offices bring renal and pelvic scans in-house. Maternity clinics leverage portable probes for follicle tracking without radiology slots. The portable ultrasound devices market size related to home health soared once payers recognized readmission savings, as evidenced by Kaiser Permanente’s 22% reduction in heart-failure bounce-backs. Teladoc and Amwell now integrate live guidance overlays, letting remote physicians walk patients through basic scans.
Geography Analysis
North America Portable Ultrasound Devices Market
North America contributed 32.98% revenue in 2025 as CMS added CPT 76604 for tele-interpreted scans and FDA-cleared Butterfly iQ3, GE Vscan Air CL, and Philips Lumify within the same year. Canada’s First Nations program reduced obstetric medevacs by 35% by equipping nurses with handheld probes. Mexico’s social security fund ordered 2,500 handheld units for rural clinics, underscoring emerging-market appetite within the hemisphere. Market saturation in urban hospitals pushes vendors toward veterinary practices, home care suppliers, and critical-access facilities.
APAC Portable Ultrasound Devices Market
Asia-Pacific will expand at a 5.76% CAGR through 2031. China’s township health center procurement, backed by NMPA approvals for Mindray, Sonoscape, and Edan, already exceeds 40% of the domestic market share. India cleared 18 new models in 2024, many priced below USD 3,000, enabling penetration into tier-3 cities. Japan embedded home-based cardiac ultrasound into long-term care insurance, and Australia’s Royal Flying Doctor Service halved diagnostic delays in remote outback clinics. South Korea expanded insurance coverage for emergency POCUS, prompting upgrades at trauma centers.
Regulatory Landscape
In the United States, portable ultrasound devices are regulated as medical devices, with diagnostic ultrasound systems often under FDA Class II controls (21 CFR 892.1550 and 892.1560). They are cleared through the 510(k) pathway when substantial equivalence to a predicate can be demonstrated.
In 2026, the FDA Quality Management System Regulation (QMSR) took effect on February 2, 2026. This update requires manufacturers to align quality systems and documentation practices with the revised framework, which is especially relevant for wireless, software-driven portable platforms that receive frequent updates.
Competitive Landscape
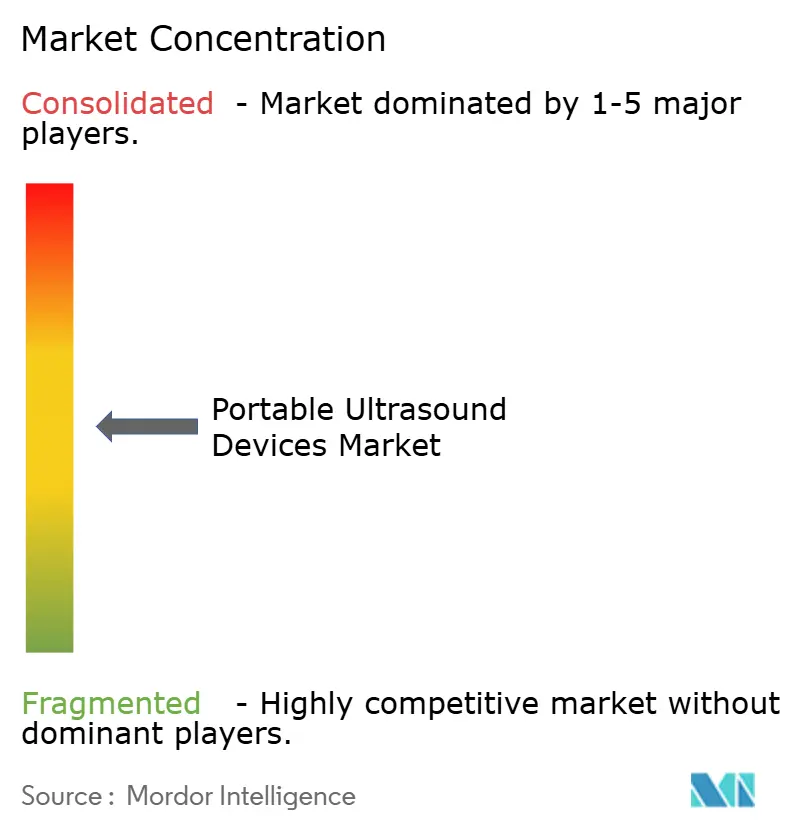
Market concentration is moderate. GE HealthCare, Philips, and Fujifilm Sonosite maintain scale advantages via broad portfolios and service networks. Incumbents bundle handhelds with existing PACS contracts and multi-year service, reinforcing hospital loyalty. Butterfly and Clarius bypass hospital committees, selling subscription devices directly to clinicians and veterinary practices. Patent analysis shows GE holds more than 120 live AI-interpretation patents, while Butterfly controls 85 CMUT-on-chip claims. EchoNous and Exo Imaging pursue AI-native architectures, emphasizing software over probe variety; EchoNous proved 92% concordance in cardiac exams during a 2024 validation.
Chinese makers price between USD 3,000-6,000, undercutting Western brands while closing quality gaps through European transducer-supplier alliances. FDA cybersecurity mandates advantage larger players that can fund a secure update infrastructure. Accordingly, the market bifurcates: premium hospital segments prefer integrated systems with enterprise security, while price-sensitive home-care, veterinary, and emerging-market buyers gravitate toward subscription or low-cost probes.
Portable ultrasound devices industry consolidation remains moderate, leaving room for niche specialists in obstetric AI, sports-medicine workflows, and wearable long-duration monitors. Strategic alliances, such as EchoNous partnering with Mendaera for robotic guidance, exemplify convergence trends between ultrasound and interventional technologies.
Portable Ultrasound Devices Industry Leaders
-
GE Healthcare
-
Koninklijke Philips N.V.
-
Canon Medical Systems Corp.
-
Siemens Healthineers
-
Butterfly Network Inc.
- *Disclaimer: Major Players sorted in no particular order
Portable Ultrasound Devices Market Companies Covered in this Report
- GE Healthcare
- Koninklijke Philips
- FUJIFILM
- Canon
- Siemens Healthineers
- Mindray
- Samsung Group
- Butterfly Network Inc.
- Clarius Mobile Health Corp.
- Esaote
- Terason Corporation
- Konica Minolta Healthcare
- Sonoscape Medical Corp.
- Fukuda Denshi Co., Ltd.
- VaveHealth
- Edan Instruments Inc.
- EchoNous Inc.
- Beijing Konted Medical Technology Co.
- Promed Technology Co., Ltd.
- EchoNous, Inc.
Market Opportunities and Future Outlook
White space remains in point-of-care ultrasound workflows, with payer and procurement dynamics continuing to influence device adoption. In the United States, policy detail from Blue Cross Blue Shield CPCP030 variants across states and Healthfirst PO-RE-107 updated on November 17, 2025 points to an opportunity for vendors to pair devices with competency pathways, scan archiving, and reporting tools that help providers meet coding, supervision, and medical-necessity requirements.
Hospital and outpatient buyers also continue to refresh portable fleets every 3 to 4 years. Their purchasing criteria increasingly centers on AI-guided presets, automated measurements, and needle guidance on compact systems.
Recent Industry Developments in Portable Ultrasound Devices Market
- April 2026: Abbott announced the OPTIS Mobile Next Imaging System with integrated software upgrades, expanding portable ultrasound capabilities across ambulatory clinics and remote sites. The announcement expands Abbott's software-enabled, AI-assisted workflow offering and supports integration with enterprise PACS and telehealth platforms.
- November 2025: Siemens Healthineers received FDA 510(k) clearance for the ACUSON Maple and ACUSON Maple Select diagnostic ultrasound systems. The clearance broadens the US portfolio for compact and portable deployments and supports ongoing refresh cycles.
- September 2024: GE HealthCare launched Venue Sprint, a tablet-based portable point-of-care ultrasound system. The product introduction adds momentum to tablet-centric form factors for fast-moving bedside and procedural use cases.
Portable Ultrasound Devices Market Report Scope and Research Methodology
Market Definition and Coverage
This market covers revenue earned from portable ultrasound systems designed to be moved and used across care settings, including handheld, mobile/cart-based, and wearable or tablet-based formats, along with the imaging configurations used for routine and point-of-care exams.
Scope exclusions: We exclude non-medical ultrasound uses, refurbished device resale, and service-only revenue that is billed separately from device sales.
Segments Covered in This Report
- By Device Type
- Handheld
- Mobile/Cart-based
- Wearable & Tablet-based
- By Technology
- 2D Ultrasound
- 3D/4D Ultrasound
- Doppler Imaging
- By Application
- Obstetrics & Gynecology
- Cardiovascular
- Urology & Renal
- Musculoskeletal
- Anesthesiology & Critical Care
- Emergency Medicine & Trauma
- Abdominal & General Imaging
- By End User
- Hospitals
- Ambulatory Surgical Centers
- Diagnostic Imaging Centers
- Maternity Centers & Fertility Clinics
- Home Care & Telehealth
- By Geography
- North America
- United States
- Canada
- Mexico
- Europe
- Germany
- United Kingdom
- France
- Italy
- Spain
- Rest of Europe
- Asia-Pacific
- China
- Japan
- India
- Australia
- South Korea
- Rest of Asia-Pacific
- Middle East & Africa
- GCC
- South Africa
- Rest of Middle East & Africa
- South America
- Brazil
- Argentina
- Rest of South America
- North America
Data Sources, Market Sizing, and Validation
Desk Research
Desk work starts by building a clean fact base on disease loads, procedure volumes, and care delivery shifts that influence ultrasound usage in hospitals and outside the hospital. We draw on public health statistics and surveillance releases, including those from the World Health Organization, the US FDA device databases, the OECD health data series, and national statistics offices where imaging activity is reported.
We then layer in manufacturer annual reports, product brochures, investor presentations, and reputable press to understand launch timing, typical use settings, and pricing movement for portable formats. To sanity-check trade flows and supply availability, we also review customs and trade statistics where ultrasound equipment is visible, and we use paid subscriptions for company financials and patent activity when disclosures are limited. The desk sources named above are illustrative only, since additional public documents were reviewed for data collection, cross-checking, and clarification.
Primary Interviews and Surveys
Primary work is used to pressure-test what we see in public data, especially around portable adoption in emergency care, critical care, and outpatient settings where procurement behavior differs. We speak with device manufacturers, distributors, hospital imaging staff, and clinicians using point-of-care ultrasound. We then revisit outliers with follow-up questions so assumptions on pricing, replacement cycles, and mix shifts stay realistic across APAC, EMEA, and Americas.
Distribution of primary research fieldwork respondents
| Company type | Respondent position | Region |
|---|---|---|
| Top tier: 27% | CXOs: 16% | APAC: 47% |
| Mid tier: 52% | Functional/Unit leaders: 37% | EMEA: 30% |
| Smaller Players: 21% | Managers: 47% | Americas: 23% |
Market-Sizing & Forecasting
Sizing is built using a top-down approach where the global ultrasound equipment pool is reconstructed by region, then split into portable formats using adoption rates by care setting and device type. To keep totals grounded, we corroborate results with selective bottom-up checks, such as sampled average selling prices by form factor, channel feedback on shipment direction, and a roll-up of disclosed imaging revenue where it can be cleanly tied back to portable systems.
Key inputs shaping the model include portable share of ultrasound installations, replacement cycles for cart-based and handheld systems, pricing ranges by device type, the shift toward point-of-care exams in emergency and critical care, and the pace of Doppler and advanced imaging feature uptake in portable products. When a variable is missing for a smaller country, we bridge the gap using proxy indicators such as hospital bed counts, clinician density, and import intensity, followed by a reasonableness check against neighboring markets.
For forecasting, we rely on scenario analysis supported by a light multivariate regression that links demand to healthcare spending growth, the outpatient shift, and procedure mix changes discussed in interviews. Assumptions on price erosion and mix upgrades are refreshed at the regional level, so growth is not driven by one global average that hides local purchasing cycles.
Data Validation & Update Cycle
Outputs are validated through triangulation across independent signals, including procedure trends, import patterns where visible, and interview-based checks on procurement timing. Variance checks are run by region and by device type, and any sharp jumps trigger a re-check of assumptions, followed by an internal multi-step analyst review before sign-off.
Reports are refreshed annually, and interim updates are made when material events occur, such as major regulatory actions, large product introductions, or sudden reimbursement shifts in monitored geographies. Before delivery, the full model is re-opened for a fresh pass so clients receive the latest updated view, rather than an older snapshot.
Mordor Intelligence's Portable Ultrasound Devices Market Size Compared With Other Published Estimates
Different published market sizes can look far apart because the included product scope and the assumed pricing logic are not the same, even when the market label sounds identical. The biggest swings usually come from whether cart-based portable systems are counted fully, how handheld probe-only systems are treated, and what year-specific currency rates are applied.
The main gap comes from how handheld probe-only devices and bundled software are counted, where Mordor Intelligence treats revenue as portable only when it is a clearly priced device sale within the defined handheld, mobile/cart-based, or wearable/tablet-based formats, and avoids adding unrelated service lines that inflate totals.
Benchmark comparison
| Source | Market Size | Gaps in Research Methodology |
|---|---|---|
| Mordor Intelligence | USD 2.78 B (2025) | |
| Industry Publisher A | USD 2.48 B (2025) | Uses a narrower portable definition that appears to undercount cart-based portable systems in some regions, and applies more conservative assumptions on hospital purchasing cycles and near-term replacement demand. |
| Global Consultancy B | USD 4.51 B (2025) | Likely includes adjacent ultrasound revenue pools beyond portable device sales, such as broader ultrasound systems, software bundles, or service elements, and may use higher blended ASPs that do not separate handheld from cart-based pricing. |
The spread across the three figures is mainly explained by what each estimate treats as a portable device sale and how pricing is averaged across different form factors. By keeping scope tied to portable formats and validating ASP and mix assumptions through checks by region and care setting, the final number is easier to trace back to demand drivers and repeatable steps.
Key Questions Answered in the Report
What is the projected value of the portable ultrasound devices market in 2031?
It is forecast to reach USD 3.57 billion by 2031, based on a 4.31% CAGR over 2026-2031.
Which device type leads current sales?
Handheld scanners held 57.12% revenue in 2025 owing to point-of-care adoption.
Which application is growing fastest?
Emergency medicine and trauma imaging is advancing at 7.39% CAGR through 2031, outpacing other segments.
How fast is home-care adoption expanding?
Home care and telehealth settings are projected to grow at an 8.13% CAGR as value-based contracts reimburse remote imaging.
Which regions will contribute most incremental demand?
Asia-Pacific, led by China and India, is expected to post a 5.76% CAGR, driven by rural tele-ultrasound programs and low-cost domestic devices.
How are telehealth platforms influencing demand?
Cloud-connected probes that share images in real time are accelerating adoption in remote and home-care settings, especially where reimbursement supports virtual consultations.