
Market Overview
| Study Period | 2020 - 2031 |
|---|---|
| Forecast Data Period | 2026 - 2031 |
| Base Year Market Size (2025) | USD 3.11 Billion |
| Market Size (2026) | USD 3.27 Billion |
| Market Size (2031) | USD 4.22 Billion |
| Growth Rate (2026 - 2031) | 5.21 % |
| Market Concentration | Medium |
Major Players *Disclaimer: Major Players sorted in no particular order Image © Mordor Intelligence. Reuse requires attribution under CC BY 4.0. | |
United States Ultrasound Devices Market Analysis by Mordor Intelligence
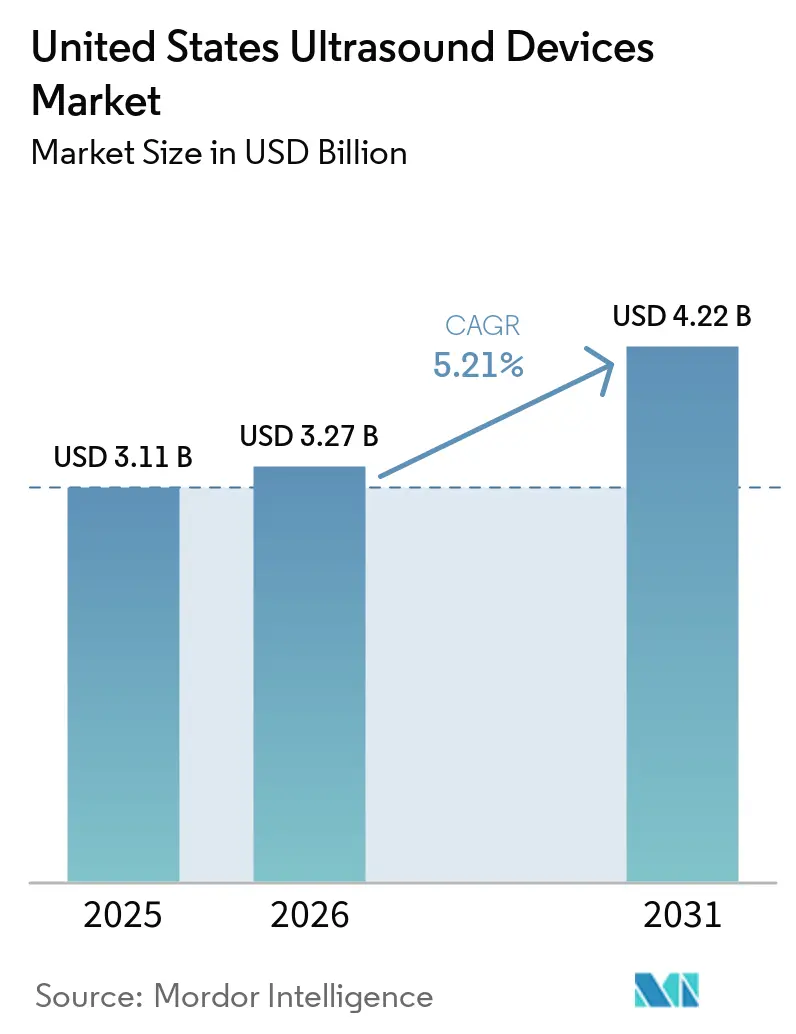
The United States Ultrasound Devices Market size was valued at USD 3.11 billion in 2025 and estimated to grow from USD 3.27 billion in 2026 to reach USD 4.22 billion by 2031, at a CAGR of 5.21% during the forecast period (2026-2031).
Growing demand for value-based imaging, persistent sonographer shortages, and reimbursement shifts continue to influence purchasing decisions. Artificial intelligence has moved from novelty to necessity, with autonomous scanning and voice-activated functions reducing operator variability. Handheld systems priced under USD 4,000 now deliver diagnostic-grade imaging, widening access in emergency medicine and home healthcare. Supply-chain tariffs and Medicare fee compression are pressuring margins, so manufacturers focus on software upgrades, subscription models, and flexible financing to retain customers in the United States ultrasound devices market.
Key Report Takeaways
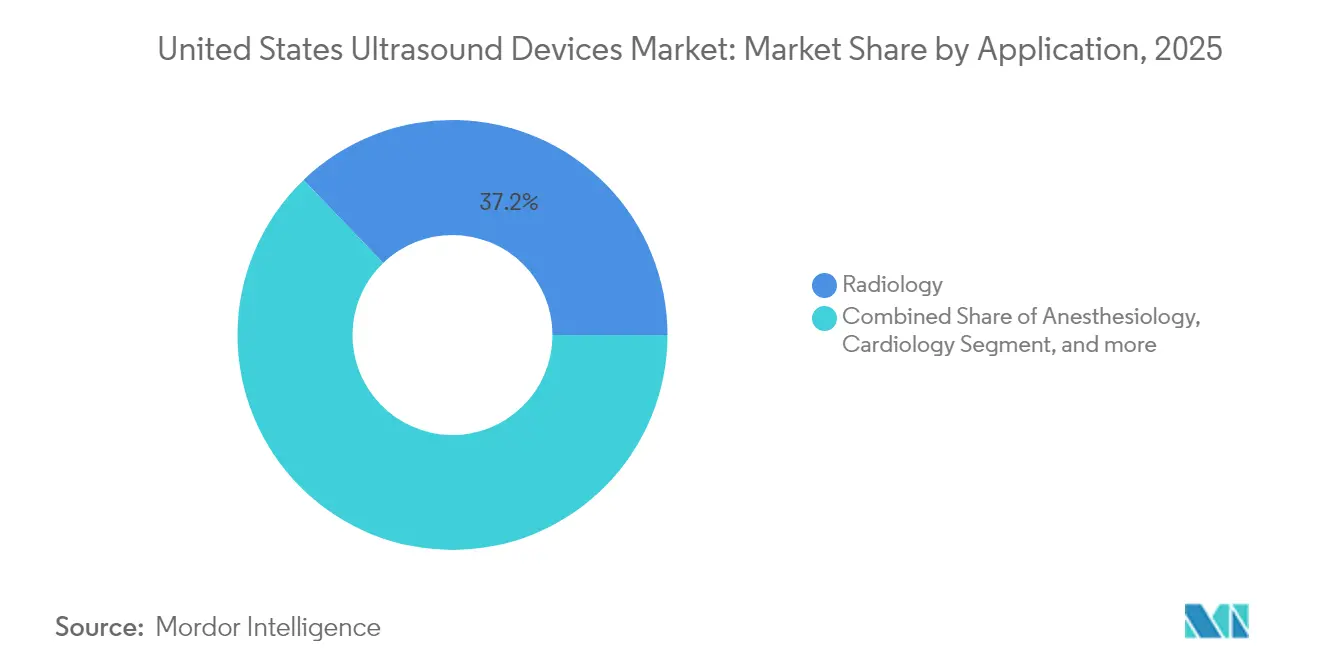
- By application, radiology held 37.18% revenue share in 2025; critical care is projected to expand at a 6.42% CAGR through 2031.
- By technology, 3D and 4D systems captured 42.05% of the United States ultrasound devices market share in 2025, while high-intensity focused ultrasound is expected to advance at a 5.89% CAGR to 2031.
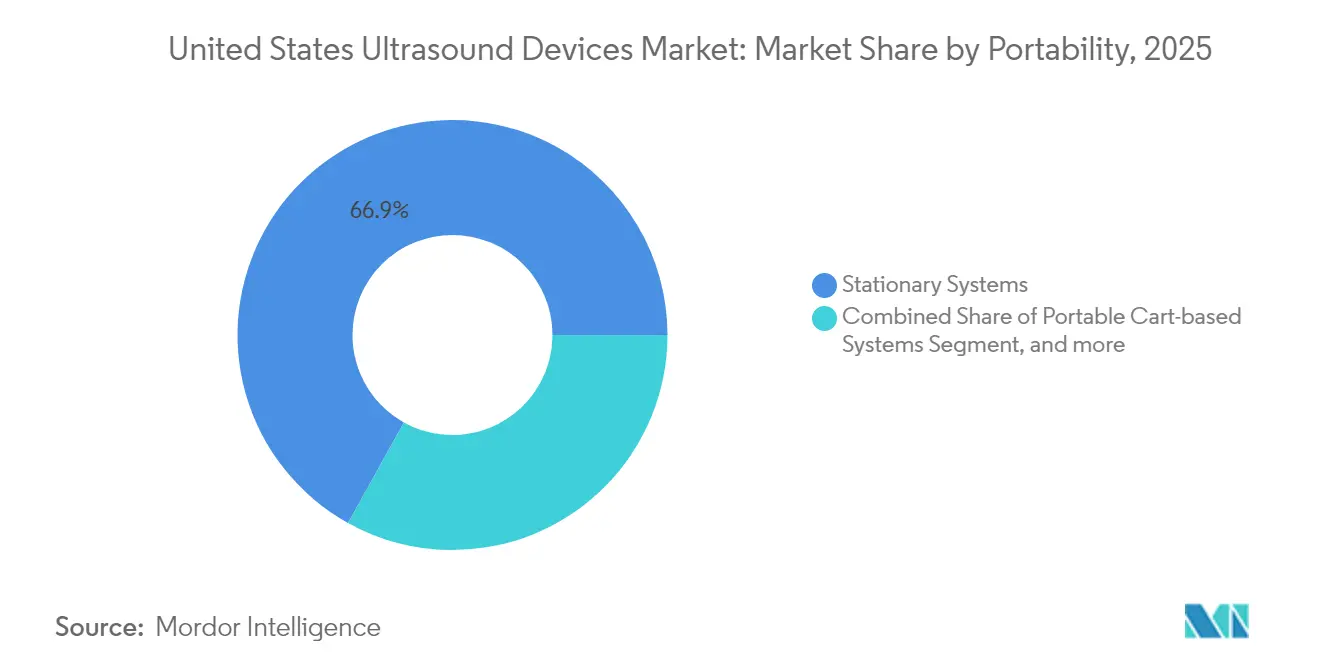
- By portability, stationary platforms maintained 66.92% share in 2025; handheld devices are forecast to rise at an 7.78% CAGR through 2031.
- By end user, hospitals commanded 55.56% share of the United States ultrasound devices market size in 2025, whereas home healthcare is on track for a 7.22% CAGR to 2031.
Note: Market size and forecast figures in this report are generated using Mordor Intelligence’s proprietary estimation framework, updated with the latest available data and insights as of 2026.
United States Ultrasound Devices Market Trends and Insights
Drivers Impact Analysis*
| Driver | (~) % Impact on CAGR Forecast | Geographic Relevance | Impact Timeline |
|---|---|---|---|
| Shift Toward Outpatient Imaging Reimbursement | +0.8% | National, with early gains in Northeast, West | Medium term (2-4 years) |
| AI-Driven Workflow Optimization | +0.9% | Global, concentrated in major metropolitan areas | Short term (≤ 2 years) |
| Proliferation of Handheld Ultrasound Devices | +0.7% | National, accelerated adoption in rural areas | Medium term (2-4 years) |
| Bundled Ultrasound Integration in Cardiology Procedures | +0.4% | National, led by cardiology centers | Long term (≥ 4 years) |
| OEM Financing & Leasing Programs | +0.3% | National, focused on hospital systems | Short term (≤ 2 years) |
| Telehealth Expansion Supporting Remote Ultrasound | +0.6% | National, enhanced rural penetration | Medium term (2-4 years) |
| Source: Mordor Intelligence | |||


Shift toward Outpatient Imaging Reimbursement
Medicare increased outpatient imaging payments by 2.9% in 2025, encouraging procedure migration from inpatient suites to ambulatory sites. Hospital groups consequently favor compact cart systems that clear corridors quickly and process higher patient volumes. Joint ventures such as Smith+Nephew and JointVue equip orthopedic centers with 3D ultrasound navigation that bypasses ionizing radiation. Purchasing committees now rank scanners on throughput metrics and cost-per-scan figures, giving an edge to vendors that bundle analytics dashboards with service contracts in the United States ultrasound devices market.[1]Federal Register, “Hospital Outpatient Prospective Payment System Updates for CY 2025,” federalregister.gov
AI-Driven Workflow Optimization
Only 81,080 diagnostic medical sonographers serve the entire country, so machine-learning guidance is indispensable. GE HealthCare and NVIDIA co-developed autonomous protocols on the Isaac platform that cut rescans by up to 30% while improving measurement consistency. Fujifilm Sonosite’s Voice Assist lets users issue commands without touching the console, preserving sterile fields in operating rooms. Software upgrades rather than new hardware now represent the most expedient path to value, pushing hospitals to sign multi-year subscription agreements that stabilize vendor revenues within the United States ultrasound devices market.[2]U.S. Bureau of Labor Statistics, “Occupational Outlook for Diagnostic Medical Sonographers,” bls.gov
Proliferation of Handheld Ultrasound Devices
Semiconductor miniaturization dropped device costs from USD 10,000 to nearly USD 2,000, allowing emergency physicians to carry personal handheld ultrasound devices. Butterfly Network’s iQ3 features a P4.3 Ultrasound-on-Chip that delivers 3D images from a smartphone and integrates with electronic medical records. Emergency departments in only 47% of U.S. hospitals currently use point-of-care ultrasound, leaving ample headroom for adoption. Rural clinicians rely on tele-guidance software to consult urban specialists, broadening geographic reach for the United States ultrasound devices market.
Bundled Ultrasound Integration in Cardiology Procedures
New CPT codes for MRI-monitored ultrasound ablation position cardiovascular bundles as a fresh revenue pool. GE HealthCare’s AI-enhanced Flyrcado agent aligns cardiac function assessment with reimbursement metrics, and integrated reporting tools speed claims submission. Hospitals purchasing next-generation echocardiography consoles demand interoperability with electronic health records, which favors platforms offering standardized DICOM push and automated ICD-10 coding. These ecosystem capabilities reinforce customer loyalty and extend service contracts in the United States ultrasound devices market.
Restraints Impact Analysis*
| Restraint | (~) % Impact on CAGR Forecast | Geographic Relevance | Impact Timeline |
|---|---|---|---|
| Regulatory Delays Due to FDA 510(k) Backlog | -0.5% | National, affecting all manufacturers | Short term (≤ 2 years) |
| Capital Expenditure Deferrals by Hospitals | -0.7% | National, concentrated in rural areas | Medium term (2-4 years) |
| Rising Cybersecurity Compliance Costs | -0.3% | National, enhanced focus on connected devices | Long term (≥ 4 years) |
| Fragmented Reimbursement Landscape | -0.4% | National, with state-level variations | Medium term (2-4 years) |
| Source: Mordor Intelligence | |||
Regulatory Delays Due to FDA 510(k) Backlog
Section 524B of the FD&C Act now requires extensive cybersecurity documentation, including a software bill of materials, for every connected scanner.[3]U.S. Food and Drug Administration, “Cybersecurity in Medical Devices Guidance,” fda.gov Artificial intelligence modules must submit algorithm drift data, stretching review cycles well beyond historic norms. Smaller companies face longer time-to-revenue and may cede ground to legacy manufacturers that maintain in-house regulatory teams. The United States ultrasound devices market therefore risks slower innovation diffusion, particularly for high-growth therapeutic applications.
Capital Expenditure Deferrals by Hospitals
The 2025 Medicare conversion factor dropped 2.83%, squeezing imaging reimbursement. Rural and safety-net hospitals push replacement intervals past seven years, favoring leasing and pay-per-scan arrangements over outright purchases. Vendors now propose usage-based models that wrap service, probes, and software into a single monthly fee, but revenue recognition shifts to a multi-year horizon. Cash-strapped providers prioritize scanners tied to revenue-generating procedures, tempering near-term unit volumes in the United States ultrasound devices market.
*Our forecasts treat driver/restraint impacts as directional, not additive. The impact forecasts reflect baseline growth, mix effects, and variable interactions.
Segment Analysis
By Application: Critical Care Gains Momentum
Radiology held 37.18% of the United States ultrasound devices market share in 2025 through high-volume diagnostic protocols. Critical care, advancing at a 6.42% CAGR, benefits from bedside assessments that shorten intensive-care stays. Cardiology usage broadens under bundled payment models that reward integrated echocardiography and hemodynamic monitoring. Musculoskeletal imaging grows as sports clinics adopt real-time guidance for injections. Urology accelerates after new CPT codes validated ultrasound-guided ablation. Vascular screening remains steady as Medicare funds preventive programs, sustaining baseline demand for the United States ultrasound devices market.
The United States ultrasound devices market size for radiology is projected to expand moderately as workflow improvement tools extract more scans per machine, while critical care gains incremental budget share from emergency departments. Handheld devices lead adoption curves, yet multi-probe cart systems remain indispensable for high-resolution abdominal and pelvic exams. Vendors now bundle elastography and artificial intelligence packages to raise average selling prices despite budget constraints, reinforcing platform stickiness in hospital radiology suites.


By Technology: HIFU Matures Beyond Pilot Stage
3D and 4D platforms captured 42.05% share through superior spatial rendering that enhances obstetric and cardiac diagnostics. Automated breast ultrasound is integrated with routine mammography in same-day dense-breast screening packages at U.S. facilities. High-intensity focused ultrasound, at 5.89% CAGR, transitions from experimental oncology to reimbursed prostate and uterine fibroid therapies. Doppler remains essential for vascular flow studies, and 2D persists in low-acuity settings due to cost advantages.
United States ultrasound devices market size for therapeutic HIFU remains small but accelerates as clinical evidence broadens. FDA reclassification of select therapeutic probes to Class II lowers entry barriers, and academic centers race to secure first-mover advantage. Established vendors integrate thermal dose monitoring, while niche start-ups license beam-forming software. This dual-path innovation sustains price diversity and supports multi-segment growth within the United States ultrasound devices industry.
By Portability: Handheld Devices Disrupt Workflows
Stationary consoles maintained 66.92% share in 2025, anchored by advanced processing and broad probe portfolios. Handheld units, rising 7.78% CAGR, enable clinicians to scan in triage bays, ambulances, and at home. Portable carts occupy the middle segment, balancing mobility with performance.
United States ultrasound devices market size for handhelds is expanding fastest as integrated batteries and wireless connectivity support tele-supervised exams. Subscription bundles lower upfront costs and layer software upgrades over time. Meanwhile, stationary systems defend share by integrating artificial intelligence packages that automate measurements and expedite reporting. Hospitals thus deploy a mixed fleet, optimizing each modality for its clinical niche in the United States ultrasound devices market.
By End User: Home Healthcare Becomes Mainstream
Hospitals controlled 55.56% revenue in 2025 through comprehensive imaging suites. Home healthcare, advancing 7.22% CAGR, leverages tele-monitoring and demographic aging. Ambulatory surgical centers invest in ultrasound navigation for minimally invasive procedures, while diagnostic imaging centers thrive on outpatient referrals.
Growth in the United States ultrasound devices industry reflects diversification across care sites. Mobile imaging services equip vans with cart-based scanners to reach long-term care facilities, broadening reach without brick-and-mortar expansion. Manufacturers differentiate with cloud platforms that route images to interpreting radiologists, securing continuing relevance across every end user in the United States ultrasound devices market.
Geography Analysis
The Northeast concentrates early-stage adoption thanks to academic hospitals that pilot artificial intelligence and therapeutic ultrasound trials. Large integrated delivery networks there refresh fleets regularly, creating a pivotal proving ground for next-generation scanners. Rural counties in the same region still lack sonographers, so vendors promote tele-ultrasound packages that route studies to urban reading hubs.
Midwest health systems emphasize cost discipline, selecting handheld devices that share probes across family medicine, emergency, and obstetrics. State licensing gaps complicate workforce planning, yet local manufacturing clusters shorten lead times for replacement parts, preserving uptime for hospital networks that cover vast catchment areas.
Population migration and facility growth drive the South to outpace national averages in unit shipments. Physician shortages magnify the appeal of AI-guided handhelds that reduce dependency on specialty training, while new ambulatory centers choose mid-range carts to balance capital costs and throughput.
The West leverages technology sector proximity to pioneer connected ultrasound ecosystems. Venture-backed start-ups partner with teaching hospitals to beta test cloud analytics, and state telehealth laws facilitate reimbursement for remote scanning in mountainous and tribal regions. Collectively, regional needs create a mosaic of opportunities that anchor sustained demand in the United States ultrasound devices market.
Regulatory Landscape
In the United States, diagnostic ultrasound systems and transducers are regulated by the FDA, typically as Class II devices (for example, under 21 CFR 892.1560), and generally reach the market via the 510(k) pathway guided by FDA expectations for marketing clearance of diagnostic ultrasound systems and transducers. Cybersecurity and software documentation requirements have become more prominent for connected scanners, in step with broader FDA device regulation controls and a deeper premarket submission package.
A key compliance milestone is the FDA Quality Management System Regulation (QMSR) taking effect on Feb 2, 2026, which incorporates ISO 13485:2016 into the U.S. quality system framework and raises expectations for manufacturers' quality processes and audit readiness. For handheld and portable segments, the FDA issued guidance effective May 6, 2026 requiring certain unapproved portable ultrasound devices to carry clear labeling such as "For Non-Diagnostic Use Only" to avoid misrepresentation and support appropriate regulatory categorization, reinforcing the need for disciplined claims, labeling, and clearance strategies.
Competitive Landscape
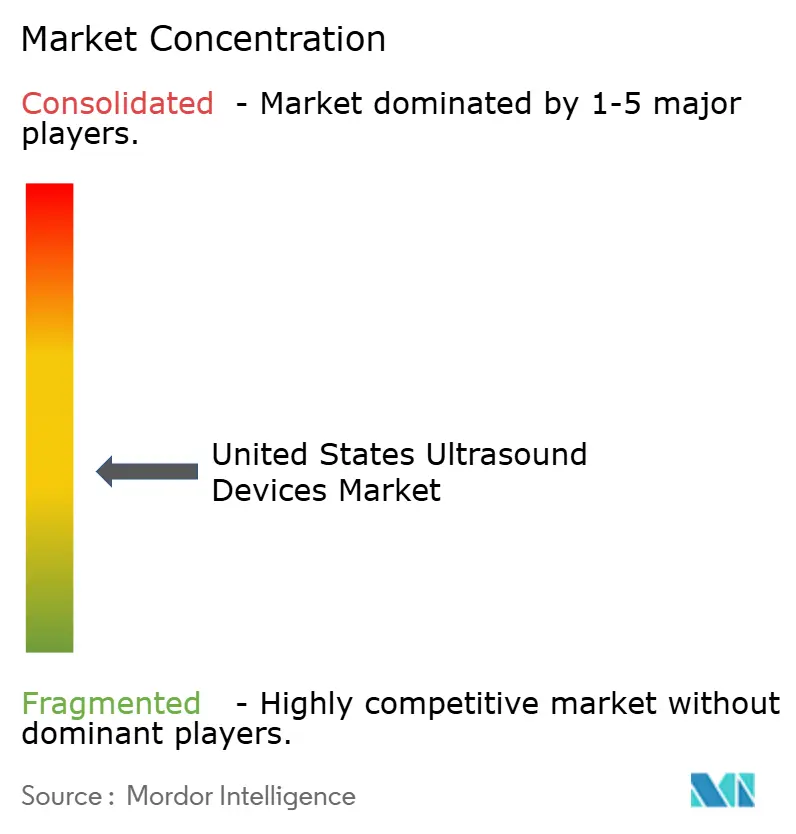
The market exhibits moderate fragmentation: GE HealthCare commands more than 30% share after doubling down on ultrasound R&D and acquiring Intelligent Ultrasound’s artificial intelligence assets for USD 51 million. Its NVIDIA collaboration delivers embedded edge computing that automates probe positioning, reinforcing leadership credentials. Philips, Canon, and Samsung Medison defend share through premium obstetrics and cardiology offerings, but Siemens Healthineers slipped to sixth after strategy volatility and reduced U.S. marketing spend.
Disruptors like Butterfly Network advance semiconductor-based handhelds and a subscription model that targets USD 500 million revenue by 2030. Vave Health entered with a wireless probe that toggles presets via a single piezoelectric crystal. Therapeutic specialists – Insightec in neurology and HistoSonics in oncology – expand the addressable base beyond diagnostics, nudging incumbents to acquire or partner.
Strategic alliances focus on cloud integration; Philips integrates its Reacts telehealth platform into Lumify, while Samsung Medison bought Sonio for AI-assisted workflows. Financing innovation also intensifies: GE HealthCare, Mindray, and Fujifilm now promote pay-per-scan contracts, defending margin without large capital cycles. Competition therefore hinges on ecosystem breadth, not just image quality, within the United States ultrasound devices market.
United States Ultrasound Devices Industry Leaders
GE Healthcare
Fujifilm Holdings Corporation
Canon Medical Systems
Koninklijke Philips N.V.
Siemens Healthineers AG
- *Disclaimer: Major Players sorted in no particular order

Market Opportunities and Future Outlook
Operational pressure from sonographer shortages and throughput targets continues to steer the market toward workflow automation, creating room for AI-assisted acquisition, protocol guidance, and reporting automation delivered through software upgrades and subscriptions on installed fleets. Recent actions reflect this direction: GE HealthCare expanded work with BARDA (approximately USD 35 million, announced in Feb 2026) to advance AI-powered ultrasound for trauma care and emergency preparedness, and Philips has continued to commercialize AI-centric ultrasound workflows in high-volume settings (including U.S. clearances in 2026 for Elevate Plus and the launch of Alturion).
Domestic supply resiliency and faster serviceability are also practical opportunities as providers reassess total cost of ownership under margin pressure. Philips announced more than USD 150 million of new investment (Aug 2025) in U.S. manufacturing and R&D, including Reedsville, Pennsylvania and Plymouth, Minnesota, which indicates that localized production, repair logistics, and U.S.-based software development are being treated as competitive levers alongside image quality. At the same time, tighter quality and cybersecurity expectations under QMSR and the FD&C Act support demand for vendors that can provide validated updates, device lifecycle management, and compliant cloud connectivity across hospitals, outpatient sites, and home-care workflows.
Recent Industry Developments
- June 2026: Canon Medical Systems unveils Aplio me X with AI-assisted workflows, an AI-enabled diagnostic ultrasound system. The release reinforces Canon's AI-backed ultrasound position in high-value diagnostics.
- June 2026: Fujifilm renews long-term collaboration with PENTAX Medical for ultrasound equipment supply (ARIETTA series integration). The partnership consolidates endoscopic ultrasound ecosystem and supports continuity of ARIETTA customer supply.
- February 2026: GE HealthCare expands BARDA AI-powered ultrasound collaboration (approximately $35 million). The expansion advances AI-powered trauma ultrasound solutions under a government-funded program.


Research Methodology Framework and Report Scope
Market Definition and Coverage
This methodology covers ultrasound systems sold and installed in the United States for diagnostic imaging and ultrasound-based therapy use, across care settings such as hospitals, imaging centers, and outpatient clinics.
Scope exclusions: we exclude ultrasound service contracts, probe-only aftermarket replacement sales, and refurbished or used equipment unless the equipment is sold as a new system through standard channels.
Segmentation Overview
- By Application
- Anesthesiology
- Cardiology
- Gynecology / Obstetrics
- Musculoskeletal
- Radiology
- Critical Care
- Urology
- Vascular
- Other Applications
- By Technology
- 2D Ultrasound Imaging
- 3D & 4D Ultrasound Imaging
- Doppler Imaging
- High-Intensity Focused Ultrasound
- Other Technologies
- By Portability
- Stationary Systems
- Portable Cart-based Systems
- Hand-held / Pocket Devices
- By End User
- Hospitals & Clinics
- Diagnostic Imaging Centers
- Ambulatory Surgical Centers
- Other End Users
- By Region
- Northeast
- Midwest
- South
- West
Data Sources, Market Sizing, and Validation
Desk Research
Desk research was used first to map what is being bought, where it is used, and what typically drives replacement cycles for ultrasound systems in the United States. We referenced public healthcare utilization and site-of-care indicators, along with policy and reimbursement signals that influence scan volumes and purchasing timing.
Sources included public and official references such as the US Food and Drug Administration device databases, Centers for Medicare and Medicaid Services procedure and payment references, Centers for Disease Control and Prevention health statistics, and publications from medical societies such as radiology and cardiology groups. We also reviewed peer-reviewed clinical journals for adoption patterns, for example point-of-care ultrasound in emergency and critical care, and used company filings, investor presentations, and reputable press to understand product positioning and pricing direction. For cross-checking corporate footprint and pipeline signals, we selectively used paid subscriptions for company financials and intelligence, patents, and news and financials. These desk research sources are illustrative only, and we relied on additional public and paid references to collect, validate, and clarify data points.
Primary Interviews and Surveys
Primary work was used next to pressure-test the desk findings with people who see purchasing decisions and day-to-day utilization. We spoke with clinical users, radiology and cardiology administrators, biomedical engineering teams, and distribution and service channel participants, so gaps around replacement timing, average selling prices, and mix shift could be addressed with realistic assumptions.
Coverage focused on major US demand pools, including large integrated delivery networks, as well as community hospitals and outpatient imaging sites, since buying patterns can differ by setting and budget cycle.
Distribution of primary research fieldwork respondents
| Company type | Respondent position |
|---|---|
| Top tier: 38% | CXOs: 20% |
| Mid tier: 42% | Functional/Unit leaders: 28% |
| Smaller Players: 20% | Managers: 52% |
Market-Sizing & Forecasting
Market sizing starts with a top-down reconstruction of the US demand pool by tying procedure-driven imaging needs and site-of-care footprint to equipment intensity, then translating that into system purchases over a replacement cycle. To keep the work recheckable, we used a limited set of repeatable inputs that can be updated each year, and we adjusted them using interview feedback before final totals were set.
Selective bottom-up checks were also used to corroborate the totals, mainly through sampled average selling prices by system class and application, observed shipment and tender activity patterns, and channel discussions on annual unit throughput. Key inputs that shaped the model include estimated scan volumes by major clinical use, installed-base refresh timing, penetration of point-of-care ultrasound in emergency and ICU settings, mix shift toward portable systems, and pricing direction tied to feature upgrades and procurement practices.
For forecasting, we used scenario analysis supported by trend lines in procedure demand and capital spending behavior, then refined it with primary inputs on planned replacement cycles and expected portability adoption. Where bottom-up detail was missing for smaller care settings, we handled gaps using calibrated ratios that link site counts and expected device density to the nearest comparable setting type.
Data Validation & Update Cycle
Outputs are validated through multiple checks that look for inconsistencies across utilization signals, equipment replacement timing, and implied pricing. If a calculated growth jump is not supported by procurement feedback or procedure trends, we revisit assumptions, and when needed we re-contact respondents to clarify what changed.
Before sign-off, the model is reviewed in steps by another analyst, with a focus on outliers in unit volumes, pricing ranges, and mix assumptions across care settings. The report is refreshed annually, and interim updates are added when material events affect demand or pricing. Before delivery, we run a fresh data pass so clients receive the most current view available at that time.
Mordor Intelligence's United States Ultrasound Devices Market Size Versus Other Published Estimates
Published values for US ultrasound devices can differ because the scope line is not always placed in the same place, and because pricing and replacement assumptions are handled differently across studies. Differences also show up when one estimate leans more on shipment and channel signals, and another leans more on procedure and installed-base logic.
CMS procedure and reimbursement signals, along with FDA device clearance activity and channel checks on purchasing cadence, are used as evidence anchors to keep Mordor Intelligence's estimate tied to new-system demand in the United States rather than adjacent revenue streams. Key gaps usually come from whether refurbished systems and service revenue are included, how portable devices are priced over time, and whether the base year currency timing and refresh cadence align to the same procurement cycle.
Benchmark comparison
| Source | Market Size | Gaps in Research Methodology |
|---|---|---|
| Mordor Intelligence | USD 3.11 B (2025) | |
| Industry Newswire A | USD 2.46 B (2024) | Uses an earlier base year and a different growth window, and the published figure does not clarify whether therapeutic systems, service revenue, or refurbished units are included or excluded, which can compress the 2024 value. |
| Industry Publisher B | USD 3.90 B (2023) | Appears to apply a broader revenue boundary and a longer horizon, and it likely blends device types and pricing tiers into a single average that can lift the starting year if portable and cart-based mixes are not separated. |
Across the three figures, the spread is mainly explained by boundary choices (new systems only versus broader revenue) and by the year used to anchor pricing and volume assumptions. By keeping inputs traceable to utilization, installed-base refresh, and realistic ASP ranges, our number stays easier to reconcile back to what US providers actually buy each year.


Key Questions Answered in the Report
What is the current value of the United States ultrasound devices market?
The market is valued at USD 3.27 billion in 2026 and is projected to reach USD 4.22 billion by 2031.
Which application area shows the fastest growth?
Critical care ultrasound leads with a 6.42% CAGR as bedside imaging becomes standard in emergency and intensive care units.
How fast are handheld ultrasound devices growing?
Handheld scanners are expected to post an 7.78% CAGR through 2031 as prices fall below USD 4,000 and tele-guidance capabilities expand.
What technological segment currently holds the largest share?
3D and 4D imaging systems account for 42.05% of revenue due to superior visualization in obstetrics and cardiology.
How are reimbursement changes influencing purchasing decisions?
Medicare outpatient payment increases and physician fee cuts are shifting investments toward portable systems that optimize throughput and reduce per-scan costs.
Which companies are leading innovation in AI-enabled ultrasound?
GE HealthCare, Philips, and Butterfly Network top the list, with platforms that automate image acquisition and integrate cloud-based analytics.
Page last updated on:


 Your data is secure and never sold or shared.


