Polyamide (PA) 6 Market Size and Share
Market Overview
| Study Period | 2020 - 2031 |
|---|---|
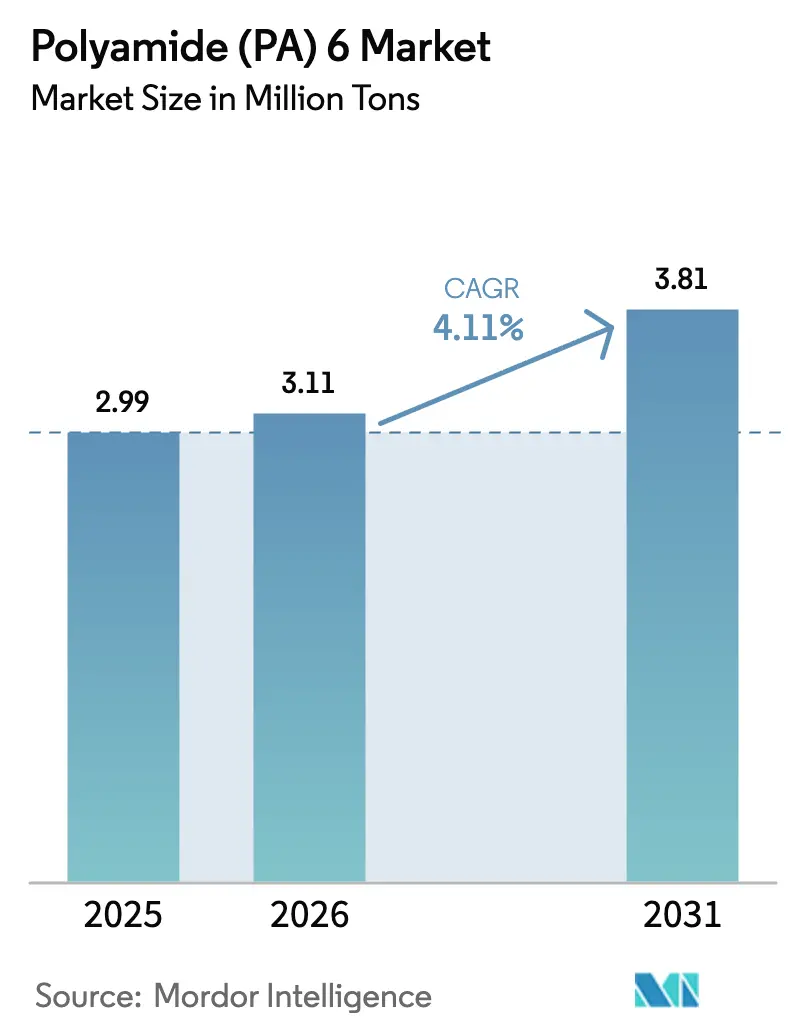
| Market Volume (2026) | 3.11 Million tons |
| Market Volume (2031) | 3.81 Million tons |
| Growth Rate (2026 - 2031) | 4.11% CAGR |
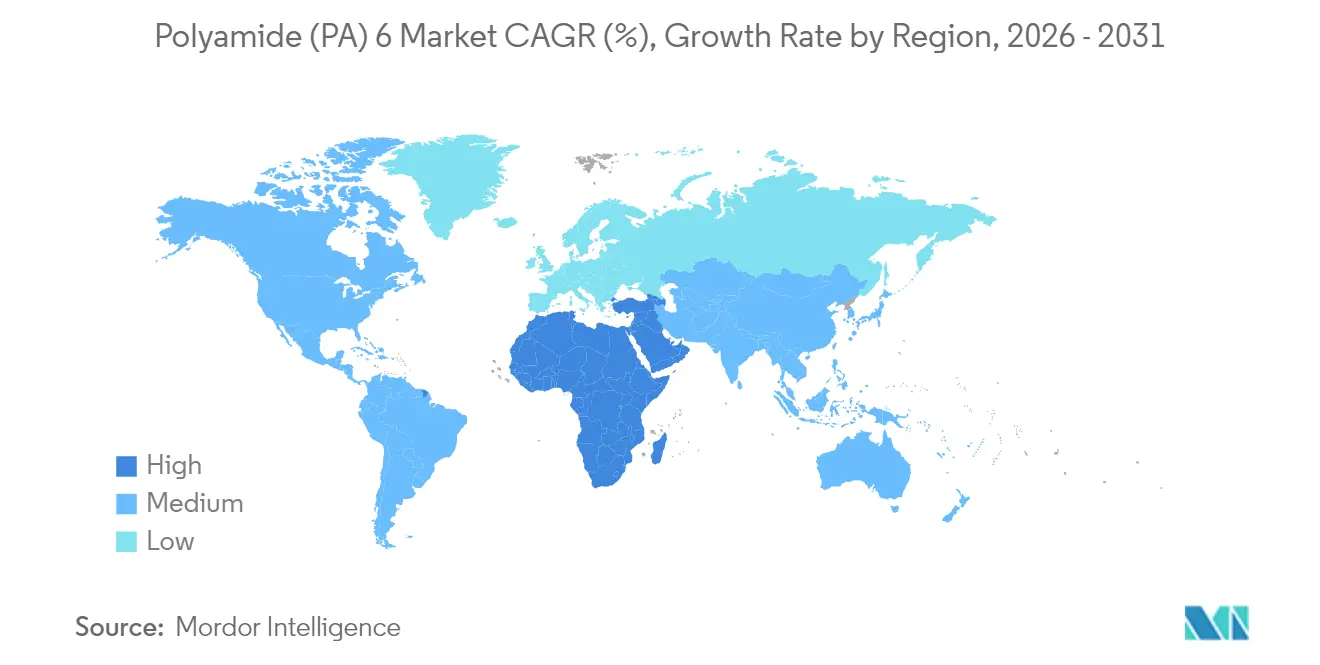
| Fastest Growing Market | Middle East and Africa |
| Largest Market | Asia-Pacific |
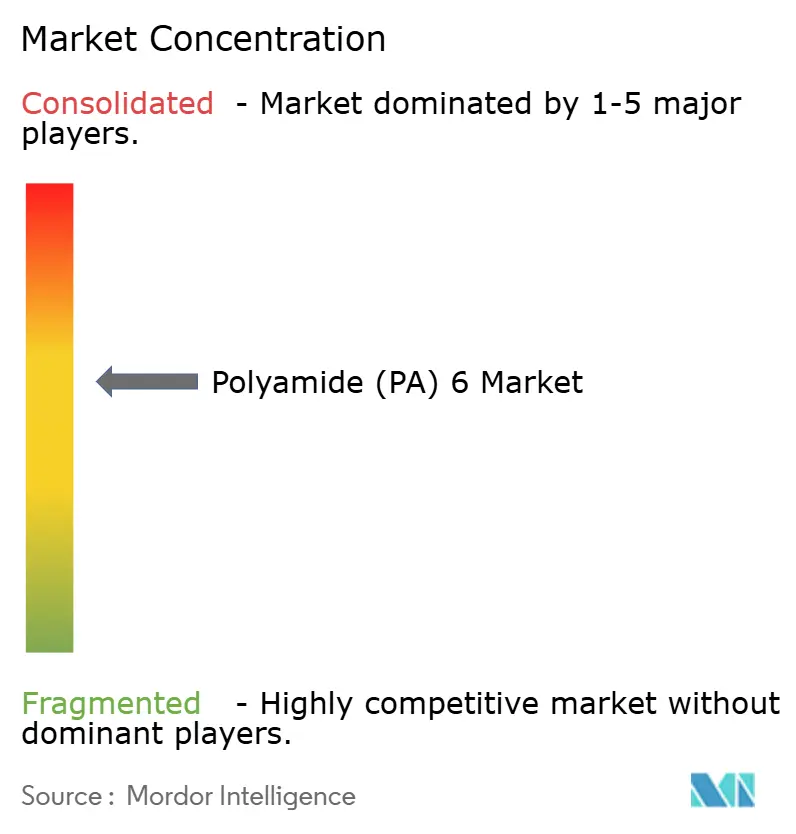
| Market Concentration | Medium |
Major Players *Disclaimer: Major Players sorted in no particular order Image © Mordor Intelligence. Reuse requires attribution under CC BY 4.0. | |
Polyamide (PA) 6 Market Analysis by Mordor Intelligence
Polyamide (PA) 6 Market size in 2026 is estimated at 3.11 Million tons, growing from 2025 value of 2.99 Million tons with 2031 projections showing 3.81 Million tons, growing at 4.11% CAGR over 2026-2031. Continued momentum arises from automotive lightweighting programs, the pivot toward mono-material flexible films in packaging, and infrastructure build-outs in the Middle East that collectively favor advanced thermoplastics over metal and commodity polymers. Design engineers increasingly specify PA6 for applications where stiffness-to-weight balance, chemical resistance, and cost efficiency converge, keeping the Polyamide 6 market on a steady expansion path. OEM sustainability pledges and updated recycling targets further accelerate adoption because the polymer can be chemically depolymerized back to caprolactam at industrial scale, enabling true circularity. Regionally, Asia-Pacific’s vertically integrated production chain anchors global supply, while Europe’s regulatory environment pushes local producers to showcase life-cycle emissions reduction. Competitive differentiation therefore tilts toward players capable of pairing cost leadership with verifiable low-carbon credentials.
Key Report Takeaways
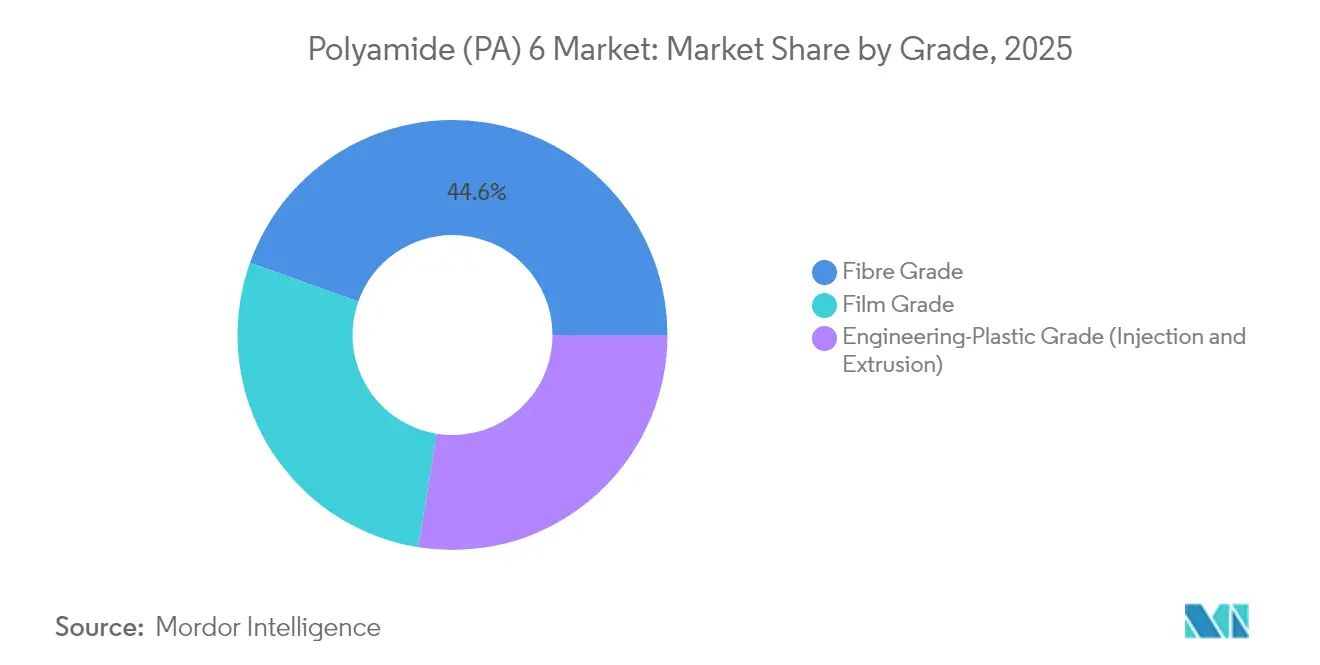
- By grade, fibre applications led with 44.55% share of the Polyamide 6 market size in 2025, while film grade expanded at a brisk 5.72% CAGR to 2031.
- By end-user industry, automotive accounted for 29.78% of Polyamide 6 market share in 2025, whereas packaging posted the fastest 5.85% CAGR through 2031.
- By geography, Asia-Pacific dominated with 51.83% of the Polyamide 6 market size in 2025, yet the Middle-East and Africa region is advancing at a 4.78% CAGR to 2031.
Note: Market size and forecast figures in this report are generated using Mordor Intelligence’s proprietary estimation framework, updated with the latest available data and insights as of 2026.
Global Polyamide (PA) 6 Market Trends and Insights
Driver Impact Analysis*
| Drivers | (~) % Impact on CAGR Forecast | Geographic Relevance | Impact Timeline |
|---|---|---|---|
| EV lightweighting push | +1.2% | Global; APAC and EU lead | Medium term (2-4 years) |
| Surge in monofilament demand for 3-D printing | +0.8% | North America and EU, expanding to APAC | Short term (≤ 2 years) |
| OEM shift to mono-material flexible films | +0.7% | Global; EU regulation steers | Medium term (2-4 years) |
| Adoption in offshore wind cable sheathing (sub-10 kV) | +0.6% | Europe and APAC coastal regions | Long term (≥ 4 years) |
| Circular-economy mandates in EU and China | +0.5% | EU core, China roll-out | Long term (≥ 4 years) |
| Source: Mordor Intelligence | |||


EV Lightweighting Push
Electric-vehicle programs remain the single most visible catalyst for Polyamide 6 market growth. Tesla’s Model Y and European EV platforms, such as BMW iX, jointly illustrate how PA6 structural modules, battery trays, and under-hood components reduce curb weight by 15–20% without undermining crash-worthiness. Thermal stability and inherent electrical insulation allow battery packs to stay cooler and safer, reinforcing the material’s functional appeal. As annual EV production rises from 14 million units in 2024 to roughly 40 million by 2030, vehicle architects are baking in 8-12 kg of engineered polyamides per car, cementing a long-running demand stream. The opportunity stretches across injection-molded housings, extrusion-grade profiles, and glass-fiber-reinforced compounds, all extending the Polyamide 6 market footprint. Tier 1 suppliers have therefore intensified qualification work for metal-replacement brackets, brackets, and mounts that meet OEM thermal shock cycles.
Surge in Monofilament Demand for 3-D Printing
Industrial additive manufacturing shifts from prototyping toward serial production, and Polyamide 6 monofilament sits at the heart of that evolution. Automotive and aerospace shops harness the material for functional tooling where aluminum would be over-engineered or cost-intensive. The net effect is a meaningful 0.8% CAGR uplift attributed solely to monofilament use, magnifying the Polyamide 6 market’s relevance for Industry 4.0 production lines. Tooling inserts printed in PA6 can replace machined PEEK for non-critical fixtures, yielding cost savings while freeing capacity on conventional CNC assets. Schools and research labs likewise upgrade from PLA to PA6 to teach real-world mechanical performance, cultivating the next generation of polymer engineers. As open-material platforms flourish, ease of diameter control and consistent melt viscosity keep PA6 the workhorse filament for robust end-parts.
OEM Shift to Mono-Material Flexible Films
Packaging brands are under regulatory pressure to abandon multi-layer laminates that hinder recycling streams. Mondi Group’s PA6 barrier film formats, for instance, deliver oxygen transmission rates low enough for dry-food shelf-life yet remain compatible with mechanical recycling setups. The structural simplicity eliminates aluminum or EVOH tie layers, trimming complexity and cutting recycling contamination risk. European converters report a 25–30% boost in flexible-film recyclability after switching from heterogeneous laminations to mono-material PA6 films, underscoring a key 0.7% CAGR bump for the Polyamide 6 market. This paradigm spreads into North America as extended producer responsibility (EPR) laws tighten. Brand owners now design packaging to hit 65% recycling rates under upcoming EU thresholds, and Polyamide 6 enables compliance without sacrificing barrier performance. Across retail channels, single-material pouches help logistics partners meet internal zero-waste pledges, rounding out a virtuous cycle that fortifies PA6 demand.
Circular-Economy Mandates in EU and China
Legislators have introduced roadmap targets that oblige producers to step beyond recycled-content pledges and into verifiable end-of-life recovery. The EU Packaging and Packaging Waste Regulation compels 65% collection rates by 2030 and pairs that with checkpoints for chemical-recycling progress[1]European Union, “Packaging and Packaging Waste Regulation,” eur-lex.europa . Producers expanding depolymerization or solvent-based purification facilities gain a regulatory buffer against penalty fees that could otherwise erode profitability. As certification bodies map recycled-content claims to life-cycle assessments, verified PA6 loops become a competitive hedge, pushing demand for feedstock-ready post-consumer waste streams.
Restraint Impact Analysis*
| Restraints | (~) % Impact on CAGR Forecast | Geographic Relevance | Impact Timeline |
|---|---|---|---|
| Price volatility of caprolactam | -0.9% | Global; heavy APAC concentration | Short term (≤ 2 years) |
| Competition from bio-based PAs 10T and 11 | -0.4% | North America and EU premium niches | Medium term (2 – 4 years) |
| Carbon-footprint disclosure regulations | -0.3% | EU core; spreading worldwide | Medium term (2 – 4 years) |
| Source: Mordor Intelligence | |||
Competition from Bio-Based PAs 10T and 11
Polyamides derived from castor-oil monomers—such as Arkema’s Rilsan PA11—siphon share in high-temperature fuel lines, coaxial tubing, and offshore risers where chemical resistance outranks cost concerns. DuPont’s PA10T platforms additionally deliver low moisture uptake and improved dimensional stability, features prized in micro-precision molding for electronics. Although these bio-based grades command a 20–30% premium over PA6, regulatory procurement grids lean toward materials offering lower carbon intensity. Nevertheless, PA6 remains entrenched in cost-sensitive segments, implying any substitution will be incremental rather than wholesale.
Carbon-Footprint Disclosure Regulations
The EU Corporate Sustainability Reporting Directive, alongside California’s Climate Corporate Data Accountability Act, obliges firms to trace Scope 3 CO₂ from cradle to gate and to substantiate the data via third-party assurance[2]European Union, “Corporate Sustainability Reporting Directive,” eur-lex.europa . The instrumentation, verification, and personnel needed to comply add 2–3% to operating costs for medium-sized resin producers, a burden that not every firm can absorb promptly. Smaller entities may redirect capex away from capacity upgrades toward compliance paperwork, dampening supply growth in the Polyamide 6 market. In parallel, OEM scorecards often penalize vendors lacking low-carbon documentation, rerouting purchase orders toward larger incumbents that can shoulder rigorous ESG auditing.
*Our forecasts treat driver/restraint impacts as directional, not additive. The impact forecasts reflect baseline growth, mix effects, and variable interactions.
Segment Analysis
By End User Industry: Automotive Leads, Packaging Accelerates
Automotive maintained a 29.78% slice of the Polyamide 6 market share in 2025, owing to high-volume parts ranging from intake manifolds to seat frames. Component engineers rely on glass-fiber-reinforced PA6 for a strength-to-weight ratio unachievable with stamped steel at a similar cost. Segment-specific adhesion to metal insert over-molding anchors long-term contracts, securing baseline tonnage for resin makers. At the same time, cabin electrification pushes additional connectors, clips, and housings into PA6 thanks to its electrical insulation and dimensional stability. Powertrain electrification merely intensifies this trend as cooling plates, battery carriers, and HV junction boxes seek lightweight insulation.
By contrast, packaging, while only a mid-single-digit volume slice in 2025, is advancing at a 5.85% CAGR that outpaces every other end-use vertical. Brand owners gravitating to mono-material barrier films are championing that shift, and municipal recycling mandates amplify momentum. This dual-pacing dynamic preserves automotive’s headline share yet positions packaging as the stealth growth engine within the Polyamide 6 market.


By Grade: Fibre Dominates, Film Catalyzes Growth
Fibre-grade resins captured 44.55% of 2025 volumes, underpinned by stable textile and carpet outlets where nylon’s resilience and dye uptake remain benchmarks. Tire-cord reinforcement, geotextiles, and conveyor belts further anchor usage because mechanical replacement cycles align neatly with PA6 fatigue life. However, these mature channels expand mainly at population growth rates, leaving limited upside beyond GDP multipliers. Film-grade PA6, in contrast, is charting a 5.72% CAGR to 2031 on the back of BOPA capacity ramp-ups targeted at high-barrier food pouches. Film processors enjoy PA6’s heat-sealing latitude and stiffness, attributes that shorten pouch cycle times on automated lines. The end result is a material class with headroom to capture incumbent PVdC or EVOH laminates in a bid to streamline recycling.
Engineering-plastic grades straddle automotive structural modules, gear housings, and power-tool casings, drawing value from glass-fiber and mineral-filled variants that elevate modulus beyond 10 GPa. Compounders tweak nucleating agents and lubricant packages to meet impact and wear criteria, ensuring components survive under-hood thermal cycling. Regulatory trends toward heavy-metal-free stabilization have required formulators to replace copper iodide additives with benign alternatives, proving PA6’s adaptability to evolving compliance needs,
Geography Analysis
Asia-Pacific’s 51.83% command of global volume in 2025 underscores its feedstock-to-finished-goods integration. China’s major share of caprolactam capacity, paired with massive PA6 polymerization clusters in Jiangsu and Zhejiang provinces, secures supply continuity and eases export pricing pressure.
Europe captures share through specialty niches that value traceable low-carbon supply. The EU Corporate Sustainability Reporting Directive catalyzes domestic chemical recycling pilots, such as BASF’s depolymerization and solvent-based recovery routes earmarked for end-of-life vehicle plastic streams. Germany’s automotive stalwarts leverage local grade customizations, while France’s aerospace factories secure flame-retardant PA6 for cabin interiors. Supply resilience remains a boardroom topic, prompting many EU converters to dual-source between in-region suppliers and APAC affiliates. This dynamic protects against caprolactam spikes emanating from Asia while upholding tight quality protocols demanded by EU end markets.
North America exercises discipline by focusing on higher-margin outlets: aerospace brackets, electrical connectors, and demanding additive-manufacturing parts. Domestic compounders bring UL and FMVSS certifications that allow rapid spec-in for new platforms. The Middle East and Africa, though still under 5% of world consumption, expands at 4.78% CAGR on public-sector infrastructure upgrades and the Saudi Vision 2030 industrial build-out. New automotive assembly lines in the Gulf Cooperation Council nations generate resin off-take agreements, while proximity to petrochemical feedstocks yields cost leverage for local polymerizers.

Competitive Landscape
The Polyamide 6 market exhibits moderate fragmentation. BASF, Arkema, DSM-Firmenich, Toray Industries, and DOMO Chemicals utilize backward-integration to caprolactam and strategic positioning near automotive hubs to guard share. BASF’s Ultramid LowPCF and Biomass-Balance grades illustrate how carbon-footprint transparency becomes a selling point, enabling premium pricing in OEM vendor lists. Process innovation centers on advanced polymerization control via near-infrared spectroscopy and AI-driven melt-viscosity prediction, which cut batch heterogeneity and reduce off-grade scrap. Digital twin deployment on compounding lines further optimizes fiber-reinforcement dispersion, translating into reproducible mechanical properties. Sustainability remains the pivotal battleground: producers publicize pilot depolymerization units and scope joint ventures with recyclers to secure post-consumer feedstock.
Polyamide (PA) 6 Industry Leaders
BASF
Domo Chemicals
Highsun Holding Group
LANXESS
UBE Corporation
- *Disclaimer: Major Players sorted in no particular order

Recent Industry Developments
- October 2025: BASF introduced Ultramid LowPCF and Ultramid BMB PA6 grades in North America, both leveraging renewable natural gas as feedstock.
- October 2025: BASF unveiled depolymerization and solvent-based recycling processes to reclaim PA6 from end-of-life vehicles in anticipation of forthcoming EU ELV mandates.


Global Polyamide (PA) 6 Market Report Scope
Aerospace, Automotive, Building and Construction, Electrical and Electronics, Industrial and Machinery, Packaging are covered as segments by End User Industry. Africa, Asia-Pacific, Europe, Middle East, North America, South America are covered as segments by Region.| Automotive |
| Electrical and Electronics |
| Packaging |
| Industrial and Machinery |
| Aerospace |
| Building and Construction |
| Other End-user Industries |
| Fibre Grade |
| Film Grade |
| Engineering-Plastic Grade (Injection and Extrusion) |
| Asia-Pacific | China |
| Japan | |
| India | |
| South Korea | |
| Australia | |
| Malaysia | |
| Rest of Asia-Pacific | |
| North America | United States |
| Canada | |
| Mexico | |
| Europe | Germany |
| France | |
| Italy | |
| United Kingdom | |
| Russia | |
| Rest of Europe | |
| South America | Brazil |
| Argentina | |
| Rest of South America | |
| Middle-East and Africa | Saudi Arabia |
| United Arab Emirates | |
| Nigeria | |
| South Africa | |
| Rest of Middle-East and Africa |
| By End User Industry | Automotive | |
| Electrical and Electronics | ||
| Packaging | ||
| Industrial and Machinery | ||
| Aerospace | ||
| Building and Construction | ||
| Other End-user Industries | ||
| By Grade | Fibre Grade | |
| Film Grade | ||
| Engineering-Plastic Grade (Injection and Extrusion) | ||
| By Geography | Asia-Pacific | China |
| Japan | ||
| India | ||
| South Korea | ||
| Australia | ||
| Malaysia | ||
| Rest of Asia-Pacific | ||
| North America | United States | |
| Canada | ||
| Mexico | ||
| Europe | Germany | |
| France | ||
| Italy | ||
| United Kingdom | ||
| Russia | ||
| Rest of Europe | ||
| South America | Brazil | |
| Argentina | ||
| Rest of South America | ||
| Middle-East and Africa | Saudi Arabia | |
| United Arab Emirates | ||
| Nigeria | ||
| South Africa | ||
| Rest of Middle-East and Africa | ||


Market Definition
- End-user Industry - Building & Construction, Packaging, Automotive, Aerospace, Industrial Machinery, Electrical & Electronics, and Others are the end-user industries considered under the polyamide 6 market.
- Resin - Under the scope of the study, virgin polyamide 6 resin in the primary forms such as powder, pellet, etc. are considered.
| Keyword | Definition |
|---|---|
| Acetal | This is a rigid material that has a slippery surface. It can easily withstand wear and tear in abusive work environments. This polymer is used for building applications such as gears, bearings, valve components, etc. |
| Acrylic | This synthetic resin is a derivative of acrylic acid. It forms a smooth surface and is mainly used for various indoor applications. The material can also be used for outdoor applications with a special formulation. |
| Cast film | A cast film is made by depositing a layer of plastic onto a surface then solidifying and removing the film from that surface. The plastic layer can be in molten form, in a solution, or in dispersion. |
| Colorants & Pigments | Colorants & Pigments are additives used to change the color of the plastic. They can be a powder or a resin/color premix. |
| Composite material | A composite material is a material that is produced from two or more constituent materials. These constituent materials have dissimilar chemical or physical properties and are merged to create a material with properties unlike the individual elements. |
| Degree of Polymerization (DP) | The number of monomeric units in a macromolecule, polymer, or oligomer molecule is referred to as the degree of polymerization or DP. Plastics with useful physical properties often have DPs in the thousands. |
| Dispersion | To create a suspension or solution of material in another substance, fine, agglomerated solid particles of one substance are dispersed in a liquid or another substance to form a dispersion. |
| Fiberglass | Fiberglass-reinforced plastic is a material made up of glass fibers embedded in a resin matrix. These materials have high tensile and impact strength. Handrails and platforms are two examples of lightweight structural applications that use standard fiberglass. |
| Fiber-reinforced polymer (FRP) | Fiber-reinforced polymer is a composite material made of a polymer matrix reinforced with fibers. The fibers are usually glass, carbon, aramid, or basalt. |
| Flake | This is a dry, peeled-off piece, usually with an uneven surface, and is the base of cellulosic plastics. |
| Fluoropolymers | This is a fluorocarbon-based polymer with multiple carbon-fluorine bonds. It is characterized by high resistance to solvents, acids, and bases. These materials are tough yet easy to machine. Some of the popular fluoropolymers are PTFE, ETFE, PVDF, PVF, etc. |
| Kevlar | Kevlar is the commonly referred name for aramid fiber, which was initially a Dupont brand for aramid fiber. Any group of lightweight, heat-resistant, solid, synthetic, aromatic polyamide materials that are fashioned into fibers, filaments, or sheets is called aramid fiber. They are classified into Para-aramid and Meta-aramid. |
| Laminate | A structure or surface composed of sequential layers of material bonded under pressure and heat to build up to the desired shape and width. |
| Nylon | They are synthetic fiber-forming polyamides formed into yarns and monofilaments. These fibers possess excellent tensile strength, durability, and elasticity. They have high melting points and can resist chemicals and various liquids. |
| PET preform | A preform is an intermediate product that is subsequently blown into a polyethylene terephthalate (PET) bottle or a container. |
| Plastic compounding | Compounding consists of preparing plastic formulations by mixing and/or blending polymers and additives in a molten state to achieve the desired characteristics. These blends are automatically dosed with fixed setpoints usually through feeders/hoppers. |
| Plastic pellets | Plastic pellets, also known as pre-production pellets or nurdles, are the building blocks for nearly every product made of plastic. |
| Polymerization | It is a chemical reaction of several monomer molecules to form polymer chains that form stable covalent bonds. |
| Styrene Copolymers | A copolymer is a polymer derived from more than one species of monomer, and a styrene copolymer is a chain of polymers consisting of styrene and acrylate. |
| Thermoplastics | Thermoplastics are defined as polymers that become soft material when it is heated and becomes hard when it is cooled. Thermoplastics have wide-ranging properties and can be remolded and recycled without affecting their physical properties. |
| Virgin Plastic | It is a basic form of plastic that has never been used, processed, or developed. It may be considered more valuable than recycled or already used materials. |


Research Methodology
Mordor Intelligence follows a four-step methodology in all our reports.
- Step-1: Identify Key Variables: The quantifiable key variables (industry and extraneous) pertaining to the specific product segment and country are selected from a group of relevant variables & factors based on desk research & literature review; along with primary expert inputs. These variables are further confirmed through regression modeling (wherever required).
- Step-2: Build a Market Model: In order to build a robust forecasting methodology, the variables and factors identified in Step-1 are tested against available historical market numbers. Through an iterative process, the variables required for market forecast are set and the model is built on the basis of these variables.
- Step-3: Validate and Finalize: In this important step, all market numbers, variables and analyst calls are validated through an extensive network of primary research experts from the market studied. The respondents are selected across levels and functions to generate a holistic picture of the market studied.
- Step-4: Research Outputs: Syndicated Reports, Custom Consulting Assignments, Databases & Subscription Platforms


