Poly Aluminum Chloride Market Size and Share
Market Overview
| Study Period | 2020 - 2031 |
|---|---|
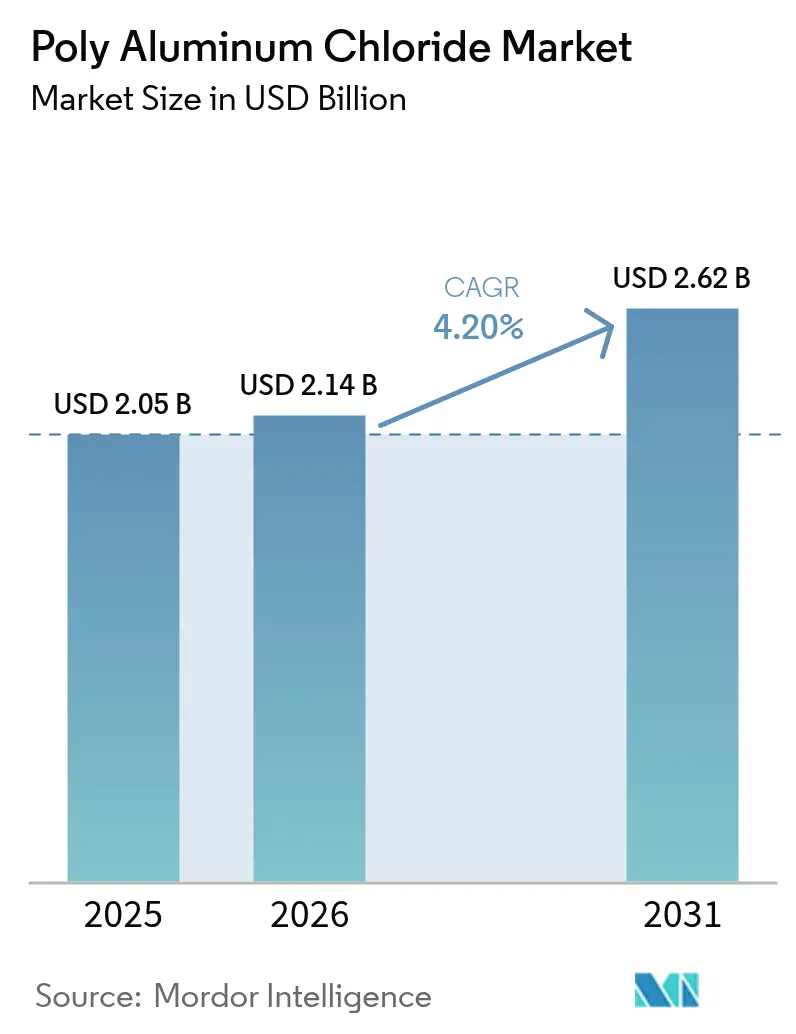
| Market Size (2026) | USD 2.14 Billion |
| Market Size (2031) | USD 2.62 Billion |
| Growth Rate (2026 - 2031) | 4.20% CAGR |
| Fastest Growing Market | Middle East and Africa |
| Largest Market | Asia Pacific |
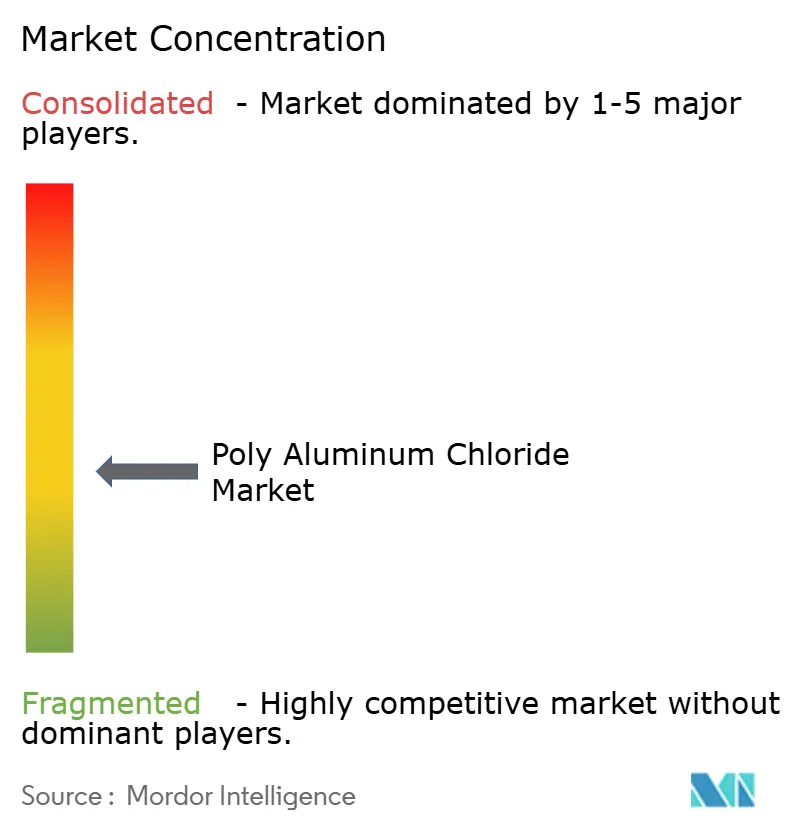
| Market Concentration | Medium |
Major Players *Disclaimer: Major Players sorted in no particular order Image © Mordor Intelligence. Reuse requires attribution under CC BY 4.0. | |
Poly Aluminum Chloride Market Analysis by Mordor Intelligence
The Poly Aluminum Chloride Market size was valued at USD 2.05 billion in 2025 and estimated to grow from USD 2.14 billion in 2026 to reach USD 2.62 billion by 2031, at a CAGR of 4.20% during the forecast period (2026-2031). Persistent demand from municipal water utilities and industrial facilities anchors growth as poly aluminum chloride (PAC) consistently outperforms traditional aluminum sulfate in varied pH conditions and in the removal of emerging contaminants. Regulators are tightening discharge limits for chemical oxygen demand and total suspended solids, prompting plants to favor PAC’s lower residual aluminum levels and broader operating window. Rising desalination capacity in Asia-Pacific, combined with expanding municipal water-reuse projects, sustains baseline consumption even when raw-material price spikes create short-term cost pressure. Competitive strategies now tilt toward basicity-tailored grades, digital dosing support, and logistics optimization that curbs transport emissions while ensuring just-in-time delivery.
Key Report Takeaways
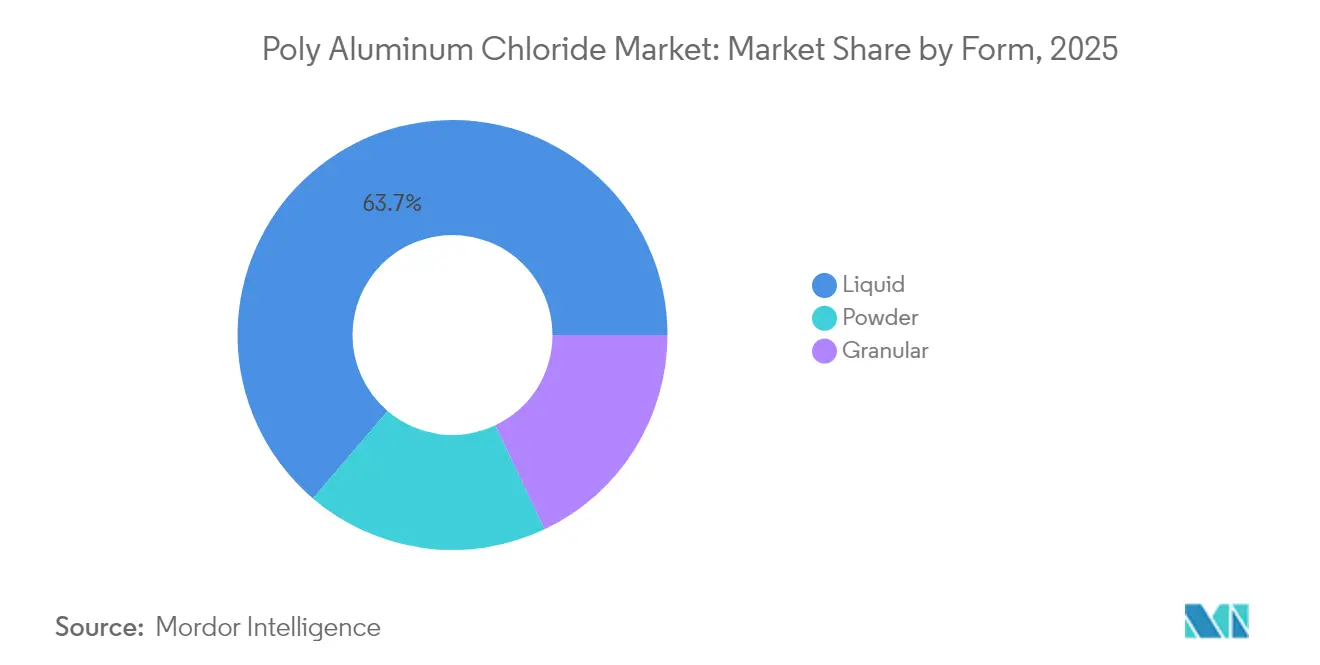
- By form, liquid products dominated with 63.75% poly aluminum chloride market share in 2025 while powder grades are forecast to grow at a 4.52% CAGR through 2031.
- By basicity level, medium-basicity grades captured 46.35% revenue share in 2025; high-basicity formulations are projected to expand at a 4.74% CAGR to 2031.
- By end-user industry, water treatment accounted for 60.65% of the poly aluminum chloride market size in 2025, whereas cosmetics and personal care is advancing at a 4.92% CAGR through 2031.
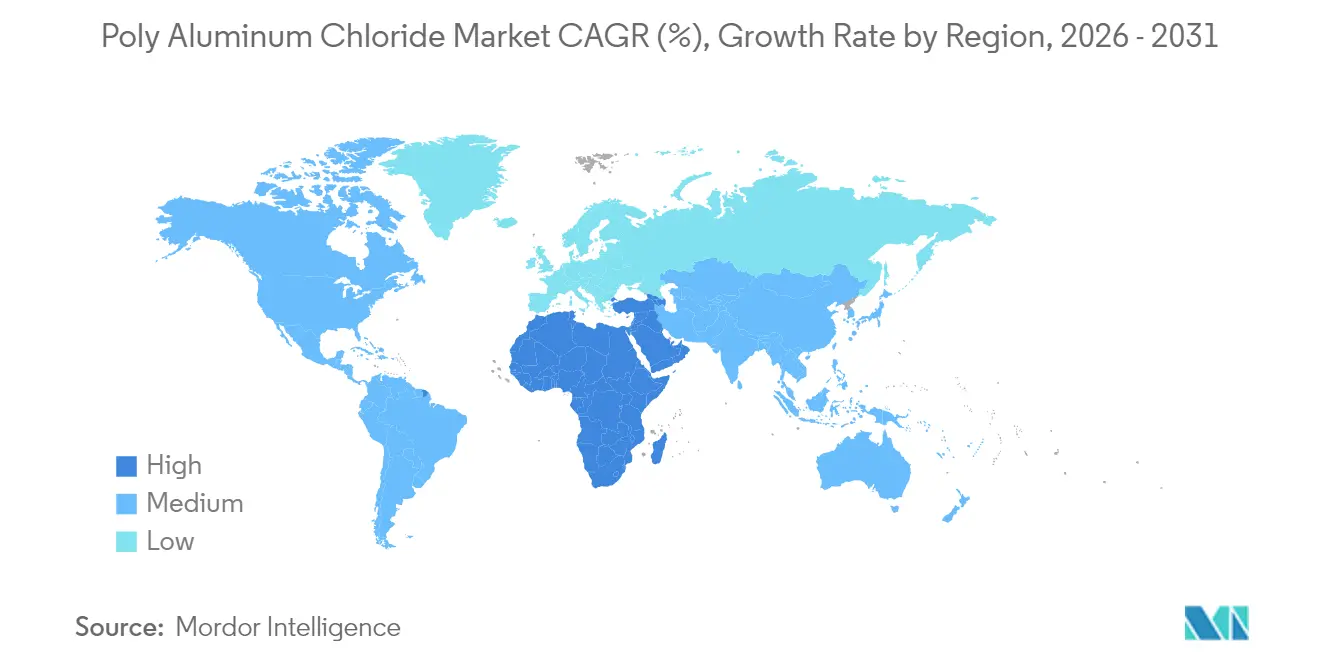
- By geography, Asia-Pacific led with 49.10% revenue share in 2025; Middle East and Africa is expected to be the fastest-growing region at a 4.38% CAGR between 2026 and 2031.
Note: Market size and forecast figures in this report are generated using Mordor Intelligence’s proprietary estimation framework, updated with the latest available data and insights as of 2026.
Global Poly Aluminum Chloride Market Trends and Insights
Driver Impact Analysis*
| Drivers | (~) % Impact on CAGR Forecast | Geographic Relevance | Impact Timeline |
|---|---|---|---|
| Tightening discharge norms for COD/TSS | +1.2% | Global, strongest in EU, North America, developed APAC | Medium term (2-4 years) |
| APAC desalination and municipal reuse build-out | +0.8% | Asia-Pacific core, spill-over to Middle East and Africa | Long term (≥ 4 years) |
| Cost advantage versus alum and ferric salts | +0.6% | Global | Short term (≤ 2 years) |
| High-basicity PAC for microplastics capture | +0.4% | North America and EU, expanding to APAC | Medium term (2-4 years) |
| On-site PAC electro-synthesis adoption | +0.3% | Industrial clusters in North America, EU, developed APAC | Long term (≥ 4 years) |
| Source: Mordor Intelligence | |||
Tightening Discharge Norms Drive Advanced Coagulation Adoption
Environmental agencies in the European Union, the United States, and advanced Asia-Pacific economies have introduced sharper chemical oxygen demand and total suspended solids thresholds that compel operators to adopt higher-performance coagulants. The forthcoming revision of the EU Urban Wastewater Treatment Directive in late 2025 formalizes enhanced nutrient removal targets, reinforcing preference for PAC, whose broader pH window and lower sludge generation reduce downstream handling costs. Industrial segments such as textiles and food processing now favor pre-polymerized aluminum chemistry that meets multiple discharge parameters concurrently, emphasizing PAC’s versatility. The combined regulatory momentum adds roughly EUR 40 million in annual chemical demand across EMEA treatment plants, underpinning steady procurement contracts despite commodity-price volatility.
APAC Desalination Expansion Fuels Coagulant Demand
Asia-Pacific governments continue to approve large-scale desalination and municipal reuse projects to counter water scarcity, positioning the region as the largest demand hub for PAC. China’s industrial water-reuse mandates, India’s Smart Cities initiative, and Southeast Asian infrastructure programs rely on high-basicity PAC for stable floc formation in saline feedwater. Mega-projects such as Malaysia’s RAPID complex and Indonesia’s new industrial corridors incorporate water-treatment trains that specify PAC at the pretreatment stage, ensuring compliance with feedwater quality requirements for downstream membranes. Suppliers respond by expanding regional manufacturing footprints to safeguard supply continuity and mitigate shipping costs.
Cost Optimization Drives PAC Adoption Over Conventional Coagulants
Plant operators under budget scrutiny calculate that PAC’s pre-polymerized aluminum species can achieve target turbidity at dosing rates 20-40% below those required for aluminum sulfate. Field audits in municipal facilities show total chemical cost reductions of 15-30% following the switch, with further savings accruing from lower sludge volumes and faster dewatering[1]National Health and Medical Research Council, “Polyaluminium Chloride | Australian Drinking Water Guidelines,” nhmrc.gov.au . The economic advantage becomes most pronounced in cold winters when alum performance degrades, reinforcing PAC’s role as a year-round default. Procurement teams, therefore, prioritize life-cycle treatment cost rather than spot chemical price, shielding PAC demand from short-term alum price dips.
High-Basicity Formulations Enable Microplastics Removal
Laboratory and pilot-plant studies confirm that PAC grades exceeding 60% basicity can remove up to 90% of microplastic particles under optimized flocculation conditions, far outperforming standard alum and ferric salts. Utilities in North America and Europe have started to specify these high-basicity variants in new drinking-water plant designs to anticipate likely microplastic regulations. The Al₁₃ polymer species prevalent in these formulations delivers stronger charge neutralization and bridging, capturing nanometer-scale plastics that bypass traditional coagulation. Early adoption creates a premium product tier, encouraging producers to upgrade spray-drying lines and offer application-engineering support.
Restraint Impact Analysis*
| Restraints | (~) % Impact on CAGR Forecast | Geographic Relevance | Impact Timeline |
|---|---|---|---|
| Volatile alumina and hydrochloric acid prices | -0.7% | Global, highest impact on import-dependent regions | Short term (≤ 2 years) |
| Tighter residual aluminum limits | -0.3% | North America and EU, expanding globally | Medium term (2-4 years) |
| Uptake of low-chemical membrane/electro-coag | -0.2% | OECD nations, chiefly advanced municipal plants | Long term (≥ 4 years) |
| Source: Mordor Intelligence | |||
Raw-Material Price Volatility Pressures Margins
Alumina spot prices in China climbed 35% year-to-date during 2024 as Guinea export disruptions hit global bauxite supply, creating the steepest cost spike since 2012. Hydrochloric acid values experienced parallel volatility tied to refinery operating rates, forcing PAC producers to renegotiate quarterly contracts. Large integrated suppliers partially absorb the impact through hedging strategies, but smaller regional firms without captive alumina supply face squeezed margins and may accelerate consolidation. Customers with long-term framework agreements gain price stability, yet competitive tenders increasingly incorporate cost-pass-through clauses to reflect raw-material dynamics.
Aluminum Residual Limits Challenge Product Positioning
Public-health agencies on both sides of the Atlantic are considering reducing permissible aluminum residuals in treated drinking water to below 0.05 mg/L, compelling PAC producers to fine-tune formulations and advise operators on tighter process control. Plants sourcing high-aluminum surface water face a dual challenge: maintaining turbidity targets while staying within emerging residual thresholds. Some utilities explore combining PAC with membrane filtration or electrocoagulation, which could divert part of future dosing volumes. Producers that offer low-residual specialty grades coupled with real-time dosing analytics stand to defend share, but the technical hurdle raises product-development costs.
*Our forecasts treat driver/restraint impacts as directional, not additive. The impact forecasts reflect baseline growth, mix effects, and variable interactions.
Segment Analysis
By Form: Liquid’s Installed Base Meets Powder’s Logistics Edge
because large municipal plants value turnkey bulk-delivery infrastructure that minimizes on-site handling. The segment’s entrenched position stems from decades-old procurement frameworks, proximity to producers, and immediate solubility that avoids sediment risks inside storage tanks. Even as feedstock prices fluctuate, utilities locked into long-term supply agreements maintain consistent order volumes, which stabilizes plant utilization rates for liquid lines.
Powder grades, however, are forecast to expand at a 4.52% CAGR through 2031 as transportation costs rise and exporters seek higher value density per container. Recent advances in spray-drying and anti-caking additives lengthen shelf life and strengthen moisture resistance, allowing powder to move deeper into land-locked markets without quality loss. Small community plants and industrial users with limited storage increasingly prefer concentrated powder that reconstitutes on demand, especially where road infrastructure restricts tanker access. As a result, global producers invest in modular powder plants that can be co-located with alumina sources to decouple production from end-market geography.


By Basicity Level: High-Performance Grades Capture Premium Demand
Medium-basicity grades between 40% and 60% basicity captured 46.35% of revenue in 2025 by offering a practical balance between cost and performance across diverse raw-water chemistries. Utilities facing seasonal swings in pH and turbidity gravitate toward this middle ground, minimizing the need for coagulant switching during shoulder seasons. Maintenance teams also value predictable sludge characteristics that fit existing dewatering assets, preserving life-cycle economics.
High-basicity products above 60% basicity are projected to rise at a 4.74% CAGR, underpinned by superior removal of microplastics and refractory organics. The presence of polymeric Al₁₃ and Al₃₀ species delivers faster floc formation and denser precipitates, reducing downstream filter loading. Industrial users managing high-turbidity effluents, especially in mining and petrochemical clusters, report chemical savings despite nominally higher unit prices. Low-basicity grades below 40% now occupy niche roles such as gentle floc formation for surface-water clarification in sensitive ecosystems, but shrinking uptake signals a migration toward performance-optimized alternatives.
By End-user Industry: Water Plants Anchor Demand; Cosmetics Outpaces Growth
Water utilities generated 60.65% of overall revenue in 2025, reflecting mandatory treatment volumes, infrastructure expansion, and regulatory enforcement. Municipal drinking-water projects funded by multilateral development banks assure a recurring baseline for bulk PAC deliveries, while industrial wastewater upgrades in pulp, textile, and food sectors augment specialty-grade demand.
Cosmetics and personal care, though still a smaller slice, is on track for a 4.92% CAGR through 2031 as formulators leverage aluminum chlorohydrate complexes in antiperspirants for reliable sweat-blocking efficacy and lower skin irritation. Brand owners highlight the ingredient’s established safety record and compatibility with emerging “sensitive skin” product lines. The paper industry continues using PAC as a dual coagulant and sizing aid, but volume growth remains muted in line with plateauing printing-paper consumption. Oil and gas uptake follows drilling cycles, with produced-water treatment offering sporadic but sizable spot demand.

Geography Analysis
Asia-Pacific held a dominant 49.10% share of the poly aluminum chloride market in 2025 on the back of unparalleled water-infrastructure investment, rapid urbanization, and a dense industrial base across China, India, and Southeast Asia. China alone accounts for over 40% of global consumption, underpinned by extensive municipal expansion and its position as the leading PAC exporter.
Middle East and Africa is forecast to record the highest regional CAGR at 4.38% through 2031 as desalination continues to pivot from thermal to membrane-based technologies that require precise coagulation pretreatment. Gulf Cooperation Council states invest in smart-city projects such as Saudi Arabia’s NEOM, each embedding large treatment plants that prefer high-basicity PAC for saline feedwater. Sub-Saharan African countries, meanwhile, channel World Bank financing into municipal projects where PAC’s broad pH window shields operators from variable raw-water chemistry, even as supply chains rely on imported product.
North America and Europe see modest but resilient growth driven by infrastructure rehabilitation and regulatory tightening. United States utilities facing aging pipe networks integrate PAC dosing optimization with digital sensors to meet revised Lead and Copper Rule guidelines, while European operators align with the updated Urban Wastewater Treatment Directive’s nutrient-removal stipulations. Although total volume expansion lags emerging regions, these mature markets prize premium, low-residual grades with full traceability and lifecycle documentation, sustaining healthy margins for suppliers with robust quality systems.

Competitive Landscape
Global supply is moderately frragmented. Integrated players leverage captive alumina streams, hydrochloric acid by-product utilization, and multi-product coagulant portfolios to buffer margin swings. They also embed technical service teams in customer plants, using performance-based contracts that align dosing, sludge handling, and monitoring. Strategic initiatives in 2024–2025 illustrate the sector’s direction. Kemira expanded ferric-chloride capacity in Europe to serve phosphorus-control applications while cross-selling PAC grades. Indian producer GACL commissioned a 32,000 TPA liquid PAC line in Vadodara and installed a spray dryer for 9,900 TPA powder, extending product reach beyond domestic tanker radius. Such moves underscore renewed capex aimed at basicity flexibility, logistics efficiency, and adjacency capture in high-growth segments like microplastics mitigation.
Poly Aluminum Chloride Industry Leaders
Aditya Birla Chemicals (India) Limited
Feralco AB
Gulbrandsen
Kemira
USALCO LLC
- *Disclaimer: Major Players sorted in no particular order

Recent Industry Developments
- February 2025: Gujarat Alkalies and Chemicals Limited (GACL) successfully commissioned 32,000 TPA of liquid PAC at its Coelho Complex, Vadodara.
- February 2025: GACL dispatched the first consignment of 9,900 MTPA PAC-30 powder from the newly installed spray-drying facility at the same site.


Global Poly Aluminum Chloride Market Report Scope
The scope of the poly aluminum chloride market report includes:
| Liquid |
| Powder |
| Granular |
| Low (less than 40% basicity) |
| Medium (40-60%) |
| High (more than 60%) |
| Water Treatment |
| Paper Industry |
| Cosmetics and Personal Care |
| Oil and Gas |
| Other End-user Industries |
| Asia-Pacific | China |
| India | |
| Japan | |
| South Korea | |
| ASEAN Countries | |
| Rest of Asia-Pacific | |
| North America | United States |
| Canada | |
| Mexico | |
| Europe | Germany |
| United Kingdom | |
| France | |
| Spain | |
| Italy | |
| Russia | |
| NORDIC Countries | |
| Rest of Europe | |
| South America | Brazil |
| Argentina | |
| Rest of South America | |
| Middle-East and Africa | Saudi Arabia |
| Turkey | |
| South Africa | |
| Rest of Middle-East and Africa |
| By Form | Liquid | |
| Powder | ||
| Granular | ||
| By Basicity Level | Low (less than 40% basicity) | |
| Medium (40-60%) | ||
| High (more than 60%) | ||
| By End-user Industry | Water Treatment | |
| Paper Industry | ||
| Cosmetics and Personal Care | ||
| Oil and Gas | ||
| Other End-user Industries | ||
| By Geography | Asia-Pacific | China |
| India | ||
| Japan | ||
| South Korea | ||
| ASEAN Countries | ||
| Rest of Asia-Pacific | ||
| North America | United States | |
| Canada | ||
| Mexico | ||
| Europe | Germany | |
| United Kingdom | ||
| France | ||
| Spain | ||
| Italy | ||
| Russia | ||
| NORDIC Countries | ||
| Rest of Europe | ||
| South America | Brazil | |
| Argentina | ||
| Rest of South America | ||
| Middle-East and Africa | Saudi Arabia | |
| Turkey | ||
| South Africa | ||
| Rest of Middle-East and Africa | ||


Key Questions Answered in the Report
What is the projected value of the poly aluminum chloride market in 2031?
The market is expected to reach USD 2.62 billion by 2031.
Which form of PAC is growing fastest?
Powder grades are poised to grow at a 4.52% CAGR, benefitting from reduced transport costs and enhanced shelf stability.
Why are high-basicity PAC grades gaining popularity?
They deliver superior removal of microplastics and other emerging contaminants while reducing overall chemical consumption.
Which region currently leads in PAC consumption?
Asia-Pacific commands just under half of global demand due to extensive desalination and municipal infrastructure programs.
How do volatile alumina prices influence PAC producers?
Sharp alumina price swings compress margins, especially for producers lacking captive supply, encouraging long-term hedging and supply-chain integration.
Page last updated on:


