Ferric Chloride Market Size and Share
Market Overview
| Study Period | 2020 - 2031 |
|---|---|
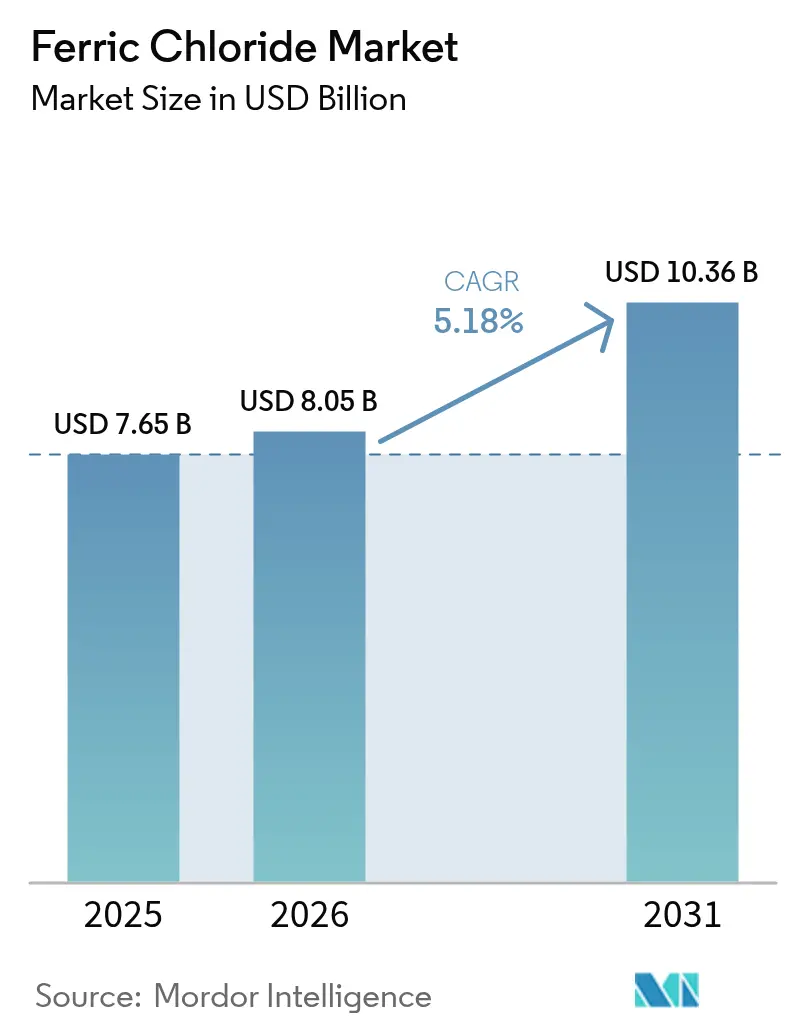
| Market Size (2026) | USD 8.05 Billion |
| Market Size (2031) | USD 10.36 Billion |
| Growth Rate (2026 - 2031) | 5.18% CAGR |
| Fastest Growing Market | South America |
| Largest Market | Asia Pacific |
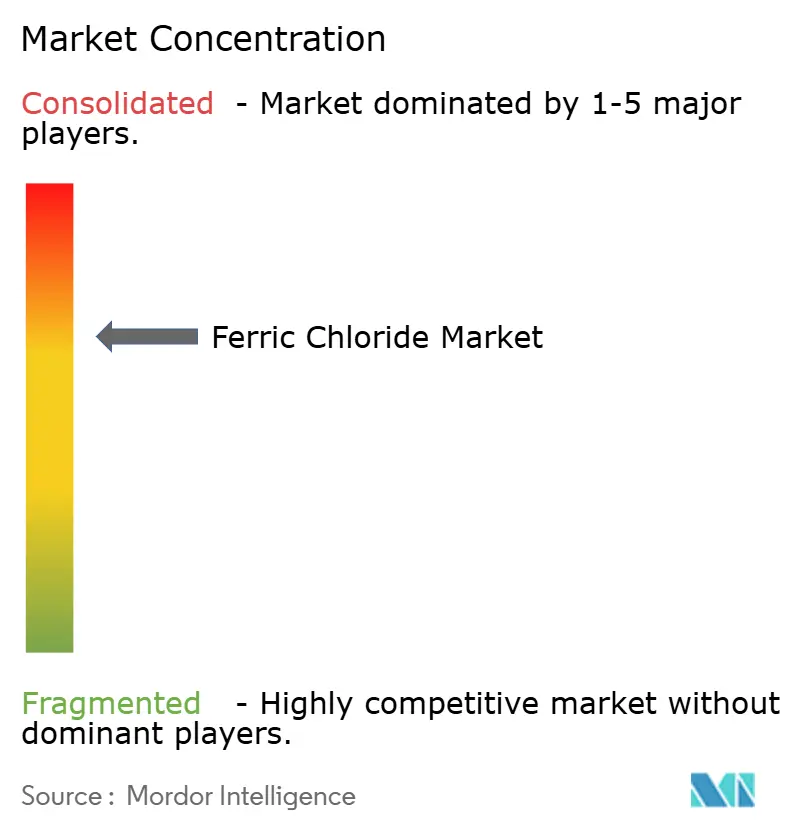
| Market Concentration | Medium |
Major Players *Disclaimer: Major Players sorted in no particular order Image © Mordor Intelligence. Reuse requires attribution under CC BY 4.0. | |
Ferric Chloride Market Analysis by Mordor Intelligence
The Ferric Chloride Market size was valued at USD 7.65 billion in 2025 and estimated to grow from USD 8.05 billion in 2026 to reach USD 10.36 billion by 2031, at a CAGR of 5.18% during the forecast period (2026-2031). Rapid urbanization and rigorous wastewater treatment mandates, together with the electronics sector’s demand for high-purity etchants, underpin steady volume gains and value expansion. Increasing capital spending on municipal plants, the scaling of printed circuit board (PCB) fabrication, and early commercial deployment of iron-based energy-storage chemistry are broadening use cases beyond legacy coagulation. Pricing differentiation is widening as specialized grades command premiums that offset modest volume growth in commodity categories, while regulatory compliance ensures resilient baseline demand even during macro-economic slowdowns.
Key Report Takeaways
- By grade, Industrial/Technical offerings captured 73.10% ferric chloride market share in 2025. Electronic Grade is advancing at a 5.72% CAGR through 2031, the fastest pace among all grades.
- By application, Water and Wastewater Treatment held 62.85% of the ferric chloride market size in 2025. PCB manufacturing is forecast to expand at a 5.61% CAGR between 2026 and 2031.
- By geography, Asia-Pacific accounted for 45.05% of global revenues in 2025; South America is growing at a 5.38% CAGR through 2031.
Note: Market size and forecast figures in this report are generated using Mordor Intelligence’s proprietary estimation framework, updated with the latest available data and insights as of 2026.
Global Ferric Chloride Market Trends and Insights
Drivers Impact Analysis*
| Driver | (~) % Impact on CAGR Forecast | Geographic Relevance | Impact Timeline |
|---|---|---|---|
| High demand from municipal and industrial wastewater plants | +1.80% | Global, focus on Asia-Pacific and North America | Long term (≥ 4 years) |
| Stricter discharge norms for heavy-metal and nutrient removal | +1.20% | North America and EU, expanding to Asia-Pacific | Medium term (2-4 years) |
| Infrastructure push boosting asphalt-blowing demand | +0.70% | Middle East and South America | Medium term (2-4 years) |
| Adoption in e-scrap hydrometallurgy and copper recovery | +0.60% | Asia-Pacific core, spill-over to North America | Long term (≥ 4 years) |
| Emerging use in iron-based redox-flow batteries | +0.90% | North America & EU, with APAC manufacturing | Long term (≥ 4 years) |
| Source: Mordor Intelligence | |||
High Demand from Municipal and Industrial Wastewater Plants
Global investment in municipal wastewater systems is projected to top USD 1 trillion by 2033 as cities upgrade aging infrastructure and expand capacity to meet rising urban populations. These projects directly elevate coagulant consumption because ferric chloride achieves reliable turbidity reduction while precipitating phosphorus and heavy metals in a single dosing step. Industrial demand is also ratcheting higher as reshoring of chemical and electronics manufacturing compels facilities to meet tougher pretreatment thresholds before discharging to municipal sewers. The chemical’s dual utility—process reagent and effluent coagulant—streamlines plant inventories and boosts procurement efficiencies, strengthening its preference when lifecycle costs are considered.
Stricter Discharge Norms for Heavy-Metal and Nutrient Removal
The United States Environmental Protection Agency’s 2024 rulemaking tightens nationwide phosphorus discharge limits to 0.5 mg/L for large plants, while EU Directive 2024/3019 imposes a 0.5–0.7 mg/L range on urban facilities[1]EUR-Lex, “Directive 2024/3019 on Urban Wastewater Treatment,” eur-lex.europa.eu . These thresholds reduce allowable nutrient loads by roughly one-third versus the previous regime, triggering higher ferric chloride dosing because iron(III) chemistry forms stable ferric phosphate flocs at low residual concentrations. Local regulators are cascading the standards to smaller plants, locking in chemical demand independent of broader economic cycles. Plants switching from aluminum to iron coagulants cite 15% lower total phosphorus levels and fewer post-precipitation polishing steps, solidifying the driver’s multi-year impact.
Infrastructure Push Boosting Asphalt-Blowing Demand
Ferric chloride catalyzes controlled oxidation in asphalt blowing, increasing binder viscosity and high-temperature stability for heavy-load pavements[2]G. I. Egorova et al., “Innovations in Asphalt Concrete,” iopscience.iop.org . Middle Eastern highway expansions and Brazil’s national logistics upgrade plan both specify polymer-modified or chemically blown asphalts for lanes expected to see greater than 50,000 trucks daily. Formulators report 8% lower rut depth after five years in desert climates when ferric chloride is used versus traditional catalysts. Although this niche consumes less tonnage than water treatment, average realized prices are three times higher, contributing disproportionately to aggregate revenue growth and raising the ferric chloride market’s value density.
Adoption in E-Scrap Hydrometallurgy and Copper Recovery
Asia-Pacific recyclers processing 13 million tons of electronic waste yearly increasingly favor ferric chloride leaching because the reagent selectively dissolves copper while preserving precious metals for secondary recovery. Pilot plants in Malaysia recorded copper extraction yields above 95% and 20% lower greenhouse-gas intensity than pyrometallurgical routes. North American operators are adapting the flowsheets to handle complex multilayer PCBs, which augments reagent demand and creates an outlet for by-product hydrochloric acid captured from integrated chlor-alkali units. Over the long term, e-waste growth of 3–5% annually sustains this driver.
Restraints Impact Analysis*
| Restraint | (~) % Impact on CAGR Forecast | Geographic Relevance | Impact Timeline |
|---|---|---|---|
| Availability of substitute coagulants (poly-aluminium chloride, alum) | -0.80% | Price-sensitive markets worldwide | Medium term (2-4 years) |
| Corrosive handling and storage requirements | -0.50% | Regions lacking advanced infrastructure | Short term (≤ 2 years) |
| Volatility in iron-scrap supply chain | -0.60% | Global, with concentration in regions dependent on scrap imports | Short term (≤ 2 years) |
| Source: Mordor Intelligence | |||
Availability of Substitute Coagulants
Poly-aluminium chloride (PAC) achieves equal turbidity removal at 10–15% lower dose rates and generates less sludge, giving utilities a clear operating-cost advantage in cold-climate regions. Alum remains attractive where sludge disposal fees are minimal and pH control is straightforward. Competitive pressure therefore compresses margins in commodity segments, especially for utilities tendering strictly on delivered cost. However, ferric chloride retains technical leadership in simultaneous phosphorus and arsenic removal, which balances the restraint in markets governed by tighter effluent standards.
Corrosive Handling and Storage Requirements
Ferric chloride’s aggressive acidity mandates fiberglass-reinforced tanks, corrosion-resistant pumps, and full-face personal protective equipment, inflating capital outlays for small utilities. Operators report maintenance costs two to three times higher than neutral pH coagulants, and accidental releases can rapidly degrade concrete containment. Innovations such as peristaltic metering pumps reduce leakage risk, yet the base chemistry remains inherently corrosive, deterring adoption in plants with limited maintenance budgets.
*Our forecasts treat driver/restraint impacts as directional, not additive. The impact forecasts reflect baseline growth, mix effects, and variable interactions.
Segment Analysis
By Grade: Industrial Dominance Amid Electronic Specialization
Industrial/Technical products accounted for 73.10% ferric chloride market share in 2025, supplying utilities and general industry where cost efficiency is paramount. Electronic Grade is expanding at 5.72% CAGR through 2031, reinforcing the ferric chloride market size in high-value niches. Rigorous impurity thresholds below 10 ppm metals prevent PCB under-etching and ensure circuit fidelity, justifying three-to-four-fold premiums over commodity grades. Food and Pharma material remains a small but stable contributor, anchored by feed premix use for iron supplementation in poultry and swine operations.
Manufacturing complexity is rising. Electronic Grade producers integrate crystallization, micro-filtration, and nitrogen-blanketed storage to maintain batch consistency. These barriers restrict new entrants, helping incumbents protect margins even as raw-material costs fluctuate. Meanwhile, Industrial Grade suppliers invest in energy-efficient chlorination reactors and closed-loop hydrochloric acid recovery to stay competitive on delivered cost.


By Application: Water Treatment Leadership Challenged by Electronics Growth
Water and Wastewater Treatment represented 62.85% of the ferric chloride market size in 2025, benefiting from mandatory municipal procurement schedules and multi-year infrastructure commitments. PCB production posts the fastest CAGR at 5.61%, reflecting surging server, smartphone, and electric-vehicle electronics output. In this segment, chemical cost is dwarfed by the end-product’s value; therefore, buyers prioritize purity and process support. Asphalt blowing uptake is accelerating in equatorial climates where high pavement temperatures shorten service life. Pigment manufacturing and animal nutrient supplementation supply steady baseline demand, smoothing revenue against cyclical downturns in single sectors.
Process expertise is now a selling point. Suppliers offering digital feed-and-bleed control algorithms for ferric regenerators in PCB shops report 12-month paybacks for customers, fostering stickier contracts. In water utilities, bundled services such as jar-test optimization continue to shift procurement decisions from lowest price to total cost of compliance.

Geography Analysis
Asia-Pacific commanded 45.05% of global revenue in 2025 on the back of vertically integrated electronics and strong municipal infrastructure spending. China’s PCB capacity additions, India’s AMRUT-2 water reforms, and Southeast Asia’s battery supply-chain investments sustain top-line growth. Governments subsidize local chlor-alkali capacity, reducing import dependence and supporting favorable delivered pricing. The ferric chloride market share in the region is therefore unlikely to erode over the forecast horizon.
South America is the fastest mover with a 5.38% CAGR, catalyzed by Brazil’s USD 145 billion wastewater and sanitation program through 2033. Projects mandate advanced coagulation solutions to meet impending discharge norms, pivoting utilities toward iron chemistry. Argentina’s chemical sector expansion, including GR Química’s USD 24 million water-treatment build-out, further energizes regional offtake.
North America and Europe form mature arenas yet still log incremental volume gains as utilities retrofit plants to meet new phosphorus caps. Local supply resilience is strengthening; Chlorum Solutions’ USD 70 million Arizona chlor-alkali plant will cut freight distances by 500 miles for Southwest buyers, reducing carbon footprints and delivery risks. The Middle East and Africa remain nascent but promising: desalination reliance and megacity construction demand robust coagulant solutions, though budget and technical capacity constraints temper immediate scale.


Competitive Landscape
The ferric chloride market exhibits consolidated concentration. Global leadership rests with BASF, Kemira, among others, whose integrated chlor-alkali and downstream assets yield cost and logistics advantages. Collectively, the top five vendors hold roughly 58% of 2024 sales, indicating moderate concentration. Regional specialists such as Gujarat Alkalies, DCW Ltd., and Chlorum Solutions leverage proximity to end-users and lower freight to defend share. Technology partnerships are reshaping the field: Kemira’s 2024 decision to expand Tarragona output specifically for biogas digestion aid aligns product customization with growth verticals. Equipment innovators also influence purchase decisions; Saur’s deployment of Qdos pumps for corrosive chemical dosing improved uptime by 30%, favoring suppliers that certify compatibility.
Consolidation momentum is likely to continue as smaller producers grapple with the capital intensity of brine purification, neutral brine towers, and waste-acid recovery upgrades required under tightening emission rules. Strategic acquisitions that secure geographic gaps or add Electronic Grade capacity appear probable through 2030.
Ferric Chloride Industry Leaders
BASF
BCI
Kemira
PVS Chemicals, Inc.
Tessenderlo Group
- *Disclaimer: Major Players sorted in no particular order

Recent Industry Developments
- January 2025: Fluid Handling Pro has announced the successful implementation of Qdos peristaltic pumps at Saur's water treatment plant. These pumps, engineered for dosing corrosive ferric chloride, have effectively reduced maintenance downtime and improved operational reliability due to their advanced chemical compatibility.
- July 2024: Kemira has announced plans to expand its ferric chloride capacity in Tarragona, Spain, to support the production of specialized biogas products, referred to as BDP (Biogas Digestion Product). The total investment is estimated in the mid-single digit millions, with the expanded capacity expected to become operational by 2026.


Global Ferric Chloride Market Report Scope
Ferric Chloride is an inorganic salt with an orange-to-brown-black appearance in the solid form and colourless to light brown in the solution form. The salt is highly corrosive to most metals and probably to human tissue. The Ferric Chloride market is segmented by application and geography. By application, the market is segmented into Water and Wastewater Treatment, Printed Circuit Board(PCB), Pigment Manufacturing, Animal Nutrient Supplements, Asphalt Blowing, and Other Applications. The report also covers the market size and forecasts for the ferric chloride market in 18 countries across major regions. For each segment, the market sizing and forecasts have been done on the basis of volume (metric tons).
| Industrial/Technical Grade |
| Electronic Grade |
| Food and Pharma Grade |
| Water and Wastewater Treatment |
| Printed Circuit Board (PCB) |
| Pigment Manufacturing |
| Animal Nutrient Supplements |
| Asphalt Blowing |
| Other Applications |
| Asia-Pacific | China |
| Japan | |
| India | |
| South Korea | |
| Rest of Asia-Pacific | |
| North America | United States |
| Canada | |
| Mexico | |
| Europe | Germany |
| United Kingdom | |
| France | |
| Italy | |
| Rest of Europe | |
| South America | Brazil |
| Argentina | |
| Rest of South America | |
| Middle East and Africa | Saudi Arabia |
| South Africa | |
| Rest of Middle East and Africa |
| By Grade | Industrial/Technical Grade | |
| Electronic Grade | ||
| Food and Pharma Grade | ||
| By Application | Water and Wastewater Treatment | |
| Printed Circuit Board (PCB) | ||
| Pigment Manufacturing | ||
| Animal Nutrient Supplements | ||
| Asphalt Blowing | ||
| Other Applications | ||
| By Geography | Asia-Pacific | China |
| Japan | ||
| India | ||
| South Korea | ||
| Rest of Asia-Pacific | ||
| North America | United States | |
| Canada | ||
| Mexico | ||
| Europe | Germany | |
| United Kingdom | ||
| France | ||
| Italy | ||
| Rest of Europe | ||
| South America | Brazil | |
| Argentina | ||
| Rest of South America | ||
| Middle East and Africa | Saudi Arabia | |
| South Africa | ||
| Rest of Middle East and Africa | ||


Key Questions Answered in the Report
How large is the ferric chloride market in 2026?
The ferric chloride market size stands at USD 8.05 billion in 2026.
What is the forecast CAGR for ferric chloride from 2026 to 2031?
The market is projected to grow at a 5.18% CAGR through 2031.
Which grade shows the fastest growth through 2031?
Electronic Grade is expanding at a 5.72% CAGR due to rising PCB demand.
Why is South America the fastest-growing region?
Brazil’s USD 145 billion wastewater outlay and Argentina’s chemical expansion push regional CAGR to 5.38%.
What drives substitution risk in water treatment?
Poly-aluminium chloride offers lower dosing and sludge volumes, pressuring ferric chloride adoption in cost-sensitive utilities.
Page last updated on:


