
Pollution Liability Insurance Market Size and Share
Market Overview
| Study Period | 2020 - 2031 |
|---|---|
| Market Size (2026) | USD 4.80 Billion |
| Market Size (2031) | USD 6.27 Billion |
| Growth Rate (2026 - 2031) | 5.50 % |
| Fastest Growing Market | Asia-Pacific |
| Largest Market | North America |
| Market Concentration | High |
Major Players *Disclaimer: Major Players sorted in no particular order Image © Mordor Intelligence. Reuse requires attribution under CC BY 4.0. | |
Pollution Liability Insurance Market Analysis by Mordor Intelligence
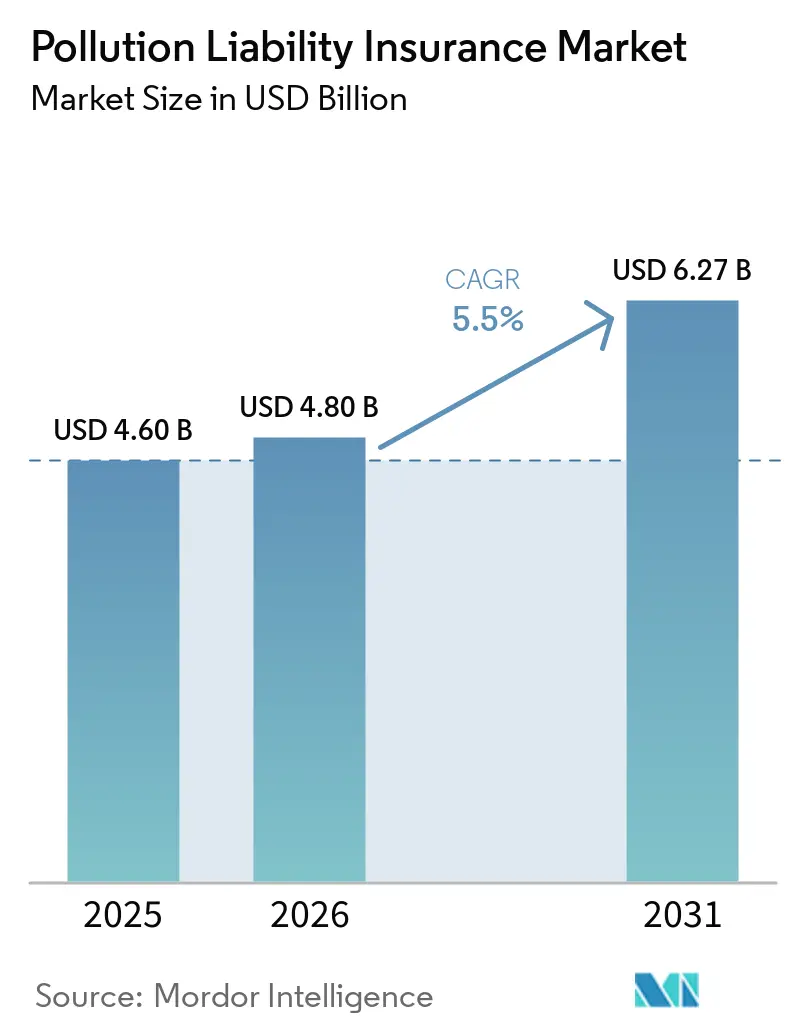
The pollution liability insurance market size is projected to expand from USD 4.60 billion in 2025 to USD 4.80 billion in 2026, and reach USD 6.27 billion by 2031, registering a CAGR of 5.5% between 2026 and 2031. The pollution liability insurance market is expanding as environmental enforcement becomes more systematic across North America, Europe, and the Asia-Pacific. Financial responsibility requirements are encouraging operators that handle hazardous materials to demonstrate that they can meet cleanup and liability obligations. Large settlements related to Superfund sites and PFAS have also made uninsured environmental exposure more visible to corporate buyers. New facilities for battery storage, solar power, and green hydrogen bring environmental risks that conventional general liability policies often exclude. These conditions broaden demand across industrial operations, real estate transactions, construction projects, and mid-market manufacturing.
Key Report Takeaways
- By coverage type, site and premises pollution liability captured 51.9% of the pollution liability insurance market share in 2025, while contractors' pollution liability is projected to register a 6.8% CAGR through 2031.
- By end-user industry, manufacturing and industrial processing accounted for 31.3% of the pollution liability insurance market share in 2025, while construction, real estate, and infrastructure are projected to register a 7.2% CAGR through 2031.
- By customer type, large enterprises held 63.8% of the pollution liability insurance market share in 2025, while small and medium enterprises are projected to register a 6.9% CAGR through 2031.
- By distribution channel, brokers and intermediaries held 71.7% of the pollution liability insurance market share in 2025, while MGAs, program administrators, and digital channels are projected to register a 7.5% CAGR through 2031.
- By geography, North America accounted for 55.7% of the pollution liability insurance market share in 2025, while the Asia-Pacific is forecast to register a 7.8% CAGR through 2031.
Note: Market size and forecast figures in this report are generated using Mordor Intelligence’s proprietary estimation framework, updated with the latest available data and insights as of January 2026.
Global Pollution Liability Insurance Market Trends and Insights
Drivers Impact Analysis*
| Driver | (~) % Impact on CAGR Forecast | Geographic Relevance | Impact Timeline |
|---|---|---|---|
| Strengthening Environmental Liability, Remediation, and Financial Responsibility Regulations | +1.5% | Global, with highest intensity in North America and EU | Medium term (2–4 years) |
| Growing Industrial and Legacy Contamination Risks Increasing Demand for Specialized Coverage | +0.9% | North America, Europe, and industrialising Asia-Pacific markets | Long term (≥ 4 years) |
| Expansion of Hazardous Materials Handling, Storage, Transportation, and Waste Management Activities | +0.8% | Global, concentrated in North America, China, and India | Medium term (2–4 years) |
| Increasing Environmental Due Diligence Requirements in Brownfield Redevelopment, M&A, and Lending Transactions | +0.7% | North America and Western Europe | Short term (≤ 2 years) |
| Rising Emerging Contaminant Risks, Including PFAS, Expanding Demand for Environmental Risk Transfer | +0.8% | Global, with regulatory intensity concentrated in North America and EU | Long term (≥ 4 years) |
| Growing Environmental Liability Exposures from Energy Transition and New Industrial Infrastructure | +0.6% | Global, with growth concentrated in Asia-Pacific, North America, and Europe | Long term (≥ 4 years) |
| Source: Mordor Intelligence | |||
Strengthening Environmental Liability Regulations Are Raising the Cost of Non-Insurance
Environmental financial responsibility rules are shifting pollution coverage from a discretionary purchase toward a compliance requirement for more industrial activities. The United States Environmental Protection Agency secured USD 714.3 million in responsible-party commitments through its Fiscal Year 2025 Superfund cleanup enforcement program. The agency has secured USD 52.5 billion in commitments since the program began, showing the continuing scale of liability attached to contaminated properties[1]U.S. Environmental Protection Agency, “Enforcement and Compliance Assurance Annual Results for FY 2025 Superfund Cleanup,” U.S. Environmental Protection Agency, epa.gov.. India’s 2024 amendments to the Public Liability Insurance Act raised aggregate policy limits to INR 250 crore (USD 30 million) per incident and strengthened compliance monitoring requirements. India also notified its first dedicated contaminated-site remediation framework in July 2025, applying strict liability and polluter-pays principles to legacy industrial zones. The pollution liability insurance market benefits when enforcement infrastructure makes the cost of operating without coverage more visible to facility owners and lenders.
PFAS and Emerging Contaminant Risks Are Reshaping Underwriting Appetite and Demand
PFAS contamination is increasing the demand for specialized coverage while making standard policy terms more restrictive. In May 2026, the United States EPA delayed PFOA and PFOS drinking water compliance deadlines to 2031 and signaled the rescission of standards for 4 additional PFAS compounds[2]https://www.mcguirewoods.com/client-resources/alerts/2026/3/contaminants-compass-march-2026-edition/. State-level action continues to develop despite this federal change, including Minnesota’s phased PFAS product restrictions through 2032. The United States Department of Defense issued revised PFAS incineration interim guidance in February 2026, reinforcing concern about liability across the full waste chain. Ethylene oxide, microplastics, and 6PPD-quinone are also receiving regulatory and litigation attention. The pollution liability insurance market, therefore, has an important role where general liability policies exclude contaminants or provide insufficient protection.
Legacy and Industrial Contamination Risks Are Sustaining Demand for Specialized Site Coverage
Legacy contamination remains an active exposure because new industrial activity creates risks while remediation costs at older sites continue to rise. At the end of Fiscal Year 2025, 870 United States Superfund sites were under active cleanup through 1,467 enforcement agreements and orders. These sites carried USD 25 billion in estimated outstanding cleanup costs, maintaining the need for careful site underwriting. Two major insurers exited the site environmental liability segment in 2025, tightening capacity as PFAS monitoring identified new claims at sites that had appeared closed[3]https://www.insurancebusinessmag.com/us/news/environmental/novacore-launches-environmental-segment-as-pfas-claims-reshape-the-market-584603.aspx. Manufacturing, chemical processing, energy extraction, recycling, and automobile facilities continue to face rising scrutiny because their historical operations can produce long-tail claims. The pollution liability insurance market is supported by this persistent need for site-specific coverage and claims management expertise.
Brownfield Redevelopment, M&A, and Lending Requirements Are Creating Transactional Demand
Environmental liability coverage is increasingly used to support property transactions and acquisitions rather than only to meet operational risk requirements. Lenders and acquirers often require Pollution Legal Liability coverage at closing to manage contamination discovered after a deal is completed[4]nfp.com/insights/minimizing-environmental-liabilities-post-mergers-and-acquisitions. Pollution Legal Liability is also used with representations and warranties insurance in asset-heavy transactions. Brownfield redevelopment for data centers can require tailored coverage because of CERCLA successor liability and legacy contamination at former industrial sites. Siltation, stormwater, and voluntary site investigation claims can arise during construction even when the contamination predated current ownership. The pollution liability insurance market gains more resilient demand when procurement, legal, and finance teams treat coverage as a transaction requirement.
Restraints Impact Analysis*
| Restraint | (~) % Impact on CAGR Forecast | Geographic Relevance | Impact Timeline |
|---|---|---|---|
| High Coverage Costs and Limited Risk Awareness Constraining SME Adoption | -0.5% | Global, most acute in emerging markets and non-regulated SME segments | Medium term (2–4 years) |
| Fragmented Environmental Liability Regulations Limiting Product Standardization Across Markets | -0.3% | Global, with highest complexity in Asia-Pacific and emerging markets | Long term (≥ 4 years) |
| Limited Historical Loss Data and Coverage Uncertainty for Emerging Contaminants | -0.4% | Global, most acute for PFAS and novel industrial chemicals | Long term (≥ 4 years) |
| Long-Tail Claims, Social Inflation, and Complex Coverage Allocation Increasing Underwriting Uncertainty | -0.3% | North America and Western Europe | Medium term (2–4 years) |
| Source: Mordor Intelligence | |||
High Coverage Costs and Limited Risk Awareness Are Suppressing SME Participation
Small and medium enterprises create a meaningful share of industrial pollution exposure through auto dealerships, light manufacturing, dry cleaning, and agricultural chemical storage. Many of these businesses remain underinsured because environmental coverage can be costly and is often discretionary. Rising operating costs have led some smaller operators to reduce deductibles, remain uninsured, or allow policies to lapse. Underwriting also requires site records, past-use information, and Phase I or Phase II environmental assessments that can burden organizations without dedicated risk teams. MGA and digital channels are developing modular products, but awareness, price discovery, and regulation remain insufficient to materially increase SME participation in the near term. The pollution liability insurance market will remain weighted toward larger buyers until these barriers are reduced.
Limited Loss Data for Emerging Contaminants Is Constraining Pricing Accuracy and Coverage Breadth
PFAS creates an unusually difficult reserving challenge because the United States does not have a federal soil-cleanup standard that bounds remediation liability. Insurers must price coverage against a changing mix of state rules and evolving EPA requirements. The NAIC continues to monitor emerging-contaminant exclusion language, which indicates that standard policy wording will take time to develop. Formaldehyde, microplastics, and 1,4-dioxane also have early litigation histories that do not provide enough claims data for precise severity estimates. Insurers respond with lower limits, narrow terms, and cautious pricing, which can deter cost-sensitive buyers. German insurer association guidance on PFAS exclusions shows that coverage uncertainty is a global limitation rather than only a United States issue.
*Our forecasts treat driver/restraint impacts as directional, not additive. The impact forecasts reflect baseline growth, mix effects, and variable interactions.
Segment Analysis
By Coverage Type: Specialist Forms Hold Core Demand as Contractor Policies Scale
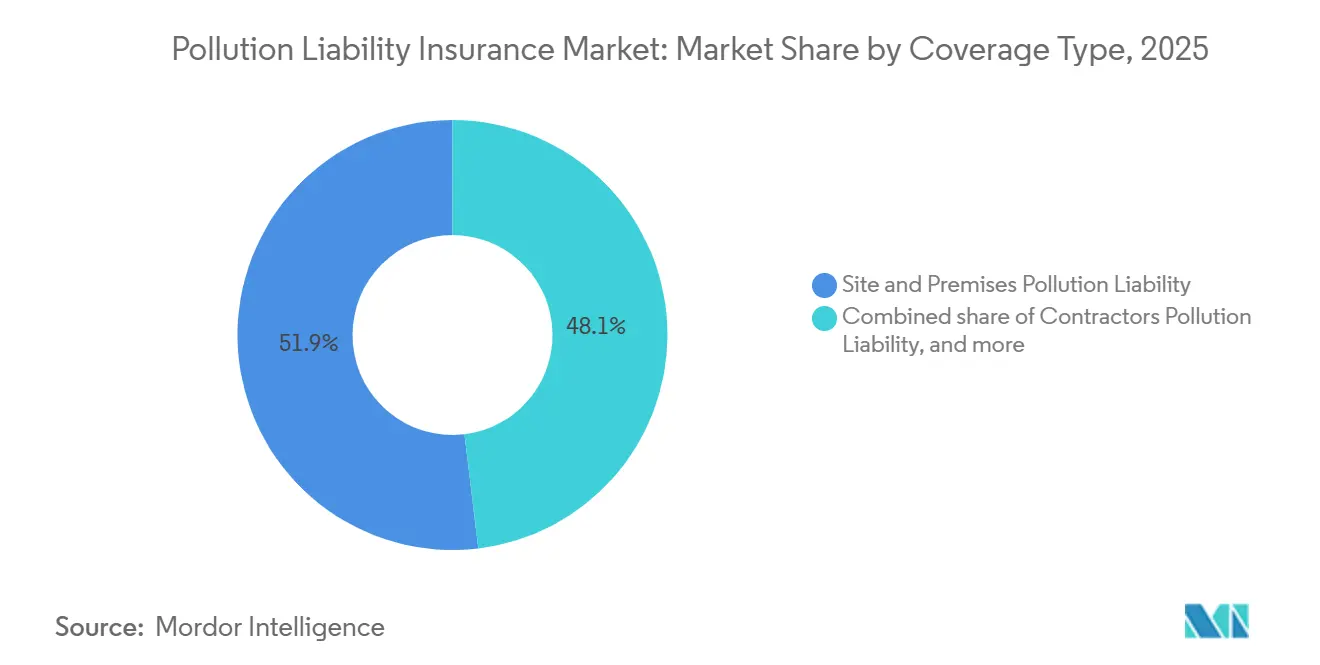
Site and premises pollution liability held 51.9% of the pollution liability insurance market share in 2025, making it the leading coverage type. Its position reflects lender requirements for property transactions, financial assurance rules for underground storage tanks, and the use of pollution legal liability in M&A transactions. Two major insurers exited site environmental liability in 2025, reducing available capacity as PFAS monitoring created new claims at previously remediated sites. New capacity softened pollution legal liability conditions during 2025, although underwriters remained selective on PFAS, recycling, and former industrial property risks. Storage tank, transportation, and other specialty products serve narrower exposures as battery supply chains, chemical distribution networks, RCRA rules, and Department of Transportation requirements sustain baseline demand.
Contractors' pollution liability is the fastest-growing coverage type, with a projected 6.8% CAGR through 2031 in the pollution liability insurance market. Infrastructure, data center, energy transition, and health care projects are creating construction activity with complex pollution exposure. At the same time, owners increasingly require contractors and subcontractors to carry both pollution and professional liability coverage. Construction starts in infrastructure, energy, artificial intelligence, data centers, and institutional projects are expanding in 2026, while residential and commercial activity remains broadly flat compared with 2025. Carrier competition and low loss frequency have kept CPL pricing soft to stable, and combined CPL and professional liability forms simplify placement. The pollution liability insurance industry is adapting its forms to match the way contractors structure project risk.


By End-User Industry: Construction Accelerates as Manufacturing Anchors Volume
Manufacturing and industrial processing accounted for 31.3% of the pollution liability insurance market share in 2025. The segment has a substantial legacy contamination burden, ongoing hazardous-materials use, and direct exposure to enforcement. Heavy manufacturing, recycling, chemical processing, and energy extraction face greater rate pressure where loss histories weaken, or PFAS-related exposure affects capacity. The pollution liability insurance market continues to rely on these established buyers for core volume. Their risk teams often require bespoke program structures, detailed coverage triggers, and layered limits.
Construction, real estate, and infrastructure are projected to grow at 7.2% CAGR through 2031 in the pollution liability insurance market. Contractual insurance requirements move through project supply chains as developers and general contractors seek protection against construction-related contamination. Brownfield redevelopment, siltation, and stormwater losses on renewable energy projects add to this demand. Sustained investment in infrastructure and data infrastructure supports pollution coverage needs in commercial construction and engineering. Energy, natural resources, and utilities also face risks from legacy fossil-fuel assets, battery storage, solar projects, and wind facilities, as annual renewable energy investment exceeded USD 1 trillion in 2024 and must triple to meet Paris Agreement targets.
By Customer Type: Enterprise Buyers Dominate While SMEs Offer the Growth Case
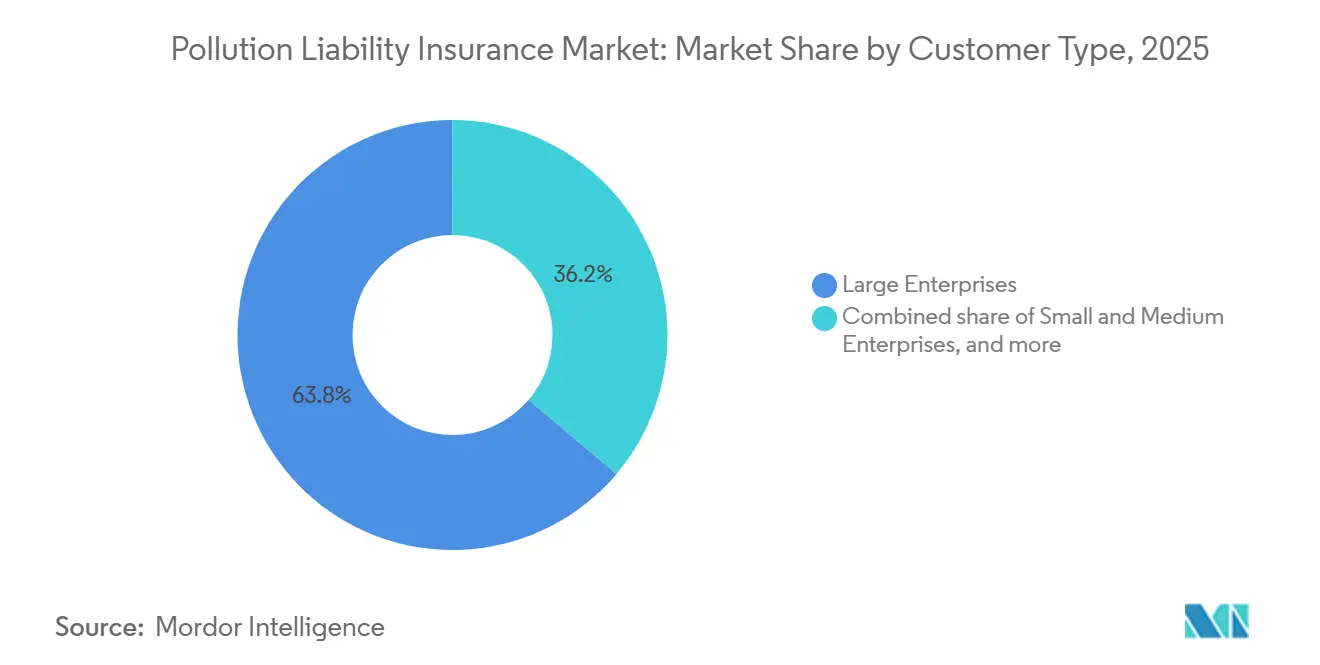
Large enterprises held 63.8% of the pollution liability insurance market share in 2025. Large industrial, real estate, and energy companies have long integrated environmental protection into broader risk management programs and commonly obtain layered placements through specialist brokers. Limits range from USD 25 million to USD 100 million or more for complex sites. Policy terms, PFAS exclusions, sublimits, and discovered-condition triggers have become as important as premiums during negotiations. Specialist brokers differentiate themselves by structuring coverage around these technical issues.
Small and medium enterprises are projected to grow at 6.9% CAGR through 2031 in the pollution liability insurance market, although from a smaller base. Construction supply-chain obligations, modular policies, higher financial responsibility requirements, and PFAS exclusions in standard liability policies can increase demand among smaller hazardous-materials handlers. MGA and digital platforms are designing more practical policies for light-industrial and mid-market businesses. Public-sector and institutional entities provide steadier demand because municipalities, ports, and public utilities can inherit contamination from historic land use. The pollution liability insurance industry has room to grow if affordability and risk awareness improve for smaller buyers.
By Distribution Channel: Brokers Lead While MGA Platforms Expand
Brokers and intermediaries held 71.7% of the pollution liability insurance market share in 2025, the largest share among distribution channels. Environmental underwriting requires interpretation of policy language, coverage triggers, PFAS sublimits, and site-specific endorsements. Specialist brokers help buyers assess historic operations against current environmental requirements and structure programs for possible future contamination claims. Their role remains central as carriers bundle contractors' pollution, professional liability, and general liability coverage in combined forms. Direct insurer distribution remains limited because this product generally needs tailored underwriting.
MGAs, program administrators, and digital channels are projected to grow at 7.5% CAGR through 2031 in the pollution liability insurance market. The United States MGA sector reached USD 128 billion in gross written premiums during 2025, and environmental lines were identified as a high-growth specialty category. Delegated authority, technology-based triage, and proprietary pricing tools support risk selection for smaller pollution accounts. Sands Point Risk acquired Launch Environmental Underwriters in January 2026, taking the combined gross written premium above USD 250 million. The pollution liability insurance market is seeing MGA scale become more important for technology investment, underwriting talent, and reinsurance access.
Geography Analysis
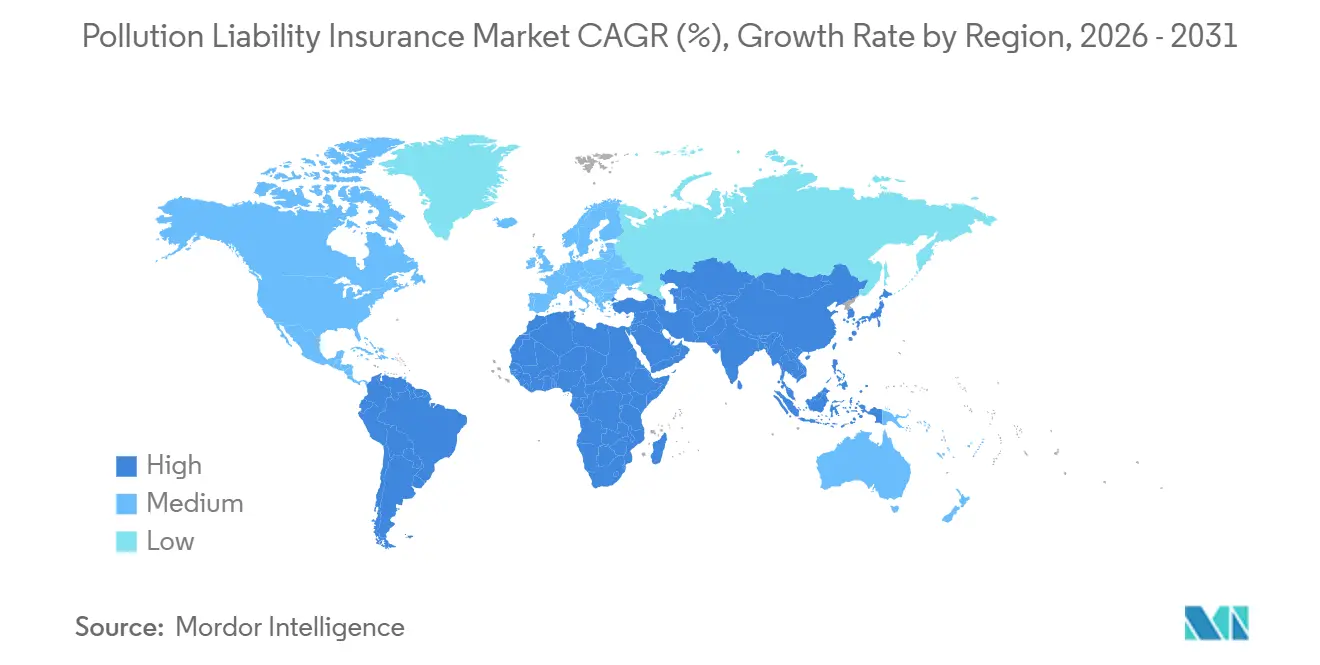
North America held 55.7% of the pollution liability insurance market share in 2025 and remained the leading regional part of the pollution liability insurance market. CERCLA, RCRA underground storage tank rules, and state cleanup programs create layered financial responsibility requirements for industrial operators and property owners. New capacity from at least 6 carriers softened pollution legal liability conditions in 2025. PFAS claims are still widening the number of active remediation sites, including facilities that had previously been considered closed. Canada’s revised CCDC 41 construction contract framework made CPL mandatory on many projects and brought more contractors and brokers into the sector. Mexico’s growing manufacturing base is also increasing demand for site and contractor coverage as nearshoring investment raises environmental management expectations.
Europe is a distinct part of the pollution liability insurance market, with an environmental liability framework shaped by the EU Environmental Liability Directive and Germany’s Environmental Damage Act. German liability lines reported EUR 8.7 billion (USD 9.5 billion) in total premium in 2024 and a combined ratio of 86%. The EU Product Liability Directive entered into force in December 2024 and widened potential personal environmental liability for directors and officers after material pollution incidents. Germany’s GDV issued PFAS exclusion guidance in 2025, indicating that European insurers are responding to United States tort developments before domestic claims become more pronounced. South America, especially Brazil and Argentina, has growing petrochemical, mining, and agribusiness exposures, although insurance penetration remains early compared with regulatory maturity.
Asia-Pacific is projected to grow at 7.8% CAGR through 2031, the fastest rate among regions. The pollution liability insurance market in the region is supported by industrial expansion, contaminated-site rules, and ESG disclosure requirements that convert awareness into insurance purchasing. India’s 2024 Public Liability Insurance Act amendments raised mandatory limits for hazardous substance handlers, while its July 2025 contaminated-sites rules established a structured process for identification, assessment, remediation, and monitoring. China’s environmental damage compensation regime, China’s Environmental Protection Law, and Indonesia’s Environmental Protection and Management Law are key regional demand drivers. HDI Global expanded its Asia-Pacific environmental liability offering in 2024, initially focusing on Australia and planning growth in Singapore, Hong Kong, and Japan. The Middle East and Africa demand remains at an early stage and is mainly linked to lender requirements for oil, gas, mining, and major infrastructure projects.

Competitive Landscape
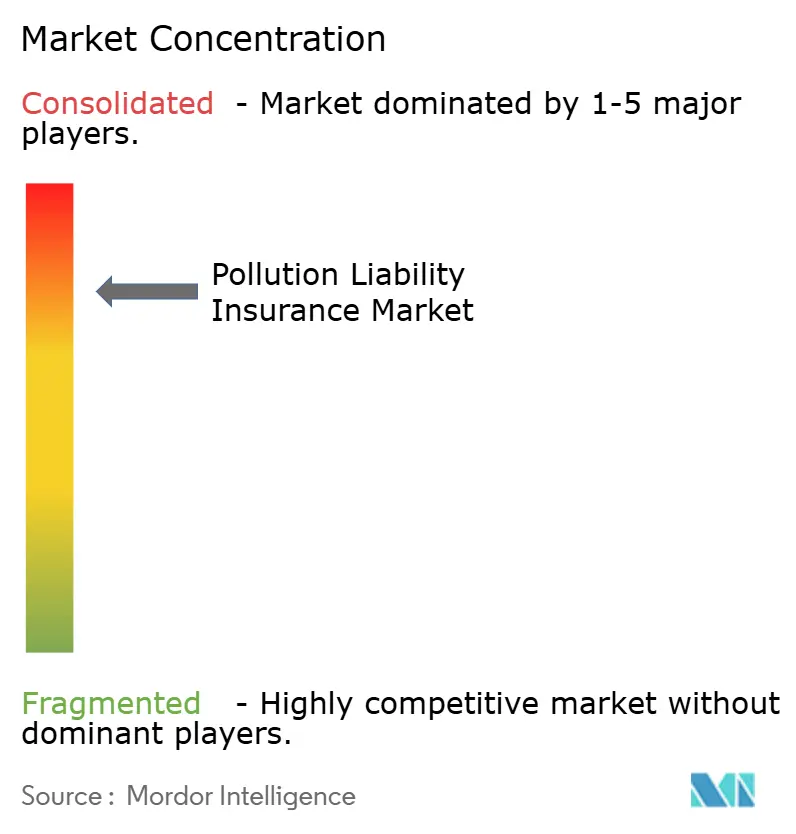
The Pollution liability insurance market is concentrated among global specialty carriers, while regional insurers, Lloyd’s syndicates, and MGA platforms serve narrower sectors and geographies. AIG, Chubb, AXA XL, Zurich Insurance Group, and Allianz Commercial compete through underwriting expertise, international reach, and combined products that connect pollution coverage with professional or general liability. AXA XL launched an environmental combined form in March 2026 for the Americas. The form brings primary commercial general liability together with contractors, products, site, transportation, and professional pollution coverage. Markel Canada introduced 2 integrated environmental solutions in April 2026 for manufacturers and environmental service firms. The Pollution liability insurance market is moving toward combined forms that reduce coverage gaps and make broker placement easier. This approach can also simplify coverage discussions for clients with several related environmental exposures.
Mosaic Insurance launched a combined site pollution and general liability form with USD 25 million in excess capacity for manufacturing, processing, and environmental consulting buyers. These products allow the Pollution liability insurance market to place a larger share of environmental risk for existing clients. ISO environmental forms and Lloyd’s market standards support some consistency, but PFAS exclusion wording is not uniform. This variation can create disputes even for buyers with sophisticated insurance programs.
The key opportunity areas are modular products for small and mid-market buyers, energy-transition coverage for battery storage and carbon capture, and PFAS-affirmative structures for controlled exposures. Traditional construction all-risks and casualty policies can leave gaps for renewable energy environmental exposures. Beazley, Markel, Arch Insurance Group, AXIS Capital, and QBE have expanded their environmental underwriting appetites. AXIS Capital launched a dedicated Canadian environmental impairment liability unit in 2024 to write CPL, pollution legal liability, and follow-form business. Sompo International, Tokio Marine HCC, Great American Insurance Group, The Hartford, and CNA Financial add depth in mid-market and specialty lines. Multiple regional carriers, syndicates, and MGAs compete actively alongside the largest global specialty carriers.
Pollution Liability Insurance Industry Leaders
AIG
Chubb Limited
AXA XL
Zurich Insurance Group
Allianz Commercial
- *Disclaimer: Major Players sorted in no particular order

Recent Industry Developments
- April 2026: Markel Canada launched two new combined environmental insurance solutions, integrating general liability, pollution, and professional coverages under single policy forms, targeting manufacturers and environmental service firms across Canada, reflecting a strategic focus on reducing coverage gaps and simplifying broker placement in the mid-market.
- April 2026: The EPA finalized an extension of the TSCA Section 8(a)(7) PFAS reporting period by 60 additional days following finalization of rule revisions, giving manufacturers added compliance runway while EPA refined the regulatory framework.
- March 2026: AXA XL introduced its environmental combined form in the Americas, bundling primary commercial general liability with contractors' pollution, products pollution, site pollution, transportation pollution, and professional liability on a single coverage form. Limits reach up to USD 25 million for select business classes, targeting manufacturers, distributors, and contractors with pollution exposures.
- January 2026: Sands Point Risk, a PE-backed specialty MGA platform, completed the acquisition of Launch Environmental Underwriters, its largest transaction, pushing the platform’s combined gross written premium above USD 250 million. Launch Environmental focuses on complex environmental liability risks in energy, infrastructure, construction, chemical, M&A, and industrial sectors.


Global Pollution Liability Insurance Market Report Scope
| Site and Premises Pollution Liability |
| Contractors' Pollution Liability |
| Storage Tank, Transportation, and Other Specialty Pollution Liability |
| Manufacturing and Industrial Processing |
| Energy, Natural Resources, and Utilities |
| Construction, Real Estate, and Infrastructure |
| Transportation, Waste Management, and Environmental Services |
| Agriculture, Public Sector, and Other End Users |
| Small and Medium Enterprises |
| Large Enterprises |
| Public-Sector and Institutional Entities |
| Brokers and Intermediaries |
| Direct Insurer Distribution |
| MGAs, Program Administrators, and Digital Channels |
| North America | United States |
| Canada | |
| Mexico | |
| South America | Brazil |
| Argentina | |
| Rest of South America | |
| Europe | United Kingdom |
| Germany | |
| France | |
| Italy | |
| Spain | |
| Rest of Europe | |
| Asia-Pacific | China |
| Japan | |
| India | |
| South Korea | |
| Australia | |
| Indonesia | |
| Thailand | |
| Malaysia | |
| Singapore | |
| Vietnam | |
| Rest of Asia-Pacific | |
| Middle East and Africa | Saudi Arabia |
| United Arab Emirates | |
| Turkey | |
| South Africa | |
| Egypt | |
| Rest of Middle East and Africa |
| By Coverage Type | Site and Premises Pollution Liability | |
| Contractors' Pollution Liability | ||
| Storage Tank, Transportation, and Other Specialty Pollution Liability | ||
| By End-User Industry | Manufacturing and Industrial Processing | |
| Energy, Natural Resources, and Utilities | ||
| Construction, Real Estate, and Infrastructure | ||
| Transportation, Waste Management, and Environmental Services | ||
| Agriculture, Public Sector, and Other End Users | ||
| By Customer Type | Small and Medium Enterprises | |
| Large Enterprises | ||
| Public-Sector and Institutional Entities | ||
| By Distribution Channel | Brokers and Intermediaries | |
| Direct Insurer Distribution | ||
| MGAs, Program Administrators, and Digital Channels | ||
| By Geography | North America | United States |
| Canada | ||
| Mexico | ||
| South America | Brazil | |
| Argentina | ||
| Rest of South America | ||
| Europe | United Kingdom | |
| Germany | ||
| France | ||
| Italy | ||
| Spain | ||
| Rest of Europe | ||
| Asia-Pacific | China | |
| Japan | ||
| India | ||
| South Korea | ||
| Australia | ||
| Indonesia | ||
| Thailand | ||
| Malaysia | ||
| Singapore | ||
| Vietnam | ||
| Rest of Asia-Pacific | ||
| Middle East and Africa | Saudi Arabia | |
| United Arab Emirates | ||
| Turkey | ||
| South Africa | ||
| Egypt | ||
| Rest of Middle East and Africa | ||


Key Questions Answered in the Report
What is driving demand for pollution liability insurance?
Environmental financial responsibility rules, Superfund enforcement, PFAS exposure, and transaction requirements are increasing demand for specialized coverage.
How large is the pollution liability insurance sector?
It was valued at USD 4.6 billion in 2025 and is estimated at USD 4.8 billion in 2026, with a forecast value of USD 6.3 billion by 2031.
Which coverage type has the largest share?
Site and Premises Pollution Liability led with 51.9% in 2025, supported by property transactions and site financial-assurance requirements.
Which end-user category is growing fastest?
Construction, Real Estate, and Infrastructure is projected to grow at 7.2% CAGR through 2031 as contractual requirements extend across project supply chains.
Which region is growing fastest?
Asia-Pacific is projected to grow at 7.8% CAGR through 2031 as industrial activity and contaminated-site regulation expand.
Why do businesses need specialized environmental liability coverage?
General liability policies may exclude PFAS and other pollution risks, while specialist policies can address site, contractor, transportation, and related exposures.
Page last updated on:





