Photonic Sensors Market Size and Share
Market Overview
| Study Period | 2020 - 2031 |
|---|---|
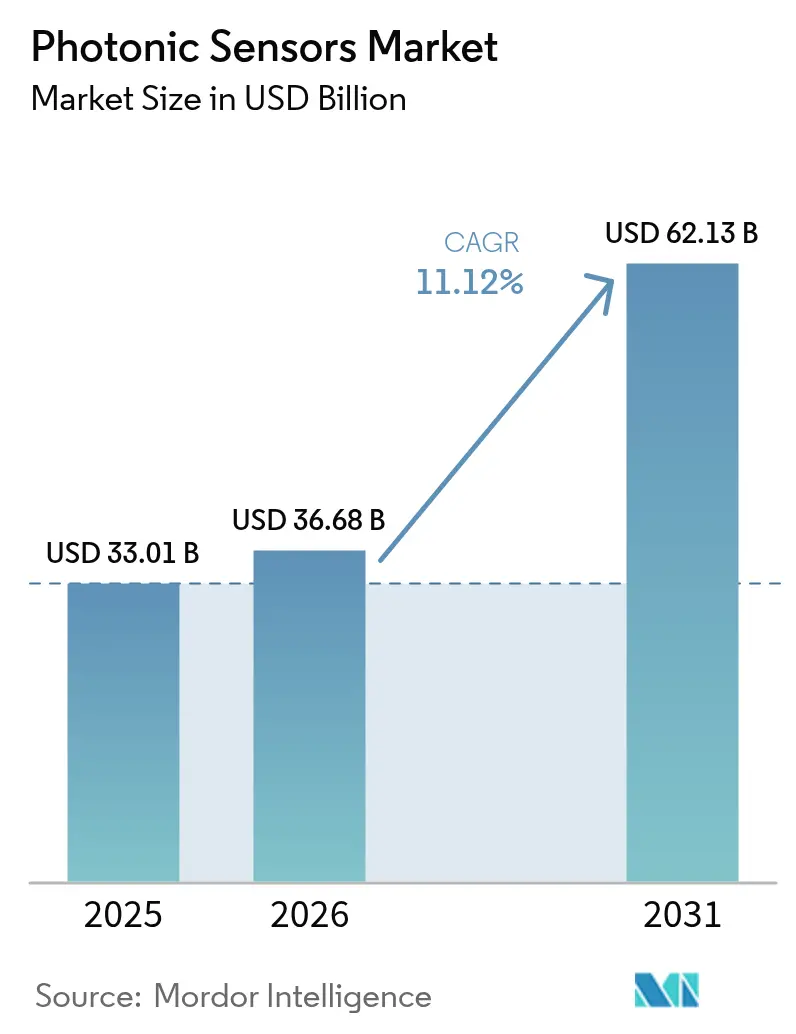
| Market Size (2026) | USD 36.68 Billion |
| Market Size (2031) | USD 62.13 Billion |
| Growth Rate (2026 - 2031) | 11.12% CAGR |
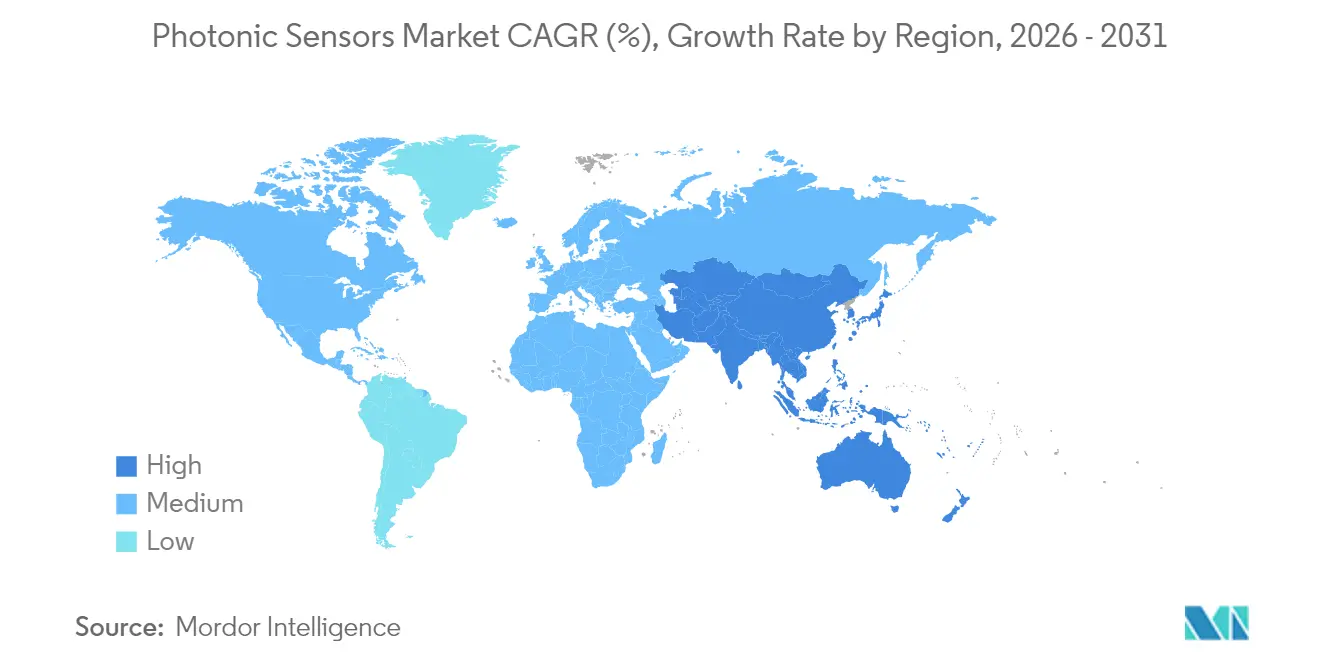
| Fastest Growing Market | Asia Pacific |
| Largest Market | North America |
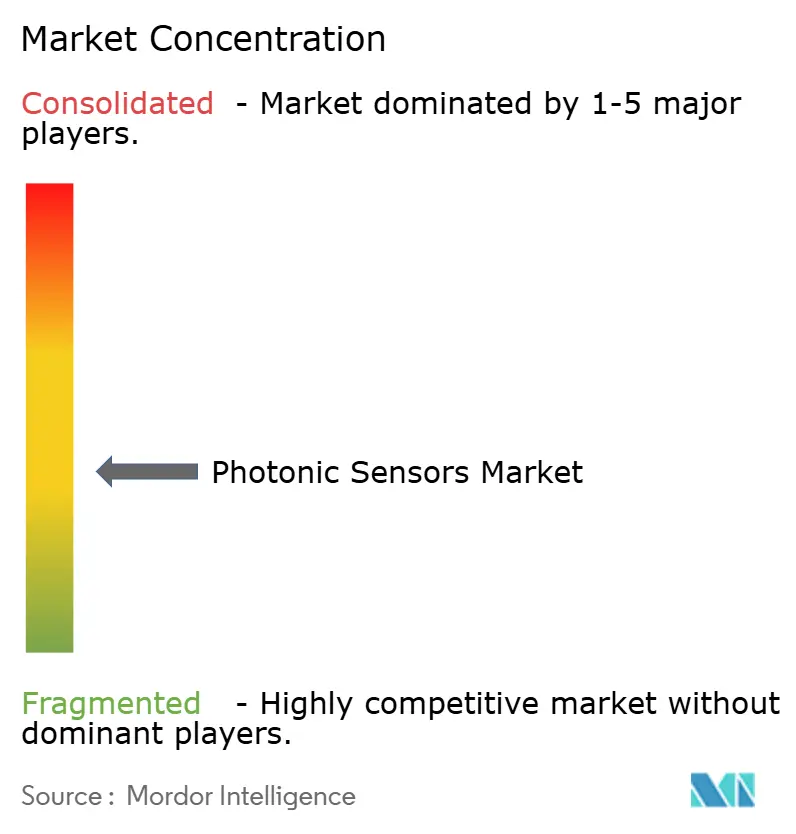
| Market Concentration | Medium |
Major Players *Disclaimer: Major Players sorted in no particular order Image © Mordor Intelligence. Reuse requires attribution under CC BY 4.0. | |
Photonic Sensors Market Analysis by Mordor Intelligence
The photonic sensors market size is expected to grow from USD 33.01 billion in 2025 to USD 36.68 billion in 2026 and is forecast to reach USD 62.13 billion by 2031 at 11.12% CAGR over 2026-2031. Manufacturing automation, fiber-optic infrastructure rollouts, and smart-city initiatives power this expansion, while photonic integrated circuits allow on-chip sensing architectures that outperform electronic sensors. Image sensors remain dominant as automotive safety systems and industrial quality checks require high-resolution data capture. Industrial automation commands nearly one-third of global demand because fiber-optic sensors combine electromagnetic immunity with rugged longevity.[1]STMicroelectronics, “Annual Report 2024,” st.com North America retains the largest regional base thanks to sustained defense spending and semiconductor capacity additions, while Asia-Pacific posts the fastest growth as factories upgrade to Industry 4.0 standards.[2]Photonics21, “European Photonics Market Report 2024,” photonics21.org Developers that master vertical integration and specialty fiber sourcing gain an edge because raw-material bottlenecks and high capital costs deter new entrants
Key Report Takeaways
- By product type, image sensors led with a 37.55% revenue share of the photonic sensors market in 2025, whereas LiDAR sensors are projected to advance at a 12.03% CAGR through 2031.
- By end-user industry, industrial automation held 29.21% of the photonic sensors market in 2025, while automotive applications are forecast to expand at an 11.71% CAGR during 2026-2031.
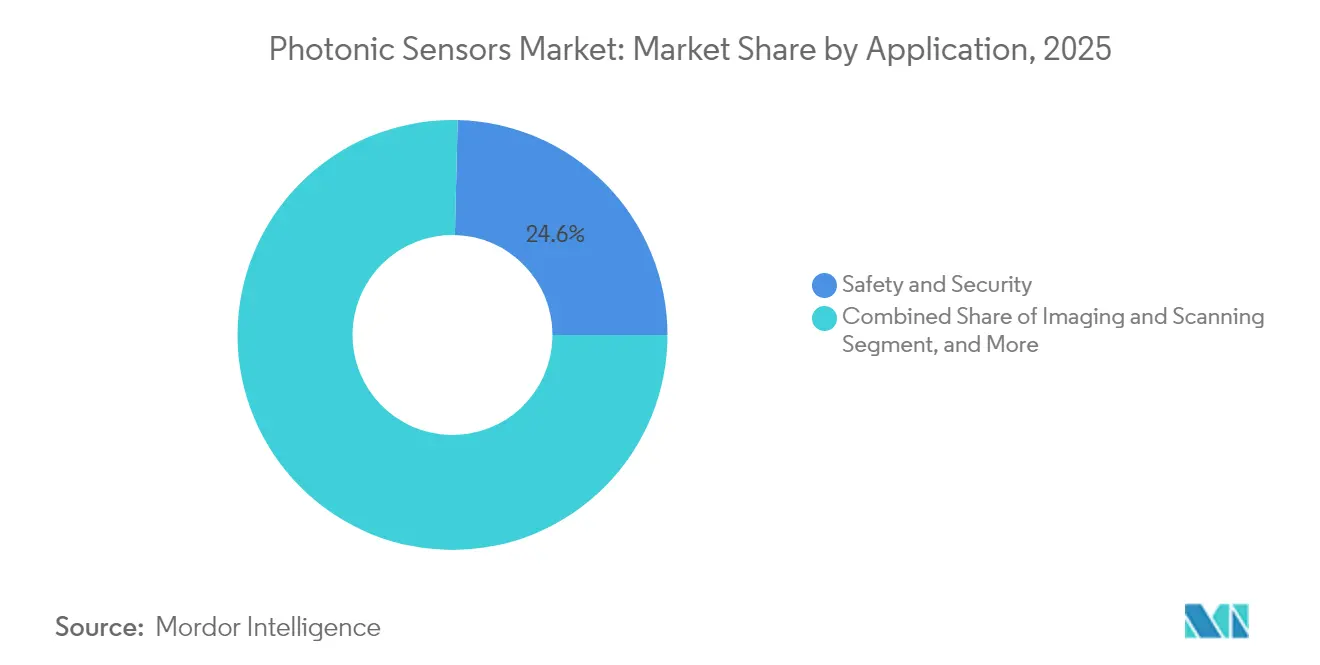
- By application, safety and security accounted for 24.62% of the photonic sensors market and is also the fastest-growing use case at an 11.56% CAGR to 2031.
- By technology, photodiode and CMOS platforms captured 41.32% market share in the photonic sensors market, yet terahertz photonics is poised for the highest 12.22% CAGR through 2031.
- By geography, North America led with a 38.28% stake in 2025 in the photonic sensors market, whereas Asia-Pacific is set to climb at a 12.09% CAGR on the back of automation programs in China, Japan, and South Korea
Note: Market size and forecast figures in this report are generated using Mordor Intelligence’s proprietary estimation framework, updated with the latest available data and insights as of 2026.
Global Photonic Sensors Market Trends and Insights
Drivers Impact Analysis*
| Driver | (~) % Impact on CAGR Forecast | Geographic Relevance | Impact Timeline |
|---|---|---|---|
| Growing automation demand in manufacturing environments | +2.5% | Global, with concentration in APAC and North America | Medium term (2-4 years) |
| Increasing investment in fiber-optic communication infrastructure | +1.8% | Global, led by North America and Europe | Long term (≥ 4 years) |
| Rising demand for safety and security systems in smart cities | +1.2% | Global, early adoption in North America and Europe | Medium term (2-4 years) |
| Expansion of healthcare diagnostics leveraging biophotonic sensing | +2.1% | North America and Europe, expanding to APAC | Long term (≥ 4 years) |
| Emergence of photonic integrated circuits enabling on-chip sensing | +0.9% | Global, led by semiconductor hubs in APAC and North America | Long term (≥ 4 years) |
| Demand for LiDAR-based perception in warehouse robotics | +1.1% | Global, concentrated in developed markets with high labor costs | Medium term (2-4 years) |
| Source: Mordor Intelligence | |||


Growing Automation Demand in Manufacturing Environments
Industrial facilities deploy photonic sensors where micron-level accuracy and immunity to electromagnetic noise are mission-critical.[3]STMicroelectronics, “Annual Report 2024,” st.com Paint-thickness checks, weld inspection, and vibration surveillance demonstrate how fiber-optic sensing raises production yields. Predictive-maintenance programs integrate distributed photonic arrays that identify bearing wear before catastrophic failure. Automotive body shops leverage laser displacement sensors for robotic guidance, reducing cycle times. Industry 4.0 adoption amplifies demand for real-time analytics, and photonic sensor longevity offsets initial capital outlays. As factories digitize, the photonic sensors market embeds deeper in control loops that require deterministic data.
Increasing Investment in Fiber-Optic Communication Infrastructure
Telecom carriers roll out distributed fiber-optic sensing to track temperature, strain, and intrusion along thousands of kilometers of network, safeguarding service uptime.[4]Corning Incorporated, “Form 10-K Annual Report 2024,” corning.com Data-center operators integrate photonic temperature arrays inside racks to pinpoint hotspots that electronic probes miss. 5G densification multiplies base-station links and drives uptake of inline optical monitors that report latency and power drift. Smart-grid programs funded by stimulus bills in North America and Europe include fiber-optic fault-detection to curb outage frequency. As capacity upgrades proceed, embedded sensing becomes a default feature, extending the photonic sensors market into carrier-class hardware.
Rising Demand for Safety and Security Systems in Smart Cities
Municipalities install LiDAR crosswalk monitors that maintain pedestrian safety even in heavy rain or fog. Airports adopt terahertz scanners that detect concealed threats without ionizing radiation. Distributed fiber arrays protect pipelines and borders because passive glass fibers reveal intrusion without emitting signals. Urban air-quality programs place photonic gas sensors on street furniture, generating granular pollution maps for policy enforcement. Traffic-management platforms blend imaging and range data from photonic sensors to optimize signal timing and emergency vehicle routing. The photonic sensors market benefits as public-safety budgets prioritize non-contact, high-fidelity detection.
Expansion of Healthcare Diagnostics Leveraging Biophotonic Sensing
Medical device firms commercialize continuous glucose monitors using photonic biosensors that remove finger-prick routines for 400-million diabetes patients. Surgical robots apply spectral imaging to differentiate healthy from diseased tissue in real time, improving resection margins. Point-of-care kits embed quantum-dot photonic probes that identify pathogens within minutes, accelerating treatment decisions. Wearable devices for an aging population now track heart rhythm and oxygen saturation with miniature photonic emitters and detectors. As reimbursement policies catch up, hospitals integrate photonic sensing into diagnostic workflows, enlarging the photonic sensors market across outpatient and home-care settings.
Restraints Impact Analysis*
| Restraint | (~) % Impact on CAGR Forecast | Geographic Relevance | Impact Timeline |
|---|---|---|---|
| High initial implementation cost | -1.1% | Global, particularly affecting emerging markets | Short term (≤ 2 years) |
| Lack of universal industry standards | -0.5% | Global, with greater impact in fragmented regional markets | Medium term (2-4 years) |
| Supply-chain bottlenecks in specialty optical-fiber preforms | -0.7% | Global, concentrated impact on fiber-optic sensor segments | Medium term (2-4 years) |
| Photonic-sensor performance drift under harsh radiation environments | -0.3% | Aerospace, defense, and nuclear sectors globally | Long term (≥ 4 years) |
| Source: Mordor Intelligence | |||
High Initial Implementation Cost
Comprehensive photonic sensor systems cost USD 50,000–200,000 versus USD 10,000–30,000 for electronic counterparts, stretching payback periods for factories and clinics. Small enterprises delay upgrades despite lower maintenance expenses over the product life cycle. Deployment requires specialist installers and training, inflating total cost of ownership. In healthcare, reimbursement schedules lag technology, limiting adoption of biophotonic diagnostics even when clinical benefits are clear. As volume grows and integrated designs mature, unit prices fall, but near-term budgets restrain the photonic sensors market trajectory.
Supply-Chain Bottlenecks in Specialty Optical-Fiber Preforms
Less than ten suppliers craft sensing-grade preforms, and each expansion cycle needs up to two years for permitting, construction, and qualification. Rare-earth dopants face geopolitical risks, which makes inventory buffers essential. Quality standards exceed telecom grades, pushing yield down and price up. When demand surges for distributed fiber-optic systems, lead times stretch, favoring vertically integrated vendors with captive draw towers. The photonic sensors market therefore encounters volume ceilings until new capacity or substitute materials emerge.
*Our forecasts treat driver/restraint impacts as directional, not additive. The impact forecasts reflect baseline growth, mix effects, and variable interactions.
Segment Analysis
By Product Type: LiDAR Sensors Drive Innovation
Image sensors retained a 37.55% share of the photonic sensors market size in 2025 as automotive cameras, industrial line-scan systems, and machine-vision tools required scalable, low-cost optoelectronics. LiDAR platforms, however, record the fastest 12.03% CAGR due to autonomous mobility, warehouse robotics, and smart-infrastructure deployments that need real-time 3D mapping. Solid-state designs have collapsed unit pricing from USD 10,000 in 2020 to under USD 1,000 by 2024, removing a major adoption barrier. Fiber-optic sensors hold niche roles in structural health monitoring where immunity to lightning and electromagnetic interference outweighs cost. Biophotonic sensors gain ground in diagnostics, especially glucose and lactate monitoring for chronic-disease management.
LiDAR vendors integrate beam steering and signal processing on silicon photonic chips to shrink enclosure size and curb power draw, which aligns with automotive qualification demands. Image-sensor suppliers exploit CMOS fabrication economies to release high dynamic-range devices for factory inspection lighting extremes. Terahertz imagers address security screening and non-destructive testing, although material absorption and regulatory hurdles cap near-term volume. Quantum-dot detectors promise infrared sensitivity at room temperature, attracting interest for night vision. As each technology matures, cross-pollination occurs: 3D cameras embed structured-light emitters, and LiDAR units incorporate cameras for sensor fusion. This convergence diversifies revenue streams within the photonic sensors market.


By End-User Industry: Automotive Acceleration Reshapes Demand
Industrial automation owned 29.21% of photonic sensors market share in 2025 because predictive maintenance and quality assurance require continuous, interference-free data. The automotive category advances at an 11.71% CAGR through 2031 as advanced driver-assistance systems add LiDAR, imaging, and infrared arrays for safety redundancy. Aerospace and defense demand remains steady for navigation and threat detection, with ruggedized photonic sensors specified for vibration, radiation, and temperature extremes.
Healthcare accelerates on wearable biosensors and robotic surgery, while energy utilities adopt distributed fiber-optic systems for real-time pipeline and cable-line monitoring. Consumer electronics remain price-sensitive, yet augmented-reality headsets and gesture-control devices open new design-win opportunities. Environmental monitoring agencies deploy photonic gas analyzers that detect pollutants at parts-per-billion levels. Collectively, these trends broaden the photonic sensors industry footprint beyond early industrial roots.
By Application: Safety and Security Dominance Continues
Safety and security held 24.62% of 2025 revenue and also leads growth at an 11.56% CAGR as cities invest in critical-infrastructure protection. Perimeter intrusion systems use distributed fiber-optic cables to detect vibrations along fences and pipelines. LiDAR crosswalk beacons improve pedestrian awareness for connected vehicles, while terahertz scanners upgrade airport checkpoints without radiation risk. Structural health monitoring tracks bridges and tunnels by measuring micro-strain and temperature drift.
Temperature and pressure sensing serves chemical plants and power grids that operate in high-voltage environments where electronic probes fail prematurely. Chemical and biological detection employs Raman and surface-enhanced techniques for pharmaceutical process control and environmental compliance. Position and displacement sensors underpin robotics and semiconductor lithography that require nanometer accuracy. Multi-modal solutions combine infrared imaging, gas sensing, and displacement measurement in one enclosure, simplifying installation and fueling adoption across the photonic sensors market.
By Technology: Terahertz Photonics Emergence
Photodiode and CMOS architectures delivered 41.32% of 2025 revenue because legacy semiconductor lines produce high volumes at competitive cost, making them default choices for consumer and industrial cameras. Terahertz photonics posts the highest 12.22% CAGR as it fills detection gaps between microwave and infrared bands for hidden-object imaging and dryness assessment in composites.
Fiber Bragg gratings excel in distributed strain and temperature measurement over tens of kilometers, enabling pipeline and rail operators to localize anomalies swiftly. Fabry-Pérot interferometers provide sub-nanometer displacement resolution for metrology labs and precision machine tools. Raman and Brillouin scattering deliver temperature-strain discrimination, crucial for high-voltage cable condition assessment. Quantum dots and nanophotonics promise extreme sensitivity for biosensing, but mass production challenges remain. Artificial-intelligence firmware embedded in photonic integrated circuits adjusts sampling frequency and gain on the fly, reducing data-transfer overhead. These innovations magnify the value proposition of the photonic sensors market.
Geography Analysis
North America accounted for 38.28% of 2025 revenue due to sustained defense procurement, semiconductor fabs, and early autonomous-vehicle pilots that rely on high-performance sensing. Research universities and venture capital ecosystems shorten concept-to-commercial cycles, while reshoring incentives boost demand in chip and battery plants. FDA regulation lengthens medical-device launch timelines but also elevates entry barriers, shielding incumbents in the photonic sensors market.
Asia-Pacific expands at a 12.09% CAGR through 2031 as China, Japan, and South Korea automate factories to offset labor costs and meet export-quality standards. China’s Belt and Road projects embed fiber-optic monitoring in pipelines and railways. Japan’s aging society adopts photonic diagnostics for home care, while South Korea’s semiconductor industry installs airborne-particle detectors with picogram sensitivity. Local governments provide tax breaks for sensor fabs, strengthening regional supply chains.
Europe balances technology exports with strict safety and sustainability mandates. Germany’s Industry 4.0 program disseminates intelligent sensing into Mittelstand factories, and EU Green Deal funds smart-grid rollouts that use distributed fiber-optic sensing. Automotive OEMs in Germany, France, and Sweden incorporate multi-sensor redundancy to achieve Euro NCAP ratings, bolstering photonic sensor demand. Latin America and Africa remain nascent but will unlock growth as telecom and energy infrastructure modernize. Overall, regional diversification protects the photonic sensors market from single-region shocks.

Competitive Landscape
The market is moderately fragmented; the top five suppliers collectively hold under 40%, so no player exceeds an 8% share. Banner Engineering, Baumer, Omron, STMicroelectronics, and Hamamatsu Photonics dominate established verticals such as factory automation and medical imaging. They invest in proprietary fabrication and application-specific integrated circuits, making it costly for customers to switch suppliers. Vertical integration secures specialty fiber, lasers, and packaging, mitigating supply-chain risk that can delay competitors.
Strategic moves illustrate technology race dynamics. STMicroelectronics allocated USD 3.2 billion to scale silicon photonics for LiDAR and data-center modules, narrowing cost gaps with electronics. Coherent acquired II-VI’s sensing division to combine lasers and detectors under one roof, expanding reach in industrial automation. Banner Engineering leverages Microsoft Azure IoT to ship cloud-connected photonic kits that enable predictive maintenance with minimal configuration. Terahertz start-ups focus on single-niche breakthroughs, such as fast-bodyscan portals, aiming to license technology rather than build full production lines.
Pricing pressure persists, but intellectual property and application know-how sustain margins. Leading vendors negotiate long-term take-or-pay contracts for rare-earth dopants. Emerging players differentiate through integrated AI, miniaturization, and custom algorithms, targeting underserved biomedical and mobility segments. The photonic sensors market therefore rewards both scale economies and specialization.
Photonic Sensors Industry Leaders
Banner Engineering Corp
Baumer Holding AG
STMicroelectronics NV
Hamamatsu Photonics KK
Omron Corporation
- *Disclaimer: Major Players sorted in no particular order

Recent Industry Developments
- September 2024: STMicroelectronics announced a EUR 2.9 billion (USD 3.2 billion) expansion of silicon-photonics capacity in Crolles for automotive LiDAR and data-center links.
- August 2024: Coherent Corp completed its USD 1.8 billion takeover of II-VI’s sensing division, forming a vertically integrated fiber-optic sensor platform.
- July 2024: Hamamatsu Photonics introduced a quantum-dot biosensor platform that earned FDA breakthrough designation for continuous glucose monitoring.
- June 2024: Banner Engineering partnered with Microsoft Azure IoT to add real-time analytics to cloud-connected photonic sensor suites.


Global Photonic Sensors Market Report Scope
The photonic sensor senses light and converts it to an electric signal. Photonic sensing technology integrates light emission, detection, and transmission through fiber optics and optical components. Photonic sensors are used in many applications, such as lidar, ladar, laser-induced fluorescence (LIF), calorimetry, scintillation detection, spectroscopy, and biological fluorescence detection.
The photonic sensors market is segmented by product type (fiber optic sensors, biophotonic sensors, image sensors, and other product types), end-user industry (aerospace and defense, automotive, industrial, healthcare, energy and power, consumer electronics, and other end-user industries), and geography (North America, Europe, Asia-Pacific, and the Rest of the World). The report offers the market size in value terms in USD for all the abovementioned segments.
| Fiber-Optic Sensors |
| Image Sensors |
| Biophotonic Sensors |
| LiDAR Sensors |
| Other Product Types |
| Aerospace and Defense |
| Automotive |
| Industrial Automation |
| Healthcare and Life Sciences |
| Energy and Power |
| Consumer Electronics |
| Environmental Monitoring |
| Other End-User Industries |
| Structural Health Monitoring |
| Temperature and Pressure Sensing |
| Chemical and Biological Sensing |
| Position and Displacement Sensing |
| Safety and Security |
| Imaging and Scanning |
| Others |
| Fiber Bragg Grating |
| Fabry–Pérot Interferometry |
| Raman and Brillouin Scattering |
| Photodiode and CMOS |
| Quantum Dots and Nanophotonics |
| Terahertz Photonics |
| Others |
| North America | United States | |
| Canada | ||
| Mexico | ||
| South America | Brazil | |
| Argentina | ||
| Rest of South America | ||
| Europe | Germany | |
| United Kingdom | ||
| France | ||
| Italy | ||
| Spain | ||
| Rest of Europe | ||
| Asia-Pacific | China | |
| Japan | ||
| South Korea | ||
| India | ||
| ASEAN | ||
| Rest of Asia-Pacific | ||
| Middle East and Africa | Middle East | Saudi Arabia |
| United Arab Emirates | ||
| Turkey | ||
| Rest of Middle East | ||
| Africa | South Africa | |
| Nigeria | ||
| Rest of Africa | ||
| By Product Type | Fiber-Optic Sensors | ||
| Image Sensors | |||
| Biophotonic Sensors | |||
| LiDAR Sensors | |||
| Other Product Types | |||
| By End-User Industry | Aerospace and Defense | ||
| Automotive | |||
| Industrial Automation | |||
| Healthcare and Life Sciences | |||
| Energy and Power | |||
| Consumer Electronics | |||
| Environmental Monitoring | |||
| Other End-User Industries | |||
| By Application | Structural Health Monitoring | ||
| Temperature and Pressure Sensing | |||
| Chemical and Biological Sensing | |||
| Position and Displacement Sensing | |||
| Safety and Security | |||
| Imaging and Scanning | |||
| Others | |||
| By Technology | Fiber Bragg Grating | ||
| Fabry–Pérot Interferometry | |||
| Raman and Brillouin Scattering | |||
| Photodiode and CMOS | |||
| Quantum Dots and Nanophotonics | |||
| Terahertz Photonics | |||
| Others | |||
| By Geography | North America | United States | |
| Canada | |||
| Mexico | |||
| South America | Brazil | ||
| Argentina | |||
| Rest of South America | |||
| Europe | Germany | ||
| United Kingdom | |||
| France | |||
| Italy | |||
| Spain | |||
| Rest of Europe | |||
| Asia-Pacific | China | ||
| Japan | |||
| South Korea | |||
| India | |||
| ASEAN | |||
| Rest of Asia-Pacific | |||
| Middle East and Africa | Middle East | Saudi Arabia | |
| United Arab Emirates | |||
| Turkey | |||
| Rest of Middle East | |||
| Africa | South Africa | ||
| Nigeria | |||
| Rest of Africa | |||


Key Questions Answered in the Report
What is the projected value of the photonic sensors market in 2031?
The market is expected to reach USD 62.13 billion by 2031.
Which region is growing fastest for photonic sensors?
Asia-Pacific is forecast to grow at a 12.09% CAGR between 2026 and 2031.
Which product category leads current revenue?
Image sensors hold 37.55% of 2025 revenue.
Why are LiDAR sensors gaining traction?
Cost of solid-state LiDAR fell below USD 1,000, enabling broader use in autonomous vehicles and robotics.
What main factor restrains adoption in emerging markets?
High initial implementation cost delays investment despite long-term reliability benefits.
Page last updated on:


