Energy & Power
30th JulyUnlocking Market Potential for Solid-State Transformers
3 Min Read
The Philippines Power Market Report is Segmented by Power Source (Thermal, Nuclear, and Renewables) and End-User (Utilities, Commercial and Industrial, and Residential). The Market Sizes and Forecasts are Provided in Terms of Installed Capacity (GW).
Market Overview
| Study Period | 2020 - 2030 |
|---|---|
| Base Year For Estimation | 2024 |
| Forecast Data Period | 2025 - 2030 |
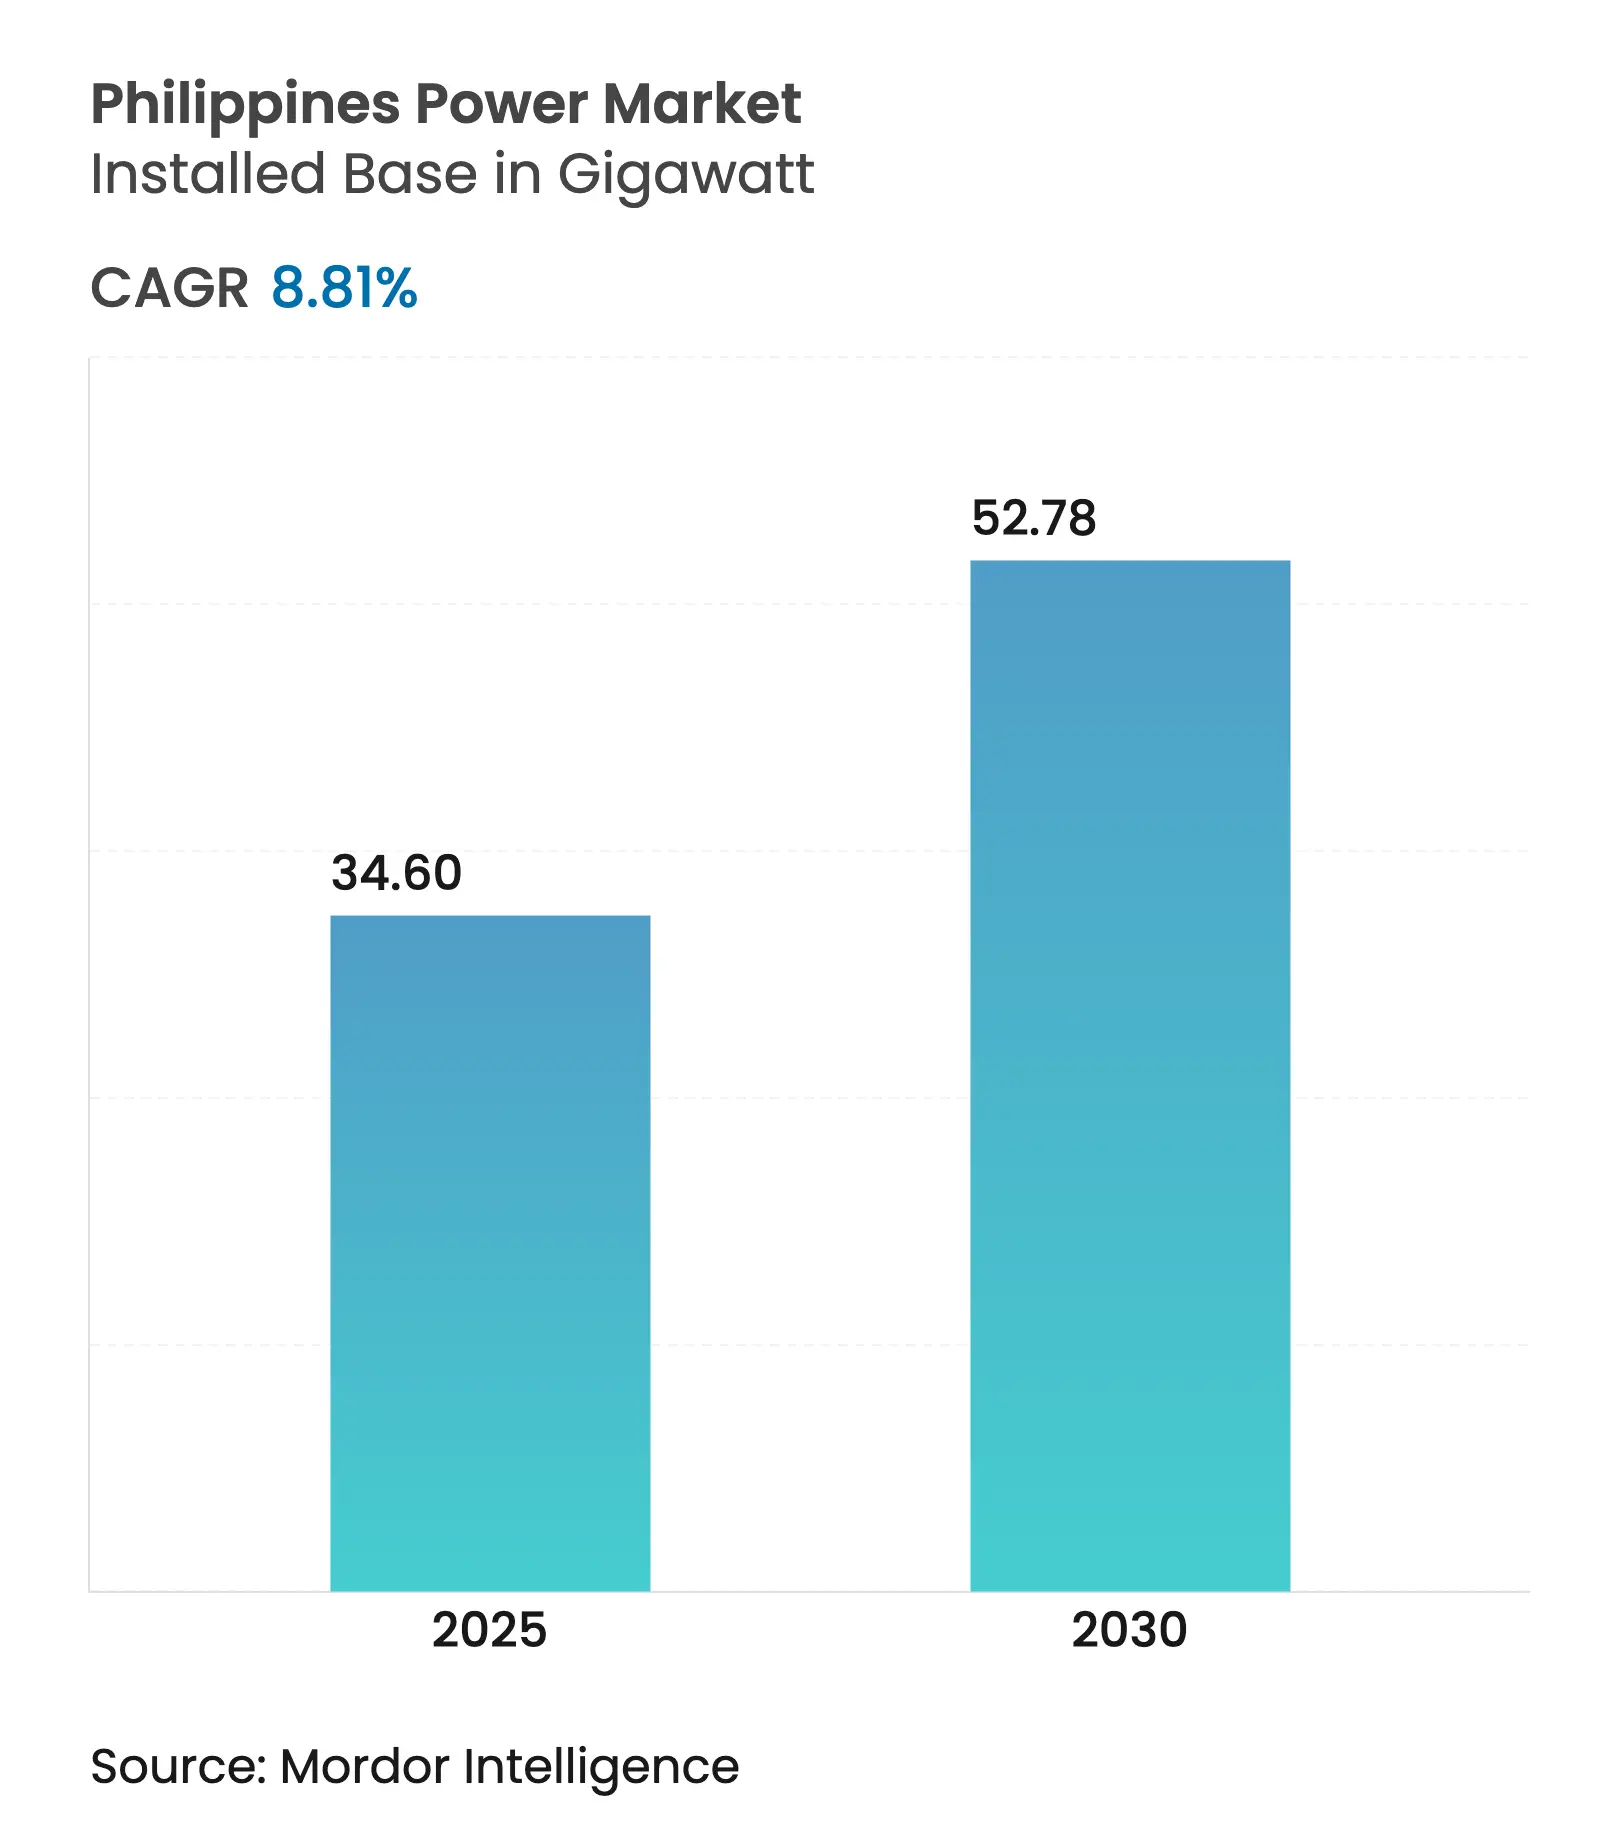
| Market Volume (2025) | 34.60 gigawatt |
| Market Volume (2030) | 52.78 gigawatt |
| CAGR | 8.81 % |
| Market Concentration | Medium |
Major Players *Disclaimer: Major Players sorted in no particular order. Image © Mordor Intelligence. Reuse requires attribution under CC BY 4.0. |
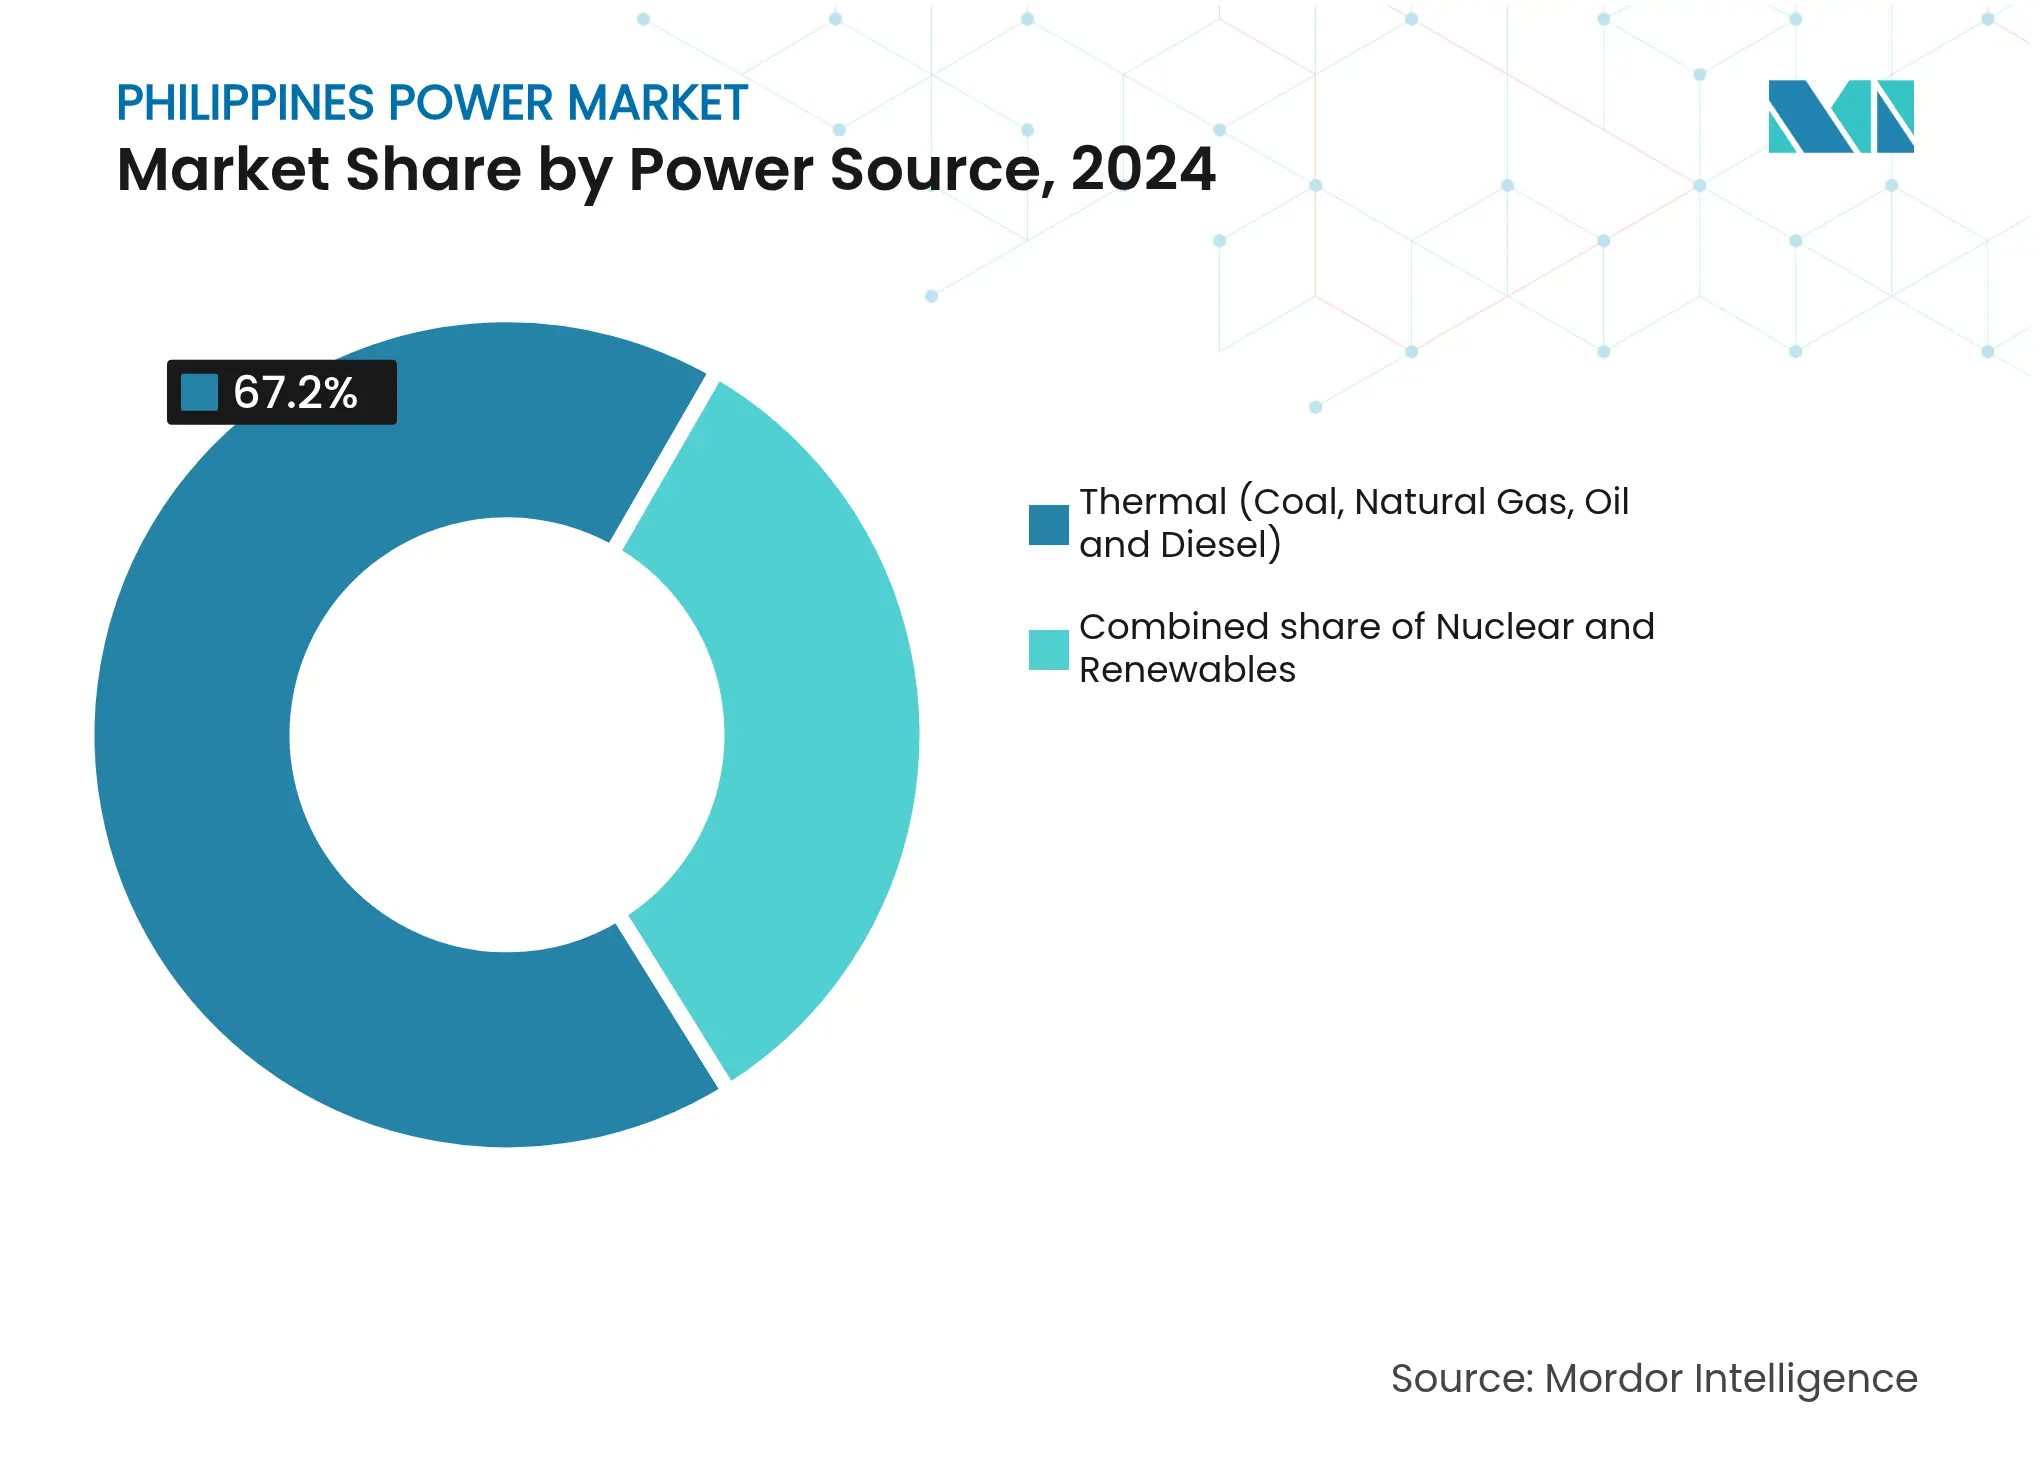
Rapid industrial recovery, a hyperscale data-center pipeline, and aggressive renewable-energy mandates are accelerating capacity additions faster than those of most Southeast Asian peers. Thermal sources still dominated with 67.2% of generation in 2024, but renewables are the fastest-growing, and will push grid operators to expand transmission corridors and strengthen frequency-regulation services. Growing electricity demand, up 5.8% in 2024, coupled with a revised net-metering framework that lifted the rooftop-solar cap to 500 kW, is widening distributed-generation opportunities. At the same time, high retail tariffs and post-Malampaya LNG volatility are nudging commercial users toward direct power-purchase agreements, intensifying competition among generators for bankable offtake contracts. Conglomerates are answering with multi-gigawatt renewable targets and early-stage battery-storage pilots, signaling that flexibility services will become a prized revenue stream over the next five years.
Key Report Takeaways
Drivers Impact Analysis
| Driver | (~) % Impact on CAGR Forecast | Geographic Relevance | Impact Timeline | |||
|---|---|---|---|---|---|---|
Growing electricity demand surge Growing electricity demand surge | +1.8% | National, especially Metro Manila and CALABARZON | Medium term (2–4 years) | (~) % Impact on CAGR Forecast:+1.8% | Geographic Relevance:National, especially Metro Manila and CALABARZON | Impact Timeline:Medium term (2–4 years) |
Government renewable-energy incentives Government renewable-energy incentives | +2.1% | National, early gains in Luzon and Visayas | Long term (≥ 4 years) | |||
Feed-in-tariff & RPS compliance momentum Feed-in-tariff & RPS compliance momentum | +1.5% | National | Medium term (2–4 years) | |||
Transmission & distribution build-out (NGCP) Transmission & distribution build-out (NGCP) | +1.3% | Luzon, Visayas, Mindanao interconnections | Long term (≥ 4 years) | |||
Hyperscale data-center pipeline boosts load Hyperscale data-center pipeline boosts load | +1.0% | Metro Manila, Cavite, Laguna | Short term (≤ 2 years) | |||
Net-metering revision spurs rooftop solar Net-metering revision spurs rooftop solar | +1.2% | Metro Manila, Cebu, Davao | Short term (≤ 2 years) | |||
| Source: Mordor Intelligence | ||||||
Growing Electricity-Demand Surge
National electricity consumption climbed 5.8% in 2024 as semiconductor assembly, food processing, and business-process outsourcing facilities expanded output.[1]Philippine Statistics Authority, “Energy Accounts of the Philippines,” psa.gov.ph Peak load on Luzon topped 16 GW during the summer months, outstripping dispatchable capacity and prompting the Department of Energy to prioritize 2 GW of battery-storage procurement by 2028. Residential demand rose 3.1% on wider air-conditioning adoption in second-tier cities. Mindanao's load jumped 6.7% after the Mindanao-Visayas Interconnection Project began trial operations. The imbalance between new industrial loads and ageing thermal assets underscores why the Philippines' power market must accelerate flexible resources, including fast-ramping gas peakers and grid-scale batteries. Developers now factor grid-congestion risk and curtailment penalties into project economics, reshaping site selection toward regions with spare substation headroom.
Government Renewable-Energy Incentives
The 2024 Philippine Energy Plan mandates a 35% renewable share by 2030 and 50% by 2040, supported by seven-year income-tax holidays for solar and wind projects above 50 MW. The third Green Energy Auction round cleared 2.5 GW of solar at PHP 2.45 per kWh (USD 0.044), 30% below new-coal costs, proving that renewables have reached cost parity. Distribution utilities must procure 2.5% of supply from renewables in 2025 and 5% by 2027, or pay penalties that flow into an off-grid electrification fund.[2]Energy Regulatory Commission, “Net-Metering Rules 2024,” erc.gov.ph These mandates are catalyzing long-term PPAs; fifteen contracts totaling 800 MW were signed in the first half of 2024 alone. Policy clarity is also unlocking international climate finance that lowers debt costs for utility-scale solar, improving project bankability amid rising domestic interest rates.
Feed-in-Tariff & RPS Compliance Momentum
Feed-in-tariffs have underwritten 1.2 GW of biomass, small hydro, and ocean-energy additions since 2012, but capacity quotas were fully subscribed by 2024. The transition to competitive auctions shifts bargaining power to large developers that can finance projects at single-digit return targets. Meanwhile, the Renewable Portfolio Standards have spawned a robust secondary market for renewable-energy certificates, with PHP 1.2 billion in trades during 2024, triple the prior year.[3]Department of Energy, “2024 Philippine Energy Plan,” doe.gov.ph Distribution utilities unable to meet targets face PHP 0.50 per kWh penalties, nudging them to lock in multi-gigawatt solar and wind contracts below the penalty rate. The resulting uptick in renewables accelerates the displacement of mid-merit diesel and bunker-fuel plants, trimming fuel imports and associated foreign-exchange exposure.
Transmission & Distribution Build-Out
NGCP launched a PHP 600 billion program in 2024 to add 3,200 circuit-kilometers of transmission and 15 new substations by 2030. Flagship projects include the 440 kV Luzon-Visayas HVDC link and the Mindanao backbone upgrade to 500 kV. Right-of-way disputes and local-government easement negotiations, averaging 18 months in 2024, remain a material execution risk. To align incentives, the Energy Regulatory Commission now ties NGCP’s allowed returns to line-availability metrics, rewarding faster completion. At the distribution level, Meralco’s PHP 120 billion smart-grid plan will install advanced meters for 7 million customers and automate feeders that isolate faults within 90 seconds, halving outage durations.
Restraints Impact Analysis
| Restraint | (~) % Impact on CAGR Forecast | Geographic Relevance | Impact Timeline | |||
|---|---|---|---|---|---|---|
Grid congestion & ageing assets Grid congestion & ageing assets | -1.4% | Luzon corridors, Visayas sub-transmission | Medium term (2–4 years) | (~) % Impact on CAGR Forecast:-1.4% | Geographic Relevance:Luzon corridors, Visayas sub-transmission | Impact Timeline:Medium term (2–4 years) |
High retail electricity tariffs High retail electricity tariffs | -0.9% | National, most acute in Luzon | Short term (≤ 2 years) | |||
Indigenous-land disputes delay hydro & geo Indigenous-land disputes delay hydro & geo | -0.7% | Mindanao, Northern Luzon | Long term (≥ 4 years) | |||
Post-Malampaya LNG price volatility Post-Malampaya LNG price volatility | -1.1% | Luzon gas-fired plants | Medium term (2–4 years) | |||
| Source: Mordor Intelligence | ||||||
Grid Congestion & Ageing Assets
Transmission bottlenecks curtailed 1.2 GW of solar output in 2024, mainly in CALABARZON, where substation capacity was saturated.[4]National Grid Corporation of the Philippines, “Transmission Development Plan 2024,” ngcp.ph Forty percent of 230 kV lines exceed their 30-year design life, raising failure rates. Coal retirements also reduce synchronous inertia, heightening frequency-excursion risks. NGCP’s upgrades will not fully alleviate congestion until after 2027, so developers are tilting toward distributed solar and behind-the-meter storage that bypasses grid constraints. Visayas, with sub-transmission built mostly at 69 kV, suffered 18 unplanned outages in 2024 that disrupted 450 MW of industrial load.
Indigenous-Land Disputes Delay Hydro & Geothermal
Free Prior Informed Consent requirements stalled 300 MW of geothermal and run-of-river hydro in Mindanao and Northern Luzon as developers negotiate with 47 indigenous communities.[5]National Commission on Indigenous Peoples, “FPIC Guidelines,” ncip.gov.ph Energy Development Corporation’s 40 MW expansion remains on hold while water-rights and benefit-sharing terms are finalized. New guidelines standardize a 1%–2% revenue-sharing model, but implementation varies, and re-consultations can extend timelines by up to three years.
By Power Source: Renewables Gain on Thermal Dominance
The Philippines' power market size for generation by power source stood at 32.31 GW in 2024, with thermal plants holding 67.2% of the Philippines' power market share. Renewable capacity is expanding at a 19.2% CAGR, driven by low solar auction tariffs and rising RPS quotas. Coal additions are capped at 500 MW through 2030 under the conditional moratorium that requires equal retirement of subcritical units, while 2.1 GW of solar was cleared in auctions in 2024 at record-low tariffs. Wind progress is slower at 300 MW because of grid constraints, yet offshore wind potential is mapped at 25 GW once seabed-lease rules are finalized. Natural-gas share is slipping as Malampaya declines; LNG imports will reposition gas as a peaking resource rather than baseload. Geothermal remains flat near 1.9 GW amid consent delays, and hydro's upside is tempered by long permitting cycles.
The investment thesis is tilting toward hybrid portfolios that bundle utility-scale solar with four-hour lithium-ion systems, capturing both energy and ancillary revenues. Developers watch curtailment risk closely; projects now co-locate batteries or choose Mindanao sites with surplus transmission headroom. Meanwhile, biomass and waste-to-energy growth is limited by feedstock constraints, and nuclear feasibility studies will not influence capacity before 2035.
Note: Segment shares of all individual segments available upon report purchase
By End User: Commercial and Industrial Demand Surges
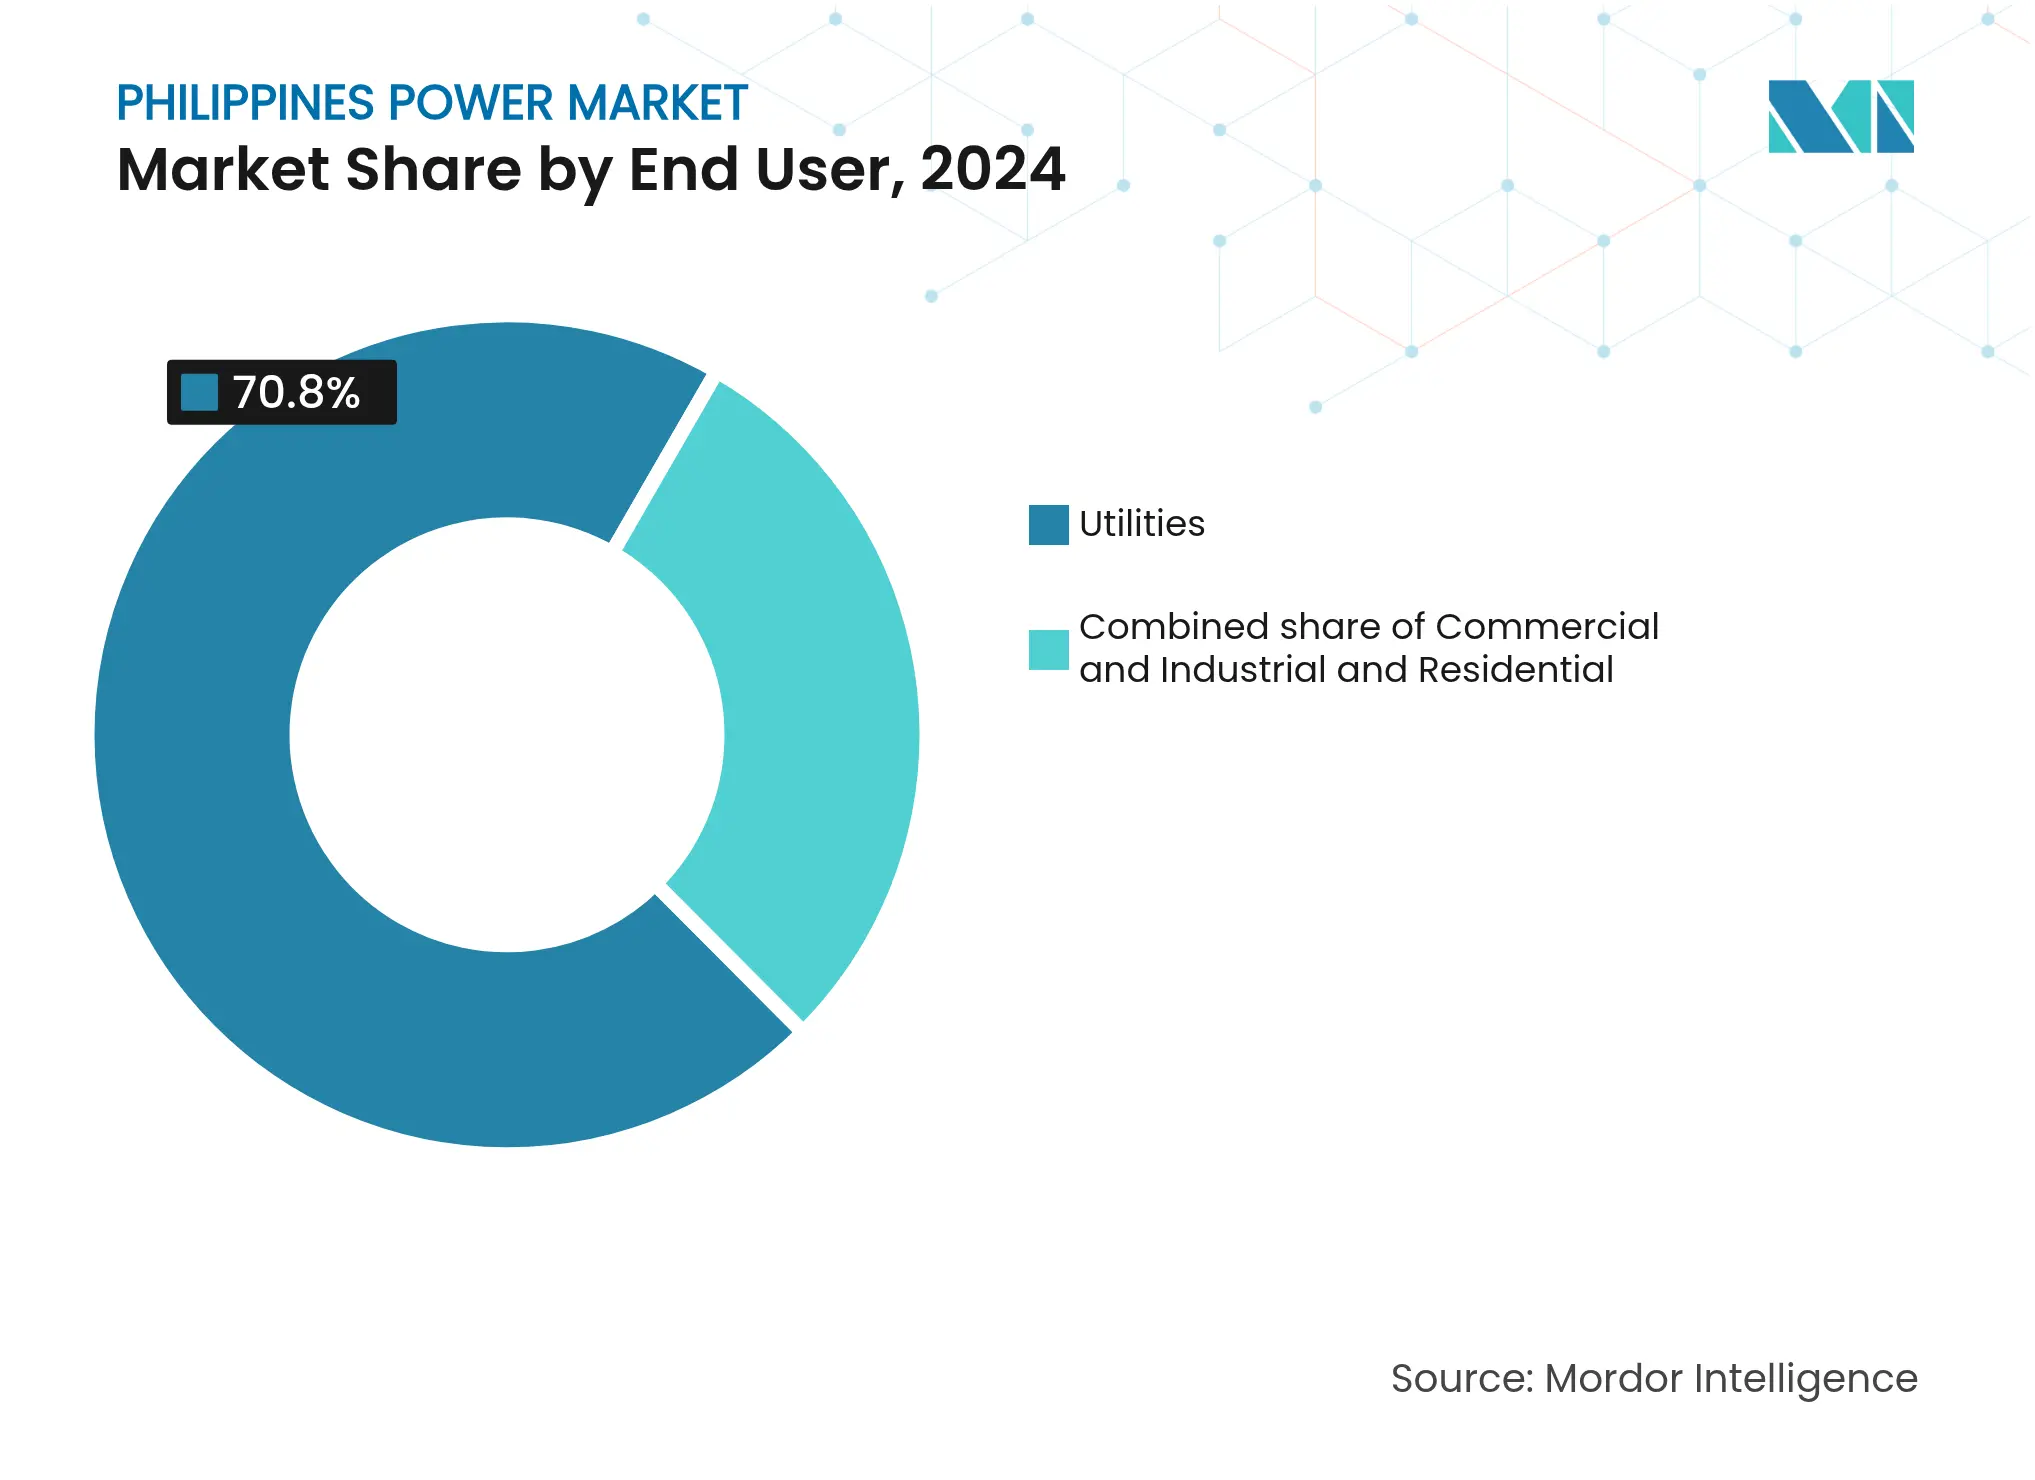
Utilities accounted for 70.8% of installed capacity in 2024, yet the commercial and industrial segment is advancing at a 13.1% CAGR, the fastest among all end users. Roughly 400 MW of behind-the-meter solar came online in 2024 as manufacturers and business-process outsourcing campuses sought to hedge against PHP 11.50-per-kWh grid tariffs. Retail Competition and Open Access enrolled 1,200 contestable customers representing 1.8 GW of load, a total expected to double when the threshold drops to 100 kW by 2027.
Corporate sustainability targets also drive demand for renewable PPAs bundled with certificates. Fifteen contracts totaling 800 MW were signed in 2024, locking in tariffs below the universal-charge inclusive rates offered by distribution utilities. Utilities face revenue compression and have proposed grid-access fees on net-metered customers to recover fixed costs. Residential uptake of rooftop solar is climbing at a slower 4.2% CAGR but benefits from declining module costs and 90% peak-hour export credits.
Note: Segment shares of all individual segments available upon report purchase
Luzon housed two-thirds of the national capacity in 2024, but transmission bottlenecks in CALABARZON curtailed 1.2 GW of solar output, underscoring the urgency of the Luzon-Visayas HVDC link. Coal and natural gas still provide 75% of Luzon generation, yet 2.5 GW of solar awarded in late 2024 will shift the mix toward renewables. First Gen’s Batangas LNG terminal is online, and San Miguel’s Bataan facility will add capacity in 2026, cushioning the Malampaya decline.
Visayas depends on imports from Mindanao via the new interconnection, which enabled 300 MW of hydro transfers during trial operations in 2024. Sub-transmission fragility caused 18 outages that disrupted industrial users, making the PHP 600 billion transmission plan central to economic resilience. Offshore-wind prospects in Guimaras and Negros Occidental total 500 MW pending seabed-lease approvals, while run-of-river hydro in Leyte faces consent delays.
Mindanao is emerging as the renewable swing supplier, with 4 GW of hydro and geothermal either operational or under construction. Electricity demand rose 6.7% in 2024 on mining and agro-industrial growth, and retail tariffs remain lower than Luzon’s because of abundant hydro. The backbone upgrade to 500 kV scheduled for 2028 will unlock 2 GW of additional capacity and facilitate larger exports northward.

Reports are available across multiple geographies.
Gain in-depth market insights across regions to support informed decisions.
Market Concentration
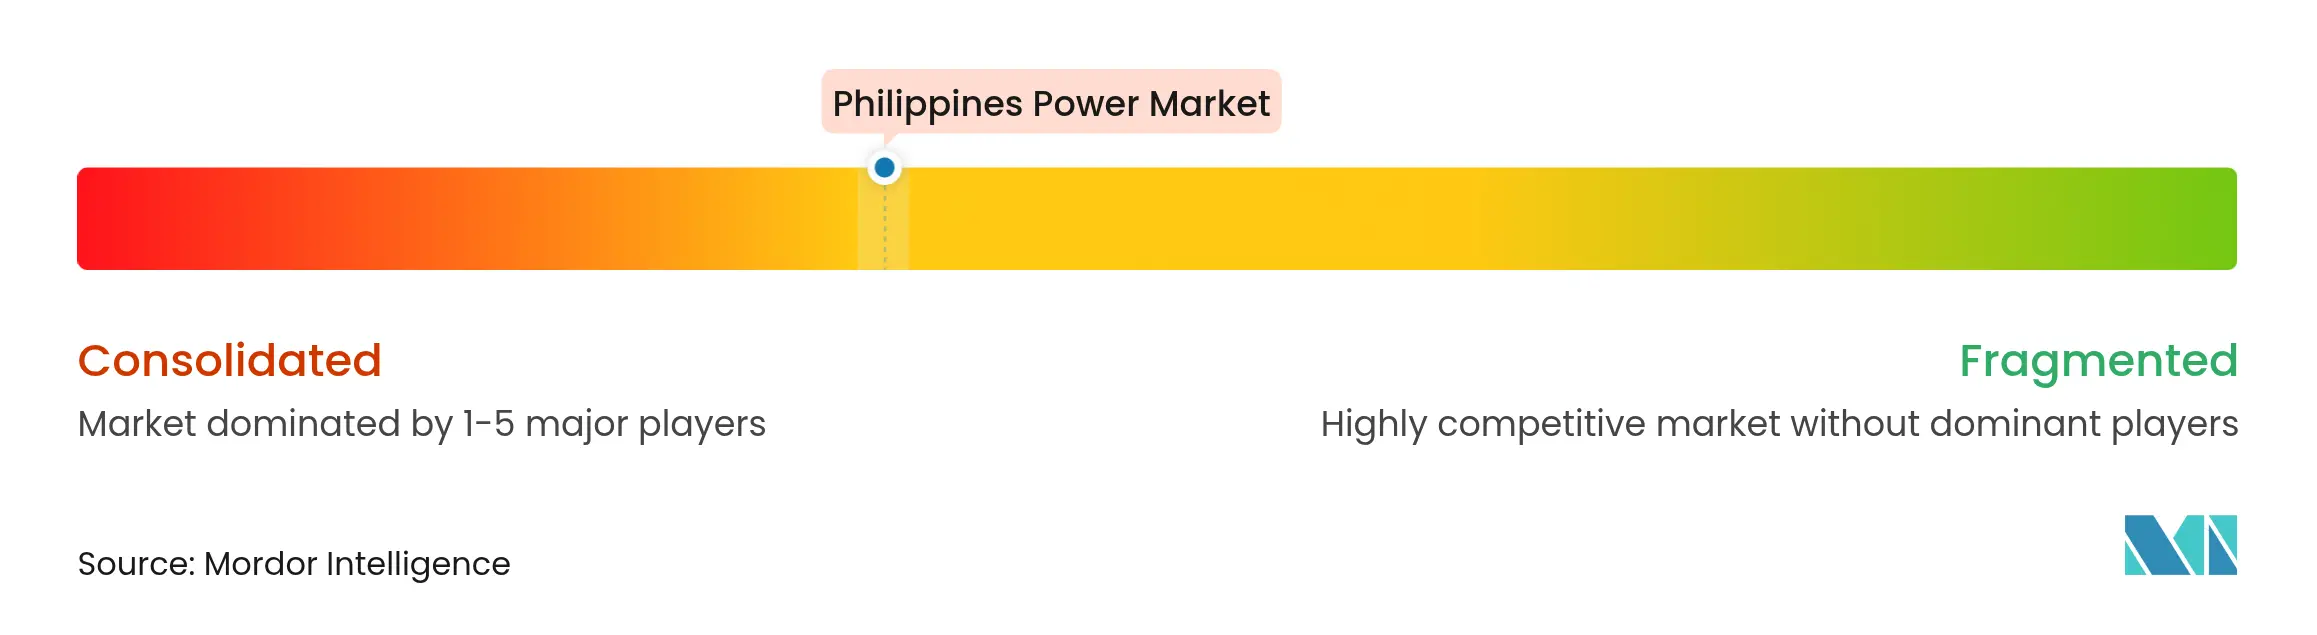
The top five players control about 60% of installed capacity, giving the Philippines' power market a moderate concentration profile. AboitizPower and ACEN each target 10 GW of renewables by 2030, requiring USD 8–10 billion of capital deployment. San Miguel Global Power is piloting a 10 MW / 40 MWh battery at its Sual coal plant and building an LNG terminal to hedge its coal legacy. First Gen's 150 MW / 600 MWh battery co-located with its San Gabriel gas plant exemplifies hybrid assets that can capture capacity and ancillary revenues.
Solar Philippines and Citicore Renewable Energy lead the rooftop segment, shipping turnkey systems at PHP 50,000 per kW and bundling 10-year maintenance, giving them a 40% share of new installations in 2024. International developers such as Equinor and Ørsted are evaluating offshore-wind sites, pending seabed-lease guidelines. Meralco's advanced-metering rollout for 7 million customers will enable time-of-use pricing and demand response, reinforcing its regulated-return base despite a shrinking volumetric margin.

*Disclaimer: Major Players sorted in no particular order
1. Introduction
2. Research Methodology
3. Executive Summary
4. Market Landscape
5. Market Size & Growth Forecasts
6. Competitive Landscape
7. Market Opportunities & Future Outlook
Power is generated through various primary sources such as coal, hydro, solar, thermal, etc. In utilities, it's a step before its delivery to its end users. Then the process is followed by Transmission and distribution. Under this, the power generated is distributed via high-voltage lines (transmission lines) and low-voltage lines (distribution lines) as per the requirement of the end user.
The Philippines power market is segmented By Power Source (Thermal (Coal, Natural Gas, Oil and Diesel), Nuclear, Renewables (Solar, Wind, Hydro, Geothermal, Biomass & Waste, Tidal), By End User (Utilities, Commercial and Industrial, Residential), By T&D Voltage Level (Qualitative Analysis only) (High-Voltage Transmission (Above 230 kV), Sub-Transmission (69 to 161 kV), Medium-Voltage Distribution (13.2 to 34.5 kV), Low-Voltage Distribution (Up to 1 kV)). For each segment, the market sizing and forecasts are based on installed capacity, except for power transmission and distribution (T&D), for which only qualitative analysis will be provided.
Unlocking Market Potential for Solid-State Transformers
3 Min Read
Wealth Management Intelligence for the Middle East
4 Min Read
Unlocking Opportunities in Singapore's Chemical Logistics Market
5 Min Read
When decisions matter, industry leaders turn to our analysts. Let’s talk.