Pelargonic Acid Market Size and Share
Market Overview
| Study Period | 2020 - 2030 |
|---|---|
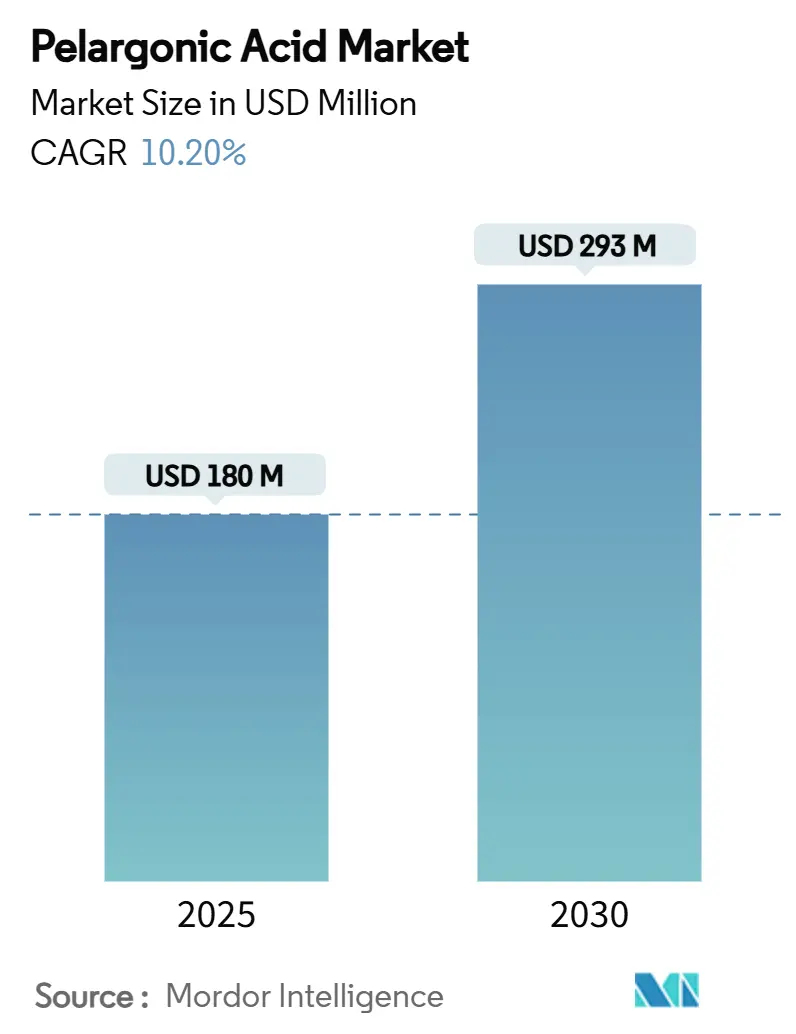
| Market Size (2025) | USD 180 Million |
| Market Size (2030) | USD 293 Million |
| Growth Rate (2025 - 2030) | 10.20% CAGR |
| Fastest Growing Market | Asia Pacific |
| Largest Market | Europe |
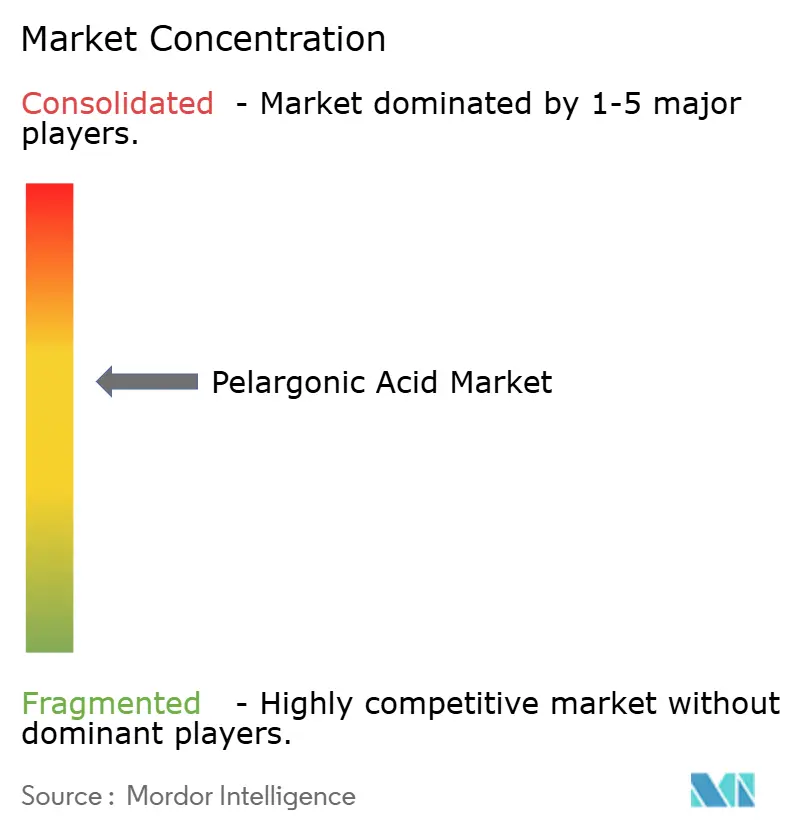
| Market Concentration | Medium |
Major Players *Disclaimer: Major Players sorted in no particular order Image © Mordor Intelligence. Reuse requires attribution under CC BY 4.0. | |
Pelargonic Acid Market Analysis by Mordor Intelligence
The pelargonic acid market size stands at USD 180 million in 2025 and is forecast to reach USD 293 million by 2030, translating to a 10.20% CAGR over the period. Heightened scrutiny of glyphosate, supportive regulatory updates, and an accelerated shift toward bio-based chemistry anchor this expansion. Demand strengthens further as sustainable farming keeps rising, urban vegetation managers phase out synthetics, and new ester technologies extend rain-fastness. Competitive intensity also increases as venture-funded start-ups and established agrochemical producers race to improve formulation performance. Together, these factors set the stage for the pelargonic acid market to move from a specialty segment to a mainstream choice in integrated weed-management programs.
Key Report Takeaways
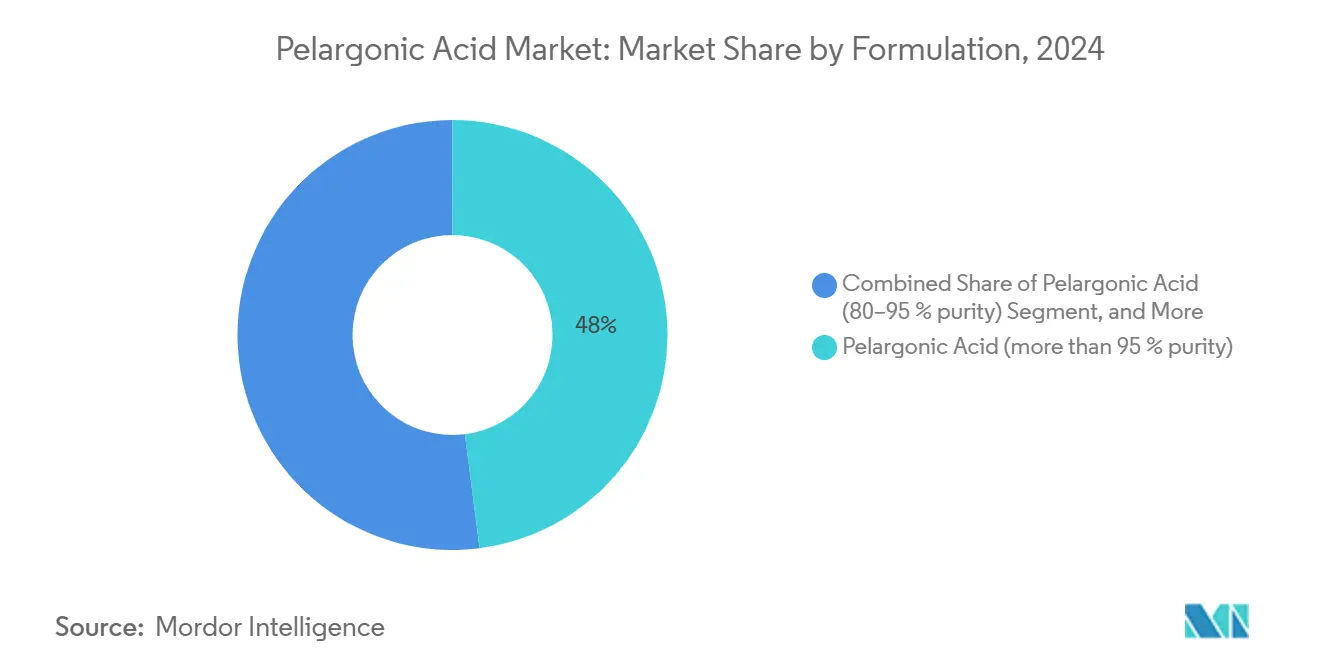
- By formulation, pelargonic acid at 95% purity or higher led with 48% pelargonic acid market share in 2024, while pelargonic acid esters are projected to advance at a 14.8% CAGR through 2030.
- By crop type, fruits and vegetables accounted for 36.4% of the pelargonic market size in 2024, turf and ornamentals are poised for the fastest expansion at 13.2% CAGR to 2030.
- By application, herbicide use dominated the market with a 79% share in 2024, whereas harvest desiccants are projected to rise at a 15.1% CAGR between 2025 and 2030.
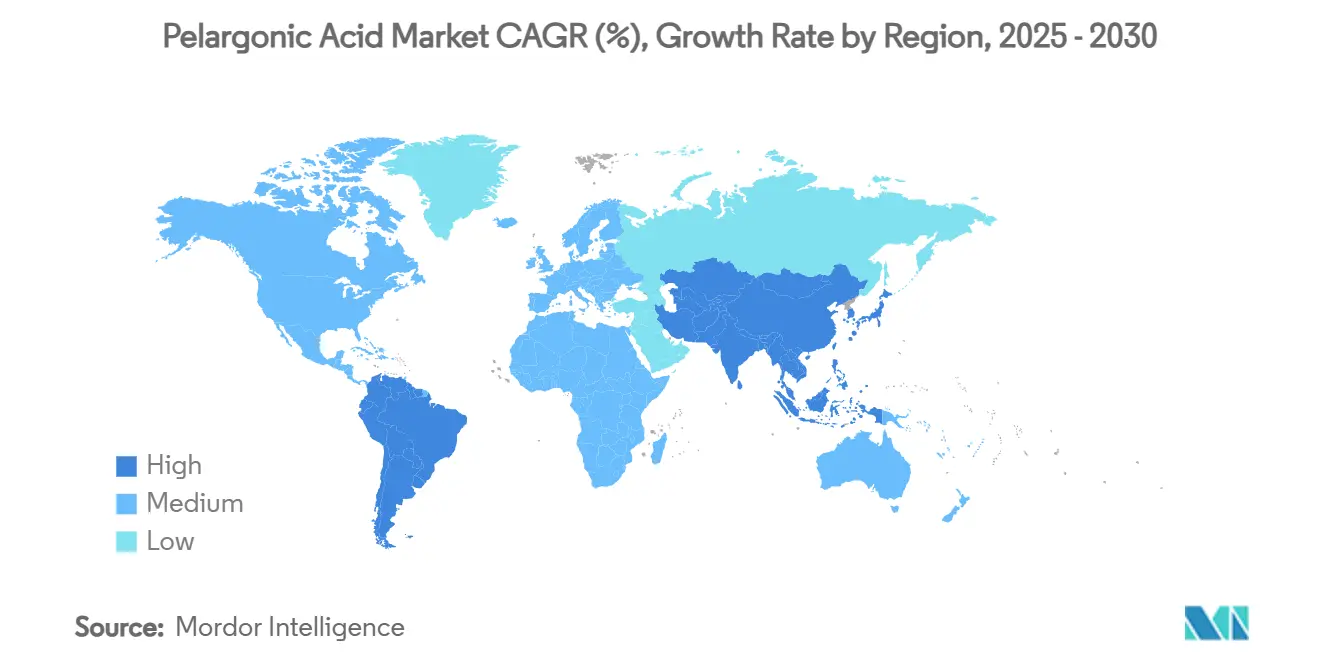
- By geography, Europe led the pelargonic acid market in 2024, accounting for 38% of the market size, and the Asia-Pacific region is projected to grow the fastest at a 13% CAGR through 2030.
- The top five players, including Albaugh Holdings, Corteva Agriscience, Nufarm Limited, Belchim Crop Protection (Mitsui & Co.), and Emery Oleochemicals (PTT Global Chemical), control the majority share in the pelargonic acid market in 2024.
Global Pelargonic Acid Market Trends and Insights
Drivers Impact Analysis*
| Driver | (~) % Impact on CAGR Forecast | Geographic Relevance | Impact Timeline |
|---|---|---|---|
| Growing Bans on Glyphosate in Europe and Parts of North America | +2.1% | Europe and North America | Medium term (2-4 years) |
| Weed Resistance Drives Demand for New Herbicide Modes | +1.7% | Global, strongest in North America, Europe, and the Asia-Pacific | Medium term (2-4 years) |
| Rapid Degradation Profile Allows Same-Season Crop Rotation | +1.4% | Global, particularly intensive farming regions | Short term (≤ 2 years) |
| Pelargonic Acid Ester Adjuvants Improving Rain-Fastness | +1.2% | Global, high-rainfall regions | Medium term (2-4 years) |
| Shift Toward Conservation Tillage and Cover-Crops | +1.0% | North America, Europe, and expanding to the Asia-Pacific | Medium term (2-4 years) |
| Venture-Capital Inflows into Bio-Based Crop-Protection Start-Ups | +0.9% | North America, Europe, and the Asia-Pacific | Medium term (2-4 years) |
| Source: Mordor Intelligence | |||
Growing Bans on Glyphosate in Europe and Parts of North America
Multiple European states and several United State counties are tightening or outright banning glyphosate, forcing growers and municipal land managers to find compliant options. Pelargonic acid formulations are filling this gap because they deliver contact burn-down without long soil persistence. High-value crops, railways, and utility corridors have quickly integrated pelargonic acid into rotation programs to avoid regulatory fines and public backlash. Distributors report a pronounced demand spike whenever new glyphosate curbs are announced. Equipment manufacturers are also adjusting nozzle designs to improve deposition efficiency for pelargonic acid applications in these regulated arenas[1]Source: New York State Department of Transportation, “Vegetation Management Guidance 2024,” NYSDOT, ny.gov.
Weed Resistance Drives Demand for New Herbicide Modes
Herbicide-resistant weeds number 263 species across 71 countries, creating an urgent need for chemistries that bypass the target-site mutations hampering conventional actives. Pelargonic acid attacks plant cell membranes, a biophysical mechanism that differs from enzyme-inhibiting synthetics and retains activity against glyphosate-, ALS (Acetolactate Synthase), and PPO (Protoporphyrinogen Oxidase) resistant biotypes.[2]Source: Ian Heap, “International Survey of Herbicide Resistant Weeds,” WeedScience.org, weedscience.org Field trials confirm consistent control of Palmer amaranth, waterhemp, and horseweed, giving growers a reliable rotation partner for resistance-management programs. The United States alone loses more than USD 11 billion each year to resistant weeds, so producers increasingly accept pelargonic acid’s higher cost to protect yield potential. Because its contact mode of action disrupts multiple membrane components at once, scientists consider the risk of resistance development to pelargonic acid extremely low, strengthening its long-term fit in integrated weed-management strategies.
Rapid Degradation Profile Allows Same-Season Crop Rotation
Pelargonic acid breaks down within hours to a day in most soils, freeing growers to replant quickly. Intensive greenhouse vegetable operations adopt it for pre-plant burndown because persistent herbicides compromise subsequent plantings. IR-4 Project trials in 2024 confirmed that pelargonic acid leaves no phytotoxic residues, enabling same-week crop rotation. These efficiency gains resonate with growers facing tight production windows and high greenhouse rents.
Pelargonic Acid Ester Adjuvants Improving Rain-Fastness
Next-generation ester derivatives such as methyl-capped polyethylene glycol esters have shown stronger leaf retention and reduced volatility compared with legacy fatty acid formulations. Field research across Mediterranean vineyards achieved comparable weed control at 20% lower use rates, even after rainfall events, saving growers on both product and labor costs. Greenhouse operators value lower odor levels, making ester versions attractive where ventilation is limited.
Restraints Impact Analysis*
| Restraint | (~) % Impact on CAGR Forecast | Geographic Relevance | Impact Timeline |
|---|---|---|---|
| Higher Cost per Hectare Versus Off-Patent Synthetics | -1.9% | Global, most pronounced in price-sensitive markets | Short term (≤ 2 years) |
| Zero Residual Activity Necessitates Repeat Passes | -1.4% | Global, particularly extensive farming systems | Medium term (2-4 years) |
| Odor and Volatility Concerns in Greenhouse or Enclosed Settings | -0.8% | Developed markets with intensive greenhouse production | Short term (≤ 2 years) |
| Patchy Regulatory Alignment on Maximum Residue Limits | -0.6% | Global, affecting international trade | Long term (≥ 4 years) |
| Source: Mordor Intelligence | |||
Zero Residual Activity Necessitates Repeat Passes
Pelargonic acid provides only contact burn-down, so regrowth follows quickly, and two to four passes per season remain typical in row crops. Extra tractor time lifts fuel use and labor costs, which narrows already tight production margins. IR-4 Project plot trials in 2024 showed that four-pass programs increased total pelargonic acid volumes by 45% versus single-pass residual programs, trimming gross margins on corn and soybean fields. Municipal vegetation managers face similar pressures since repeat site visits require more crew hours and new work permits, stretching maintenance budgets. Precision drone sprayers can cut product rates by up to 30%, yet hardware prices remain out of reach for many small growers and public agencies. These operational and financial hurdles keep zero-residual pelargonic acid adoption concentrated in high-value crops and regulated public spaces rather than broadacre systems.
Higher Cost per Hectare Versus Off-Patent Synthetics
Pelargonic acid treatments can cost USD 45–60 per ha, roughly triple generic glyphosate, straining budgets for large-acre cereal growers. While premium produce sectors absorb these costs, commodity grain growers hesitate unless local glyphosate restrictions force adoption. Bulk acid producers are scaling capacity to cut costs, but synthetic price increases driven by supply tightness are narrowing the gap. As a result, adoption rates remain uneven, with growers weighing regulatory pressure against economic feasibility.
*Our forecasts treat driver/restraint impacts as directional, not additive. The impact forecasts reflect baseline growth, mix effects, and variable interactions.
Segment Analysis
By Formulation: Purity Standards Drive Market Segmentation
High-purity (more than 95%) products accounted for 48% pelargonic acid market share in 2024 because professional applicators require batch consistency and predictable toxicity profiles. These grades command premium prices but simplify registration across multiple geographies. The pelargonic acid esters market is growing at a 14.8% CAGR, owing to rain-fastness and reduced odor, making them well-suited for high-rainfall zones. Demand for ammonium nonanoate salts is growing as municipalities favor their low-volatility properties for safe application on playgrounds and sidewalks. Bulk manufacturers are therefore consolidating upstream oleochemical assets to secure fatty acid feedstocks and control quality.
Cost-sensitive buyers rely on 80–95% grades where marginal potency loss is acceptable in large-area spraying. Suppliers offer tailored adjuvant packages to offset lower purity and ensure adequate foliage coverage. Research teams are also exploring nano-emulsion carriers to improve leaf penetration while reducing active ingredient load. These advances collectively expand the pelargonic acid market by giving end users a spectrum of price-performance options.


By Crop Type: Specialty Crops Lead Adoption
Fruits and vegetables, with a 36.4% share of the pelargonic acid market size in 2024, continue to dominate because consumer scrutiny over residues is highest for fresh produce. Growers gain price premiums that justify higher herbicide spend. Turf and ornamentals are the fastest risers at 13.2% CAGR as cities restrict synthetic sprays on sports fields and residential lawns. These segments favor pelargonic acid for rapid burndown and for its safety to pets and children.
Cereal and grain adoption rests mainly on pre-plant burndown and harvest desiccation. Although costs restrain usage, new drone technology minimizes spray volumes and improves economics. Oilseeds and pulses are projected to post an 8.6% CAGR as sustainable canola and chickpea acreage is expanding in Canada and Australia. Strict residue limits in key export markets drive demand for pelargonic acid as a natural desiccant.
By Application: Herbicidal Uses Dominate
Herbicide functions captured 79% of 2024 revenue, cementing the chemical’s role as a fast-acting contact weed killer in both agriculture and municipal maintenance. Growers rely on its zero residual trait to rotate sensitive crops without plant-back delays. Harvest desiccation is the fastest-growing application at 15.1% CAGR because regulators question diquat and paraquat safety. Pelargonic acid offers comparable dry-down speed with lower environmental risk.
Blossom thinning in apples and stone fruit uses dilute sprays to regulate fruit set, constituting an important application segment within the pelargonic acid market. Efficacy depends on narrow timing, but improved sensor-based sprayers boost precision and reduce drift losses, enhancing overall productivity and adoption among high-value orchard growers.

Geography Analysis
Europe held 38% of the pelargonic acid market size in 2024, reflecting the continent’s aggressive pesticide-reduction goals within the European Green Deal. Germany, France, and the Netherlands command advanced distribution networks and a willingness to pay premiums. Municipal bans on conventional herbicides push demand from city parks to rail corridors. Supply constraints occasionally arise as regional factories rely on imported fatty acids, signaling an opportunity for local capacity investments.
Asia-Pacific records the fastest 13% CAGR to 2030. China’s pesticide policy favors low-toxicity compounds, moving domestic formulators toward pelargonic acid to meet both domestic and export standards. Japan’s rapid, sustainable acreage expansion and Australia’s vast certified land strengthen baseline demand. India has introduced subsidies for bio-based crop inputs, though broader adoption depends on future cost reductions.
North America is a mature yet steadily advancing region. The Environmental Protection Agency (EPA) tolerance exemptions permit the use of pelargonic acid in food, feed, and non-crop applications without residue limits [3]Source: United States Environmental Protection Agency, “Pesticide Tolerance Exemptions for Fatty Acids,” EPA, federalregister.gov. Precision agriculture tools lower application volumes, helping offset cost concerns among corn and soybean growers. The United States Department of Agriculture (USDA) Sustainable Transition Initiative allocates USD 300 million, directing new demand toward pelargonic acid programs for transitioning farms [4]Source: United States Department of Agriculture, “Organic Transition Initiative Funding Factsheet,” USDA, usda.gov.

Competitive Landscape
The pelargonic acid market shows moderate consolidation, with the top five manufacturers holding a significant portion of global revenue, a share large enough to shape pricing yet small enough to invite new ideas. Albaugh Holdings leads with a prominent share, supported by a diversified Pelargonic product line and a direct-to-retailer model that secures shelf space with row-crop dealers. Corteva Agroscience follows closely, leveraging its worldwide channel relationships to bundle Scythe herbicide with seed and trait packages, which helps growers simplify their procurement. Emery Oleochemicals and Nufarm Limited round out the leaderboard, each using long-term fatty acid supply contracts to stabilize input costs and protect margins. This structure encourages price competition in large bids while still rewarding companies that invest in better formulations.
Vertical integration is becoming the preferred path to maintain those rewards. Emery Oleochemicals recently added a dedicated esterification unit that turns bulk nonanoic acid into low-odor esters aimed at greenhouse customers. Nufarm draws on joint manufacturing sites in Australia and Austria to shorten lead times for European distributors. Belchim Crop Protection taps Mitsui & Co. trading channels to place pelargonic acid products in Japan and Southeast Asia, expanding its reach beyond traditional European strongholds. These moves illustrate how access to upstream feedstocks and cross-regional logistics can become clear differentiators when freight costs are volatile.
Innovation pressure is rising as newer entrants, such as Anitox Corporation, introduce pelargonic acid technologies that challenge incumbent suppliers for investment and market attention. Anitox Corporation secured patents for pelargonic acid antimicrobial blends that preserve animal feed, opening a revenue lane outside crop spraying. Established suppliers answer by filing new formulation patents, deploying digital application tools, and expanding technical-service teams that guide correct spray timing. Regulatory skill remains a decisive edge because national labels differ on use rates and buffer zones, so companies with deep registration portfolios move faster when new markets open.
Pelargonic Acid Industry Leaders
Albaugh Holdings
Corteva Agriscience
Belchim Crop Protection (Mitsui & Co.)
Emery Oleochemicals (PTT Global Chemical)
Nufarm Limited
- *Disclaimer: Major Players sorted in no particular order

Recent Industry Developments
- March 2025: Moa Technology has entered into a strategic partnership with Naicons Laboratories to develop advanced naturally occurring herbicides. The collaboration involves high-throughput screening of 70,000 microbial extracts, with Moa Technology securing exclusive development rights for any new herbicides discovered. This initiative aims to address the pressing demand for effective herbicides, as resistant weeds impose an annual cost exceeding USD 11 billion on the US economy.
- September 2024: The United States Environmental Protection Agency (US EPA) proposed tolerance actions for pelargonic acid, capric acid, and caprylic acid under the Federal Food, Drug, and Cosmetic Act. These actions include removing outdated application rate limits and redundant tolerance exemptions following safety evaluations.
- April 2024: Seipasa S.A. is prepared to register a new pelargonic acid bioherbicide. This product was developed in collaboration with the Polytechnic University of Valencia over a period of four years, with funding provided by the Valencian Institute of Business Competitiveness.


Global Pelargonic Acid Market Report Scope
Pelargonic Acid is a naturally occurring fatty acid primarily used as a contact herbicide and bio-based crop protection agent. The Pelargonic Acid Market Report is segmented by Formulation (Pelargonic Acid >95% Purity, Pelargonic Acid 80–95% Purity, Pelargonic Acid Esters and Ammonium Nonanoate Salt ), Crop Type (Cereals and Grains, Fruits and Vegetables, Oilseeds and Pulses and Turf and Ornamentals), Application (Herbicide, Blossom Thinner, and Harvest Desiccant), and Geography (North America, South America, Europe, Asia-Pacific, Africa, Niddle East and Africa). Market forecasts are provided in terms of value (USD).
| Pelargonic Acid (more than 95% purity) |
| Pelargonic Acid (80 to 95% purity) |
| Pelargonic Acid Esters |
| Ammonium Nonanoate Salt |
| Cereals and Grains |
| Fruits and Vegetables |
| Oilseeds and Pulses |
| Turf and Ornamentals |
| Herbicide |
| Blossom Thinner |
| Harvest Desiccant |
| North America | United States |
| Canada | |
| Mexico | |
| Rest of North America | |
| South America | Brazil |
| Argentina | |
| Rest of South America | |
| Europe | Germany |
| France | |
| Italy | |
| Spain | |
| United Kingdom | |
| Russia | |
| Rest of Europe | |
| Asia-Pacific | China |
| India | |
| Japan | |
| Australia | |
| Rest of Asia-Pacific | |
| Middle East | Saudi Arabia |
| Turkey | |
| Rest of Middle East | |
| Africa | South Africa |
| Nigeria | |
| Rest of Africa |
| By Formulation | Pelargonic Acid (more than 95% purity) | |
| Pelargonic Acid (80 to 95% purity) | ||
| Pelargonic Acid Esters | ||
| Ammonium Nonanoate Salt | ||
| By Crop Type | Cereals and Grains | |
| Fruits and Vegetables | ||
| Oilseeds and Pulses | ||
| Turf and Ornamentals | ||
| By Application | Herbicide | |
| Blossom Thinner | ||
| Harvest Desiccant | ||
| By Geography | North America | United States |
| Canada | ||
| Mexico | ||
| Rest of North America | ||
| South America | Brazil | |
| Argentina | ||
| Rest of South America | ||
| Europe | Germany | |
| France | ||
| Italy | ||
| Spain | ||
| United Kingdom | ||
| Russia | ||
| Rest of Europe | ||
| Asia-Pacific | China | |
| India | ||
| Japan | ||
| Australia | ||
| Rest of Asia-Pacific | ||
| Middle East | Saudi Arabia | |
| Turkey | ||
| Rest of Middle East | ||
| Africa | South Africa | |
| Nigeria | ||
| Rest of Africa | ||


Key Questions Answered in the Report
What is the current pelargonic acid market size?
The pelargonic acid market size is USD 180 million in 2025 and is projected to reach USD 293 million by 2030.
What CAGR is forecast for the pelargonic acid market?
The pelargonic acid market is forecasted to grow at a 10.20% CAGR between 2025 and 2030.
Which formulation segment is expanding the fastest?
Pelargonic acid ester formulations are advancing at a 14.8% CAGR because improved rain-fastness and lower odor spur wider adoption.
Which region shows the quickest growth?
Asia-Pacific leads in growth with a 13% CAGR, driven by China’s green-pesticide policies and Japan’s expanding organic acreage.
Page last updated on:


