Peer-To-Peer Dining Market Size and Share
Market Overview
| Study Period | 2021 - 2031 |
|---|---|
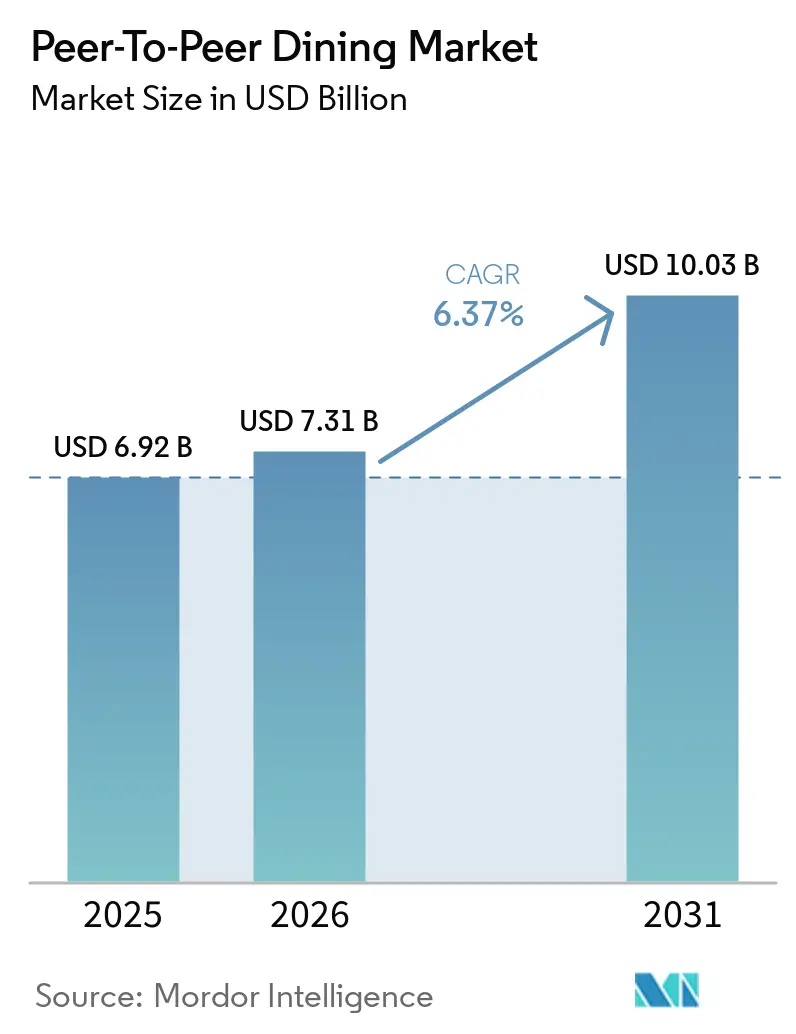
| Market Size (2026) | USD 7.31 Billion |
| Market Size (2031) | USD 10.03 Billion |
| Growth Rate (2026 - 2031) | 6.37% CAGR |
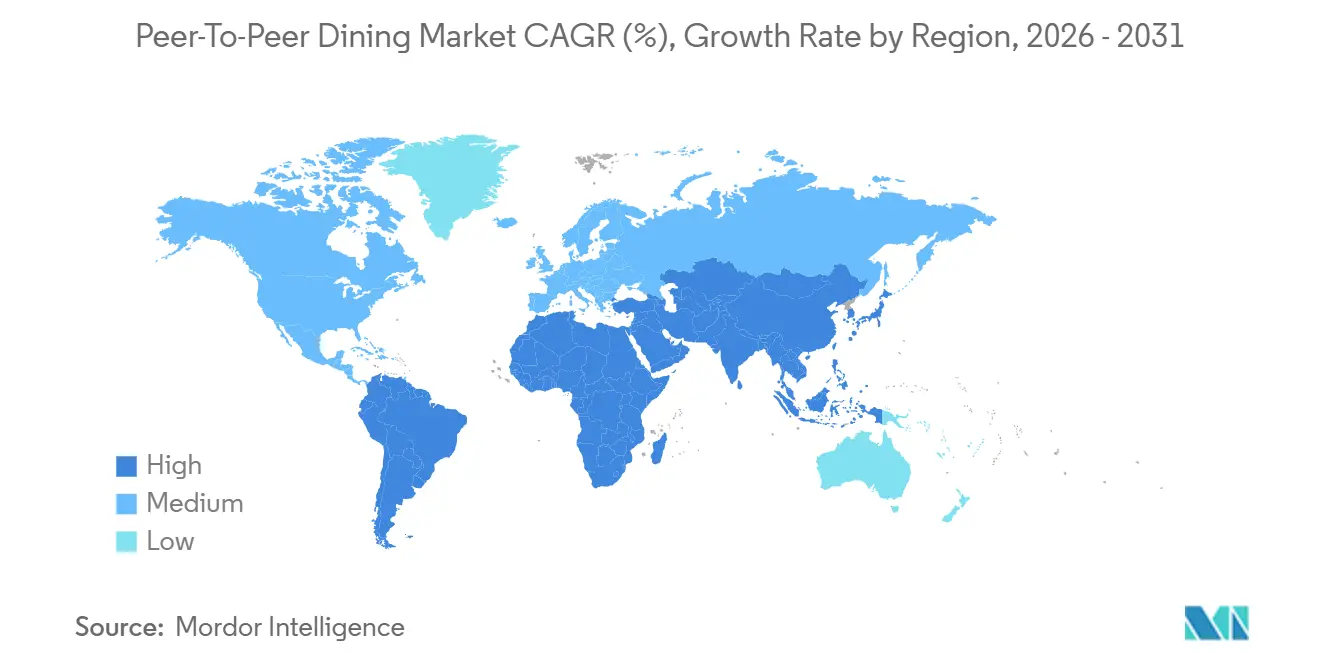
| Fastest Growing Market | Asia Pacific |
| Largest Market | North America |
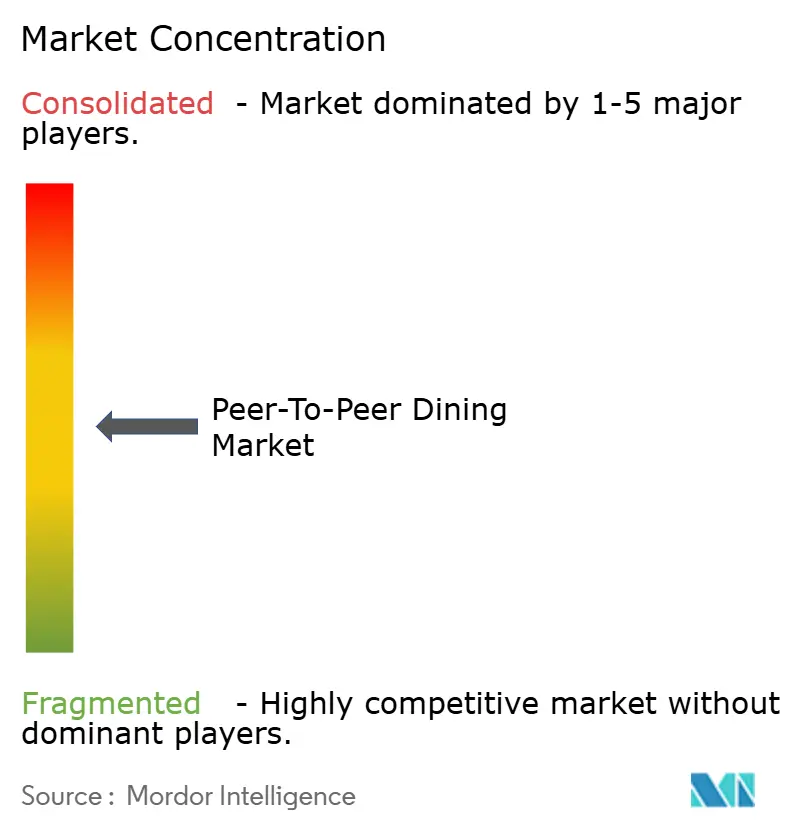
| Market Concentration | Medium |
Major Players *Disclaimer: Major Players sorted in no particular order Image © Mordor Intelligence. Reuse requires attribution under CC BY 4.0. | |
Peer-To-Peer Dining Market Analysis by Mordor Intelligence
The peer-to-peer dining market is expected to grow from USD 6.92 billion in 2025 and USD 7.31 billion in 2026 to USD 10.03 billion by 2031, with a CAGR of 6.37% between 2026 and 2031. Blended monetization models are gaining traction, with aggregator marketplaces enhancing discovery and niche platforms driving higher willingness to pay through host vetting and provenance transparency. Subscription models like Deliveroo Plus improve retention and predictability in order patterns. High-intent dining occasions benefit from instant booking, standardized menus, and transparent pricing, boosting conversions. Regional growth depends on digital payment maturity, tourism recovery, and regulatory compliance, with North America leading and Asia-Pacific showing strong momentum. Regulatory clarity and insurance challenges limit scalability, prompting platforms to invest in compliance automation, liability frameworks, and host education to efficiently meet safety and privacy standards[1]OpenTable Newsroom, “Company Updates and Industry Insights,” opentable.com.
Key Report Takeaways
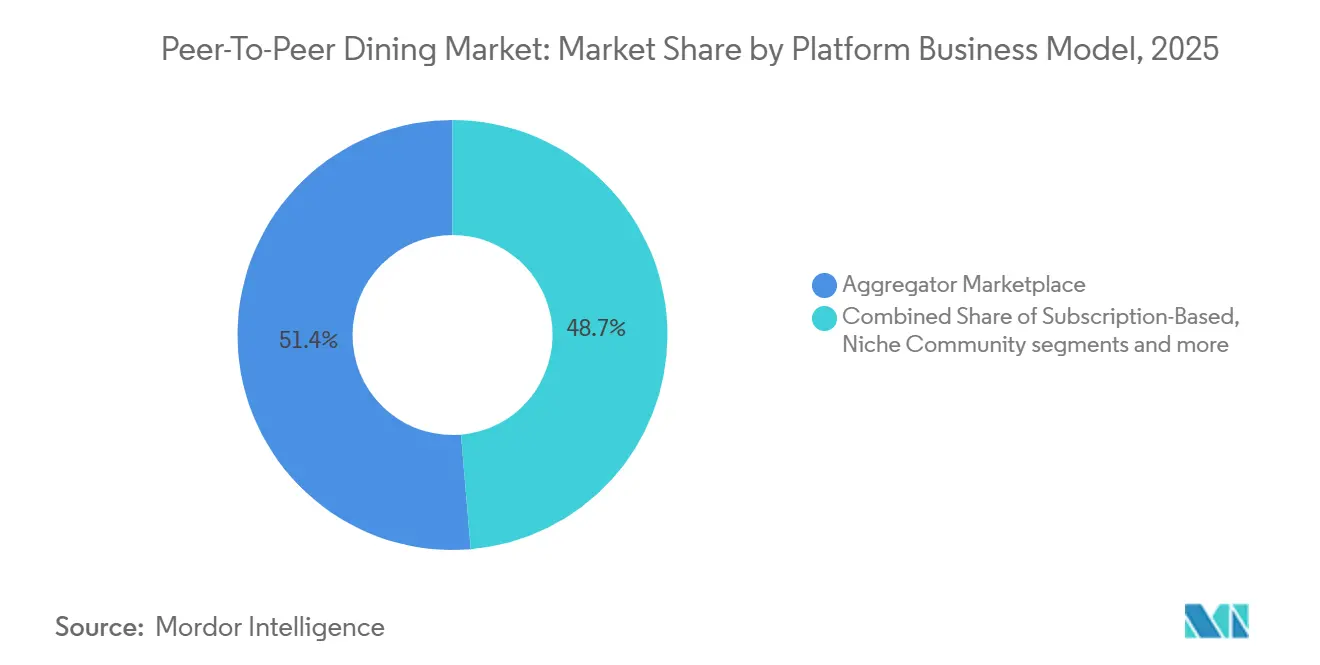
- By platform business model, Aggregator Marketplaces led with 51.35% revenue share in 2025 in the Peer-To-Peer Dining Market, while Niche Community Platforms are projected to grow at a 6.93% CAGR through 2031.
- By occasion, Leisure and Experiential Dining accounted for a 47.85% share in 2025 in the Peer-To-Peer Dining Market, while Professional Networking Meals are projected to expand at a 7.65% CAGR through 2031.
- By end-user demographics, Domestic users held a 67.55% share in 2025 in the Peer-To-Peer Dining Market, while International travelers are projected to grow at a 7.43% CAGR through 2031.
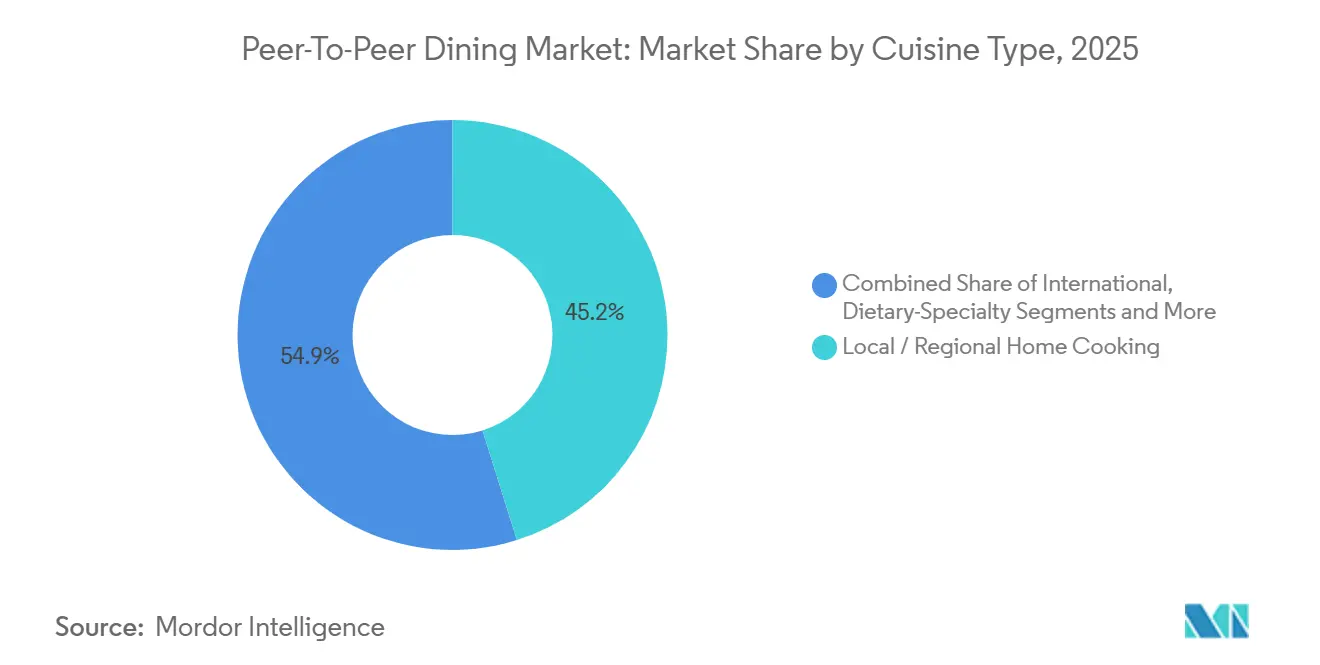
- By cuisine type, Local and Regional Home Cooking captured 45.15% share in 2025 in the Peer-To-Peer Dining Market, while Dietary-Specialty cuisine is advancing at an 8.45% CAGR through 2031.
- By geography, North America held 30.55% of global activity in 2025 in the Peer-To-Peer Dining Market, while Asia-Pacific is projected as the fastest-growing region at an 8.14% CAGR through 2031Driver / Restraint (as applicable in title case) (~) % Impact on CAGR Forecast Geographic Relevance Impact Timeline
- Increasing consumer preference for immersive and experience-driven dining formats +0.8% Global, strongest in APAC and Europe Medium term (2-4 years)
- Growing need for supplemental income streams among hosts amid economic volatility +0.5% North America, Europe, mature gig-economy markets Short term (≤ 2 years)
- Rising adoption of app-based platforms enabling seamless booking and digital payments +0.6% Global, highest penetration in North America, Western Europe, APAC urban hubs Short term (≤ 2 years)
- Strong influence of social media on discovery of unique and local culinary experiences +0.4% Global, particularly Gen Z and Millennial cohorts Short term (≤ 2 years)
- Emergence of blockchain-enabled systems enhancing trust, transparency, and user credibility +0.3% Nordic countries, selective APAC pilots in the 2026 wave Long term (≥ 4 years)
- Expansion of localized micro-tourism and farm-to-table dining concepts +0.5% Europe including Southern and Nordic markets, and North America regional corridors Medium term (2-4 years)
Note: Market size and forecast figures in this report are generated using Mordor Intelligence’s proprietary estimation framework, updated with the latest available data and insights as of January 2026.
Global Peer-To-Peer Dining Market Trends and Insights
Drivers Impact Analysis*
| Drivers | (~) % Impact on CAGR Forecast | Geographic Relevance | Impact Timeline |
|---|---|---|---|
| Increasing consumer preference for immersive and experience-driven dining formats | +0.8% | Global, strongest in Asia-Pacific and Europe | Medium term (2-4 years) |
| Growing need for supplemental income streams among hosts amid economic volatility | +0.5% | North America, Europe, mature gig-economy markets | Short term (≤ 2 years) |
| Rising adoption of app-based platforms enabling seamless booking and digital payments | +0.6% | Global, highest penetration in North America, Western Europe, Asia-Pacific urban hubs | Short term (≤ 2 years) |
| Strong influence of social media on discovery of unique and local culinary experiences | +0.4% | Global, particularly Gen Z and Millennial cohorts | Short term (≤ 2 years) |
| Emergence of blockchain-enabled systems enhancing trust, transparency, and user credibility | +0.3% | Nordic countries, selective Asia-Pacific pilots in the 2026 wave | Long term (≥ 4 years) |
| Expansion of localized micro-tourism and farm-to-table dining concepts | +0.5% | Europe including Southern and Nordic markets, and North America regional corridors | Medium term (2-4 years) |
| Source: Mordor Intelligence | |||
Increasing Consumer Preference for Immersive and Experience-Driven Dining Formats
Experiential dining formats are seeing strong consumer demand for curated at-home chefs, private events, and personalized menus, as demonstrated by Airbnb’s 2025 Services relaunch, which attracted over 60,000 host applications and achieved an average rating of 4.9 stars. Private and group dining marketplaces address this demand by offering instant reservations, transparent pricing, and streamlined event coordination, simplifying planning for hosts and diners. Membership and subscription models promote repeat bookings and higher engagement, with increased activity correlating to higher membership levels, providing a stable revenue model. Safety measures like allergen labeling, provenance claims, and dietary controls, aligned with FDA guidelines, build trust by combining home settings with professional standards. Recognized sourcing and preparation standards, visible host credentials, and transparent reviews reduce uncertainty and support premium positioning across international markets. The peer-to-peer dining market benefits from rising high-intent bookings and qualified hosts investing in quality, compliance, and storytelling, ensuring consistent experiential value and fostering repeat business.
Growing Need for Supplemental Income Streams Among Hosts Amid Economic Volatility
Host monetization in the Peer-to-Peer Dining Market is supported by platforms that minimize fixed overheads and facilitate discovery, payments, and value-added services. These platforms enable households to leverage culinary skills and storytelling to generate flexible income, particularly during times of financial strain. Subscription-based ordering models stabilize earnings by increasing transaction frequency among paid users, sustaining demand within curated dining ecosystems. Regulatory frameworks significantly influence host participation: Georgia eased entry barriers by removing a state-level cottage-food license in 2025, while Illinois enforces stricter compliance measures, such as Certified Food Protection Manager requirements and pH testing for acidified products. Platforms offering training and compliance tools reduce regulatory challenges, strengthening the market.
Rising Adoption of App-Based Platforms Enabling Seamless Booking and Digital Payments
Digital payments and mobile-first booking are streamlining processes as contactless options gain adoption in markets with established card networks and mobile wallets, enabling seamless peer-to-peer dining with instant confirmation and integrated menus. Reservation tools in super-apps improve discovery and conversion, while Tap-to-Phone and software-based payment acceptance expand payment points by turning smartphones into NFC terminals. Subscription programs enhance engagement by rewarding frequent users and supporting home-hosted or chef-led dining. Ecosystem integration across mobility, reservations, and delivery strengthens network effects, while consumer education on evolving payment frameworks and data-sharing standards remains critical for building trust and ensuring convenience.
Strong Influence of Social Media on Discovery of Unique and Local Culinary Experiences
Social media platforms connect guests with local culture and hosts, a strategy also used by public agencies to promote cross-border goodwill through bookable home-meal experiences. By targeting high-affinity communities based on dietary preferences, these platforms convert engagement into reservations through transparent disclosures and defined host responsibilities. As social content drives demand surges, capacity management and expectation setting are crucial to maintaining ratings and repeat bookings. Compliance with endorsement and advertising regulations, including FTC guidelines, is essential. Platforms combining user-generated content, structured booking processes, moderated reviews, and policy education effectively transform social interest into reliable, high-quality reservations, sustaining the peer-to-peer dining ecosystem[2]Destination Canada, “Tourism and Cultural Exchange Programs,” destinationcanada.com.
Restraints Impact Analysis*
| Restraints | (~) % Impact on CAGR Forecast | Geographic Relevance | Impact Timeline |
|---|---|---|---|
| Complex regulatory frameworks and licensing requirements across regions | -0.4% | Global, acute in United States with state variation and European Union data rules | Medium term (2-4 years) |
| Concerns related to food safety standards and hygiene compliance in home settings | -0.3% | Global, heightened in jurisdictions with foodborne illness history | Short term (≤ 2 years) |
| Limited availability of insurance coverage for informal or residential dining events | -0.2% | Primarily North America and select European markets | Medium term (2-4 years) |
| Increasing data privacy and security risks associated with location-based platforms | -0.2% | European Union with GDPR, North America under CCPA and state rules, Asia-Pacific emerging | Long term (≥ 4 years) |
| Source: Mordor Intelligence | |||
Complex Regulatory Frameworks and Licensing Requirements Across Regions
Regulatory differences across states and municipalities create varying compliance requirements for hosts and platforms. Georgia removed state cottage-food licensing but allowed municipalities to restrict third-party retail sales. Illinois imposes Certified Food Protection Manager credentials and pH testing, raising entry barriers for new hosts. Vermont’s higher exemption threshold limits sales to specific venues, while Maryland excludes certain products unless reclassified, narrowing menu options. Los Angeles County’s MEHKO framework caps revenue and restricts HACCP-dependent items. South Carolina confines cottage-food sales to intrastate transactions, and Airbnb guidance highlights that local food-service rules apply even when meals are free or guest-prepared[3]Georgia Department of Agriculture, “State Regulatory Guidance,” agr.georgia.gov.
Concerns Related to Food Safety Standards and Hygiene Compliance in Home Settings
Home kitchens operate without continuous oversight, requiring jurisdictions to mandate disclosures about non-inspection to ensure transparency and shared risk management. States like Maryland enforce warnings to emphasize hygiene, storage separation, and allergen control. At the same time, Illinois uses self-certification checklists for pest management, storage, and domestic activity limits, with penalties escalating from education to fines. Los Angeles County categorizes violations by severity, requiring documented procedures, and rural areas add private well water testing. Consistent allergen labeling, aligned with federal guidelines, protects guests and upholds host credibility across markets[4]Los Angeles County Department of Public Health, “Food‑Service and MEHKO Regulations,” publichealth.lacounty.gov.
*Our forecasts treat driver/restraint impacts as directional, not additive. The impact forecasts reflect baseline growth, mix effects, and variable interactions.
Segment Analysis
By Platform Business Model: Hybrid Marketplaces Capture Scale, Niche Players Claim Premiums
Aggregator marketplaces accounted for 51.35% of the peer-to-peer dining market in 2025, while niche community platforms grew at a 6.93% CAGR through 2031, underscoring the coexistence of large-scale discovery engines and curated premium experiences. Aggregators enhance liquidity through network effects, enabling instant booking, secure payments, and policy compliance at scale. Subscription models improve retention and revenue, especially when paired with curated or experiential offerings. Niche platforms justify premium pricing through storytelling, provenance, and trust signals, supported by manual vetting and training that elevate services to private-chef standards. Corporate and group dining workflows benefit from streamlined private-room discovery, menu planning, and upfront pricing, reducing friction and boosting event frequency. Regulatory frameworks, such as revenue caps, product exclusions, and food safety requirements like pH testing, influence the feasibility of models in home settings versus commercial kitchens. Aggregators balance high-demand capacity with host education and documentation to maintain trust in residential environments. Hybrid models combining subscriptions, à-la-carte options, and bundled experiences create multiple entry points for repeat usage and upselling. Together, these dynamics illustrate how scale, specialization, and regulatory compliance drive sustainable growth in the peer-to-peer dining market.


By Occasion/Purpose: Leisure Dominates, Professional Networking Surges as Hybrid Work Normalizes
Leisure and experiential dining captured 47.85% market share in 2025, driven by peer-hosted meal formats that cater to demand for curated, bookable experiences aligned with dietary and wellness preferences. Cultural exchange opportunities grew through government programs that connect travelers with local hosts for home dinners, enhance hospitality outreach, and convert tourism interest into meaningful visits. Professional networking meals are projected to grow at a 7.65% CAGR through 2031, supported by the need for reliable, private settings with culinary storytelling. Home-chef formats complement restaurant private rooms by enabling personalized small-group interactions, provided allergen labeling and storage controls ensure safety. Integrated discovery, instant booking, and transparent pricing reduce planning challenges and encourage frequent gatherings. Policy frameworks limiting residential meal volumes or restricting certain items shape home-hosted occasions, while larger corporate events rely on licensed caterers and restaurant partners. Platforms act as intermediaries, matching demand with compliant supply channels. Cross-selling between leisure and professional occasions enhances platform efficiency, with subscription benefits fostering repeat usage among high-intent users. As platforms expand capacity and refine policies, occasion segments can scale effectively while maintaining service quality through balanced discovery, clear expectation management, and host support.
By End-User Demographics: Domestic Loyalists Anchor Volume, International Adventurers Drive Premiums
Domestic users accounted for 67.55% of the peer-to-peer dining market in 2025, driven by lower search and trust costs, familiar payment systems, and a clear understanding of local regulations, making home-hosted dining a routine activity. International travelers, growing at a CAGR of 7.43% through 2031, are drawn to experiential depth and curated cultural access, especially when meals align with seasonal or community celebrations. Integrated tools for mobility, payments, and reservations simplify coordination for visitors, while government-backed initiatives promote cross-border cultural exchange through vetted home-dining experiences. Standardized host education and clear disclosures align expectations for both domestic and international users.
Domestic users sustain weekday and local celebration volumes, supported by subscription and loyalty programs that encourage frequent participation. International guests rely on transparent data handling and compliance with cross-border regulations, emphasizing the need for strong privacy and security frameworks. Platforms guide users toward legally compliant booking options where restrictions apply, ensuring a seamless guest experience. Long-term market growth, with domestic users capturing 67.55% of the market and international users growing at a 7.43% CAGR, is tied to travel cycles, cultural programming, and consistent standards for allergen labeling, food handling, and disclosures. These measures enable hosts to confidently serve both user groups while maintaining trust across borders.
By Cuisine Type: Local Comfort Anchors Share, Dietary Specialty Sprints as Wellness Premiums Compound
Local and Regional Home Cooking held 45.15% of the peer-to-peer dining market, reflecting the appeal of tradition-focused menus and family recipes that offer provenance, cultural context, and personal connection. International and fusion concepts attract cosmopolitan diners, with diaspora chefs using platforms to blend local ingredients with global techniques under clear safety and labeling rules. Dietary-Specialty cuisine is growing at a 8.45% CAGR through 2031, driven by wellness positioning and allergen transparency, which provide consumers with limited mainstream options with confidence. Luxury or fine-dining experiences monetize craftsmanship but face restrictions in home settings due to public health rules on high-risk items. Platform tools standardize menu disclosures and simplify preparation requirements, helping hosts maintain quality and compliance. Product-level regulations determine which items qualify under cottage-food pathways, prompting operators to invest in testing, such as pH verification, to expand menus safely. Transparent sourcing and traceability enhance guest trust, meeting expectations for professional standards in residential kitchens. Clear allergen information and strong sanitation practices build repeat demand across cuisine types. As dietary-specialty demand grows, platforms can expand compliant offerings through template labels and education modules, while Local and Regional Home Cooking remains a stable, high-satisfaction market segment.
Geography Analysis
North America accounted for 30.55% of global peer-to-peer dining activity in 2025, driven by strong platform penetration, high payment readiness, and integrated partnerships connecting ride-hailing, delivery, and reservations to enhance convenience and reliability. Canada’s government-led home-dining initiatives promote cultural exchange while ensuring safety and structured discovery. Regulatory differences across states and cities prompt platforms to use geo-fencing, policy prompts, and standardized disclosures to prevent compliance issues and maintain trust. Clear guidance on food-service regulations, including for free or third-party-prepared meals, supports a compliance-focused approach for responsible market growth. Europe combines high urban adoption with diverse national food-service regulations aligned with European Union privacy and data-rights standards. Blockchain-based traceability and Digital Product Passport pilots indicate a future where transparency and provenance support premium pricing. Consolidated reservation marketplaces help restaurants and hosts monetize underutilized capacity with instant confirmations and transparent pricing, while tap-based payments and mobile wallets simplify transactions and reduce drop-offs. Enhanced privacy protections and redress mechanisms build confidence among European diners in secure and transparent discovery, booking, and payment processes.
Asia-Pacific is the fastest-growing market, with a projected CAGR of 8.13% through 2031, driven by widespread mobile payment familiarity, rapid app-based booking adoption, and strong interest in curated culinary experiences. Integrated mobility and payment ecosystems meet consumer expectations in major metropolitan areas, while privacy-by-design features encourage broader adoption. Blockchain usability research highlights opportunities to simplify traceability, critical in markets where safety and naturalness influence dining preferences. Clear regulatory frameworks and host-education tools help small operators comply with labeling and handling requirements, enabling scalable growth while maintaining consistency, safety, and regulatory compliance.

Competitive Landscape
The peer-to-peer dining market remains fragmented, with home-hosted dining, chef-led subscriptions, and experiential marketplaces coexisting, with no single operator achieving a dominant market share. Reinvestment in services and reimagined experiences has expanded host onboarding and integrated stays with curated dining options, strengthening multi-use ecosystems. Reservation marketplaces enhance private and group dining by reducing planning time and offering transparent pricing, while mobility-reservation partnerships improve reliability and reduce no-shows through coordinated transport-to-table services. Investments in policy education, dispute resolution, and standardized disclosures foster trust and enable cross-regional scaling where regulations permit. Platforms increasingly adopt a mix of subscription and à-la-carte models to capture a larger share of consumer spending, combining recurring orders with episodic offerings to cater to diverse budgets and occasions. Digital-ordering infrastructure providers prioritize privacy and data protection, emphasizing compliance-by-design as loyalty programs, payment systems, and on-premise integrations expand.
Corporate meal and event bookings represent a significant growth opportunity, with standardized tools, instant confirmations, and clear expense tracking addressing enterprise requirements. Risk-sharing frameworks differentiate platforms by clarifying coverage conditions for hosts in residential settings. Ecosystem consolidation is anticipated, driven by the integration of loyalty programs, payment systems, and operational capabilities that add value by improving authorization rates and reducing friction, while maintaining robust privacy controls. Reservation platforms leverage high-quality first-party data to support advertising models that subsidize platform improvements and alleviate take-rate pressures. Multi-country partnerships with card networks attract premium customer segments by offering access privileges and capacity guarantees. As competition intensifies, providers that prioritize discovery, trust, and convenience within regulatory frameworks - and invest in host tools, payment systems, and guest experiences - are well-positioned to secure a sustainable share of high-intent dining occasions.
Peer-To-Peer Dining Industry Leaders
EatWith
Withlocals
Airbnb Experiences (Dining)
Travelling Spoon
Feastly
- *Disclaimer: Major Players sorted in no particular order

Recent Industry Developments
- February 2026: OpenTable launched OpenTable Media, an advertising solution powered by first-party diner data, with pilot partners Diageo, Ghirardelli, and Cobra Beer to expand monetization beyond reservations.
- November 2025: Destination Canada launched OpenHome, a limited-time series of bookable dinners inviting Americans into Canadian homes nationwide from November 13, 2025 to February 28, 2026, promoted and managed in partnership with OpenTable.
- September 2025: Airbnb introduced five Chef’s Table experiences with award-winning chefs and integrated them into its Originals portfolio to deepen curated dining within the platform’s services roadmap.
- September 2025: DoorDash launched Going Out to integrate reservations and in-store rewards within the delivery app, working with hospitality partners to drive new-venue trial and loyalty member benefits.


Global Peer-To-Peer Dining Market Report Scope
The Peer-To-Peer Dining Market report provides a global analysis of home-hosted dining, chef-led experiences, subscription-based culinary models, and reservation-driven private dining across leisure, cultural, and professional occasions. It assesses market size, growth projections, and segmentation by platform business models, occasions, end-user demographics, cuisine types, and geographic regions. The study evaluates market drivers, restraints, regulatory frameworks, supply chain dynamics, and technological advancements influencing platform adoption. Competitive analysis includes market concentration, strategic initiatives, share analysis, and company profiles. The report incorporates Porter’s Five Forces framework and highlights emerging opportunities and long-term growth prospects for 2026 - 2031, with all values expressed in USD billion.
| Aggregator Marketplace |
| Subscription-Based |
| Niche Community Platforms |
| Corporate / Group Catering |
| Leisure & Experiential Dining |
| Cultural Exchange |
| Professional Networking Meals |
| Home-Chef Meal Delivery |
| Domestic |
| International |
| Local / Regional Home Cooking |
| International / Fusion |
| Dietary-Specialty (Vegan, Gluten-Free, Keto) |
| Luxury / Fine-Dining Experiences |
| North America | Canada |
| United States | |
| Mexico | |
| South America | Brazil |
| Peru | |
| Chile | |
| Argentina | |
| Rest of South America | |
| Europe | United Kingdom |
| Germany | |
| France | |
| Spain | |
| Italy | |
| BENELUX (Belgium, Netherlands, Luxembourg) | |
| NORDICS (Denmark, Finland, Iceland, Norway, Sweden) | |
| Rest of Europe | |
| Asia-Pacific | India |
| China | |
| Japan | |
| Australia | |
| South Korea | |
| South-East Asia (Singapore, Malaysia, Thailand, Indonesia, Vietnam, Philippines) | |
| Rest of Asia-Pacific | |
| Middle East & Africa | United Arab Emirates |
| Saudi Arabia | |
| South Africa | |
| Nigeria | |
| Rest of Middle East & Africa |
| By Platform Business Model | Aggregator Marketplace | |
| Subscription-Based | ||
| Niche Community Platforms | ||
| Corporate / Group Catering | ||
| By Occasion / Purpose | Leisure & Experiential Dining | |
| Cultural Exchange | ||
| Professional Networking Meals | ||
| Home-Chef Meal Delivery | ||
| By End-User Demographics | Domestic | |
| International | ||
| By Cuisine Type | Local / Regional Home Cooking | |
| International / Fusion | ||
| Dietary-Specialty (Vegan, Gluten-Free, Keto) | ||
| Luxury / Fine-Dining Experiences | ||
| By Geography | North America | Canada |
| United States | ||
| Mexico | ||
| South America | Brazil | |
| Peru | ||
| Chile | ||
| Argentina | ||
| Rest of South America | ||
| Europe | United Kingdom | |
| Germany | ||
| France | ||
| Spain | ||
| Italy | ||
| BENELUX (Belgium, Netherlands, Luxembourg) | ||
| NORDICS (Denmark, Finland, Iceland, Norway, Sweden) | ||
| Rest of Europe | ||
| Asia-Pacific | India | |
| China | ||
| Japan | ||
| Australia | ||
| South Korea | ||
| South-East Asia (Singapore, Malaysia, Thailand, Indonesia, Vietnam, Philippines) | ||
| Rest of Asia-Pacific | ||
| Middle East & Africa | United Arab Emirates | |
| Saudi Arabia | ||
| South Africa | ||
| Nigeria | ||
| Rest of Middle East & Africa | ||


Key Questions Answered in the Report
What is the current size and 2031 outlook for the peer-to-peer dining market?
The peer-to-peer dining market size is projected to expand from USD 6.92 billion in 2025 and USD 7.31 billion in 2026 to USD 10.03 billion by 2031 at a 6.37% CAGR, reflecting steady adoption supported by discovery, payments, and compliance-ready workflows.
Which segments lead and which are growing fastest within the peer-to-peer dining market?
Aggregator Marketplaces led with 51.35% share in 2025 while Niche Community Platforms are projected as the fastest at a 6.93% CAGR, and by occasion Leisure and Experiential Dining led with 47.85 % while Professional Networking Meals show a 7.65% CAGR.
Which regions are most important for near-term growth in the peer-to-peer dining market?
North America held 30.55% of 2025 activity, while Asia-Pacific is projected as the fastest growing region at an 8.13% CAGR through 2031 due to strong app-based adoption and integrated mobility and payment experiences.
How does regulation affect scaling in the peer-to-peer dining market?
Regulation shapes entry, menus, and sales channels with examples such as Georgia’s state-level license removal paired with municipal opt-outs and Illinois’s CFPM credential and pH testing, which hosts and platforms must navigate to scale.
What role do payments and subscriptions play in the peer-to-peer dining market?
Embedded reservations, contactless acceptance, and subscription perks reduce friction and increase frequency, with tiered programs demonstrating higher order cadence that supports stable monetization and supply planning on platforms.
How is food safety and privacy addressed in the peer-to-peer dining market?
Safety is enforced through labeling, sanitation, and product-level rules tied to public health guidance, while privacy frameworks such as GDPR and CCPA drive consent and data-handling practices for addresses, dietary data, and payment credentials.
Page last updated on:


