Passenger Information Display Market Size and Share
Market Overview
| Study Period | 2020 - 2031 |
|---|---|
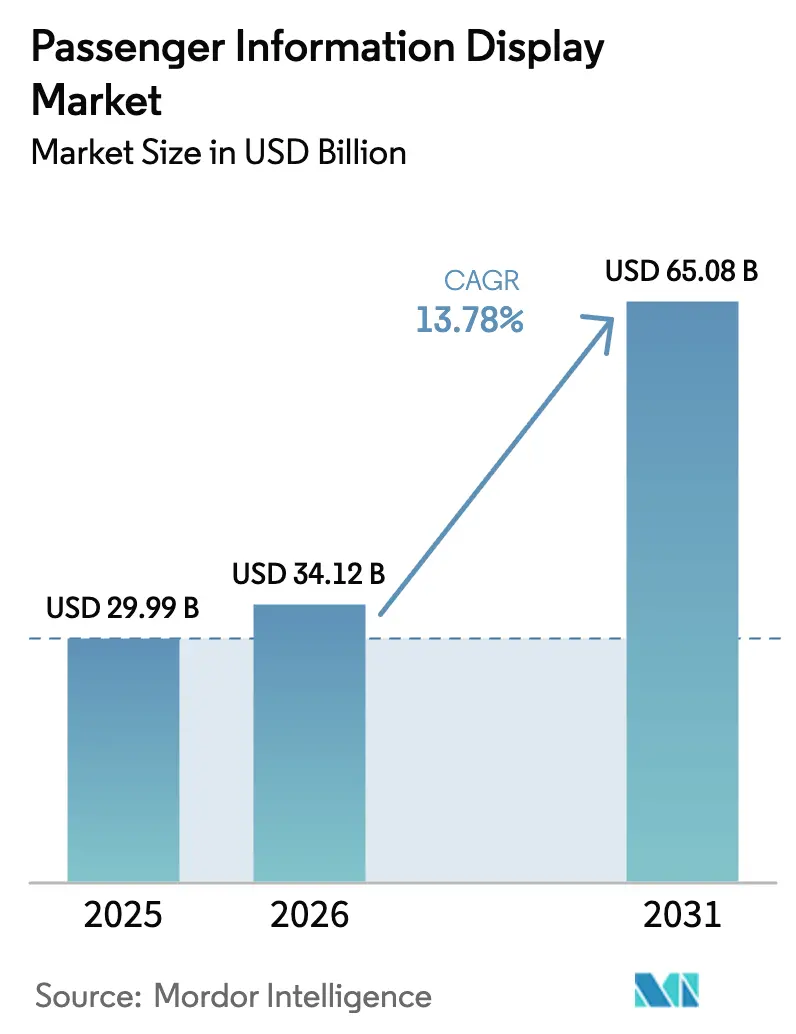
| Market Size (2026) | USD 34.12 Billion |
| Market Size (2031) | USD 65.08 Billion |
| Growth Rate (2026 - 2031) | 13.78% CAGR |
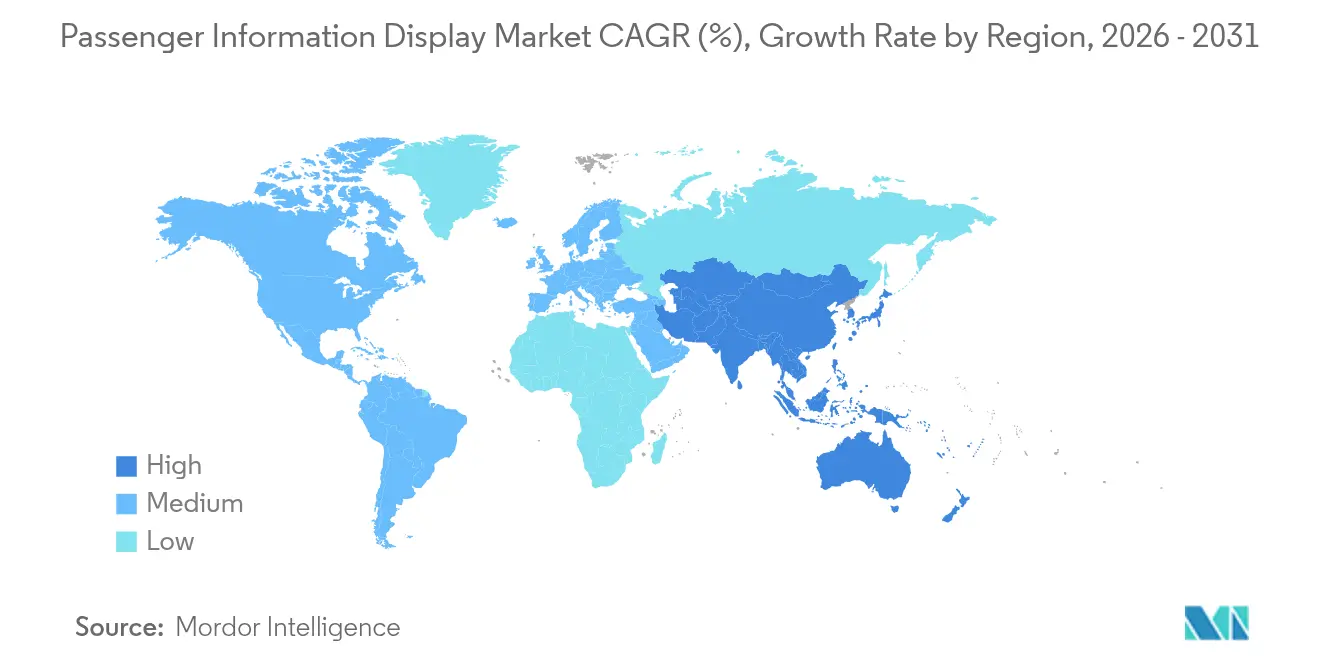
| Fastest Growing Market | Asia Pacific |
| Largest Market | North America |
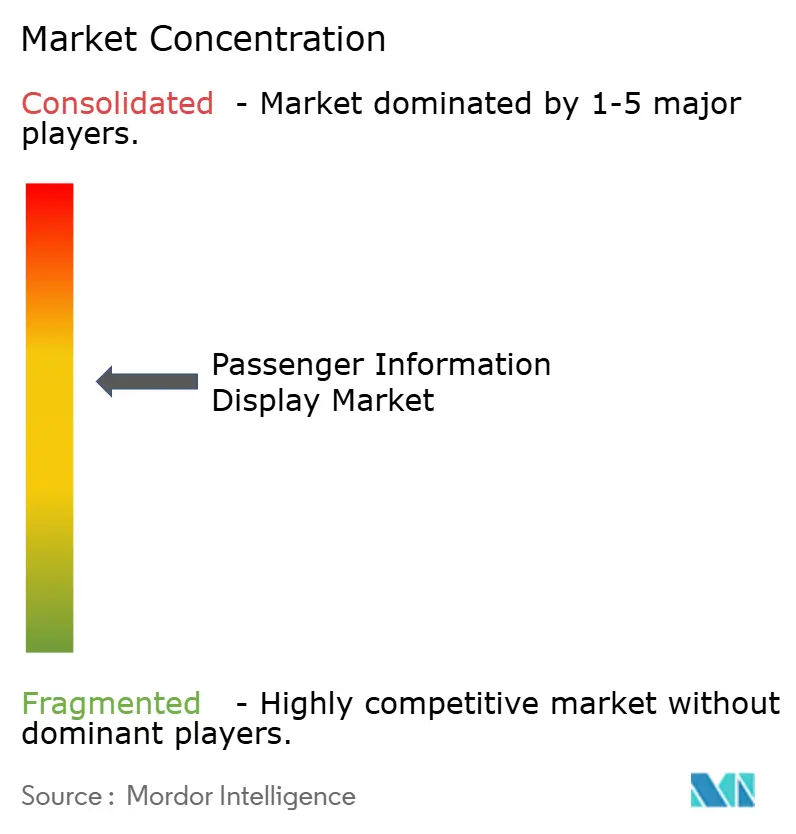
| Market Concentration | Medium |
Major Players *Disclaimer: Major Players sorted in no particular order Image © Mordor Intelligence. Reuse requires attribution under CC BY 4.0. | |
Passenger Information Display Market Analysis by Mordor Intelligence
passenger information display market size in 2026 is estimated at USD 34.12 billion, growing from 2025 value of USD 29.99 billion with 2031 projections showing USD 65.08 billion, growing at 13.78% CAGR over 2026-2031. Rising urban populations, continual digitization of public‐transport systems, and regulatory pressure for real-time, accessible communication are key factors underpinning this trajectory. Governments are prioritizing smart-city transportation upgrades, transit agencies are embedding IoT sensors into rolling stock and terminals, and display makers are shifting to energy-efficient formats to meet carbon-reduction targets. Competitive intensity is accelerating as suppliers integrate hardware, software, and analytics to win turnkey contracts, while programmatic advertising revenue offers operators fresh monetization avenues. Finally, regional growth differentials—most notably the outsized momentum in Asia-Pacific and Africa—are widening, prompting multinationals to localize procurement and service footprints.
Key Report Takeaways
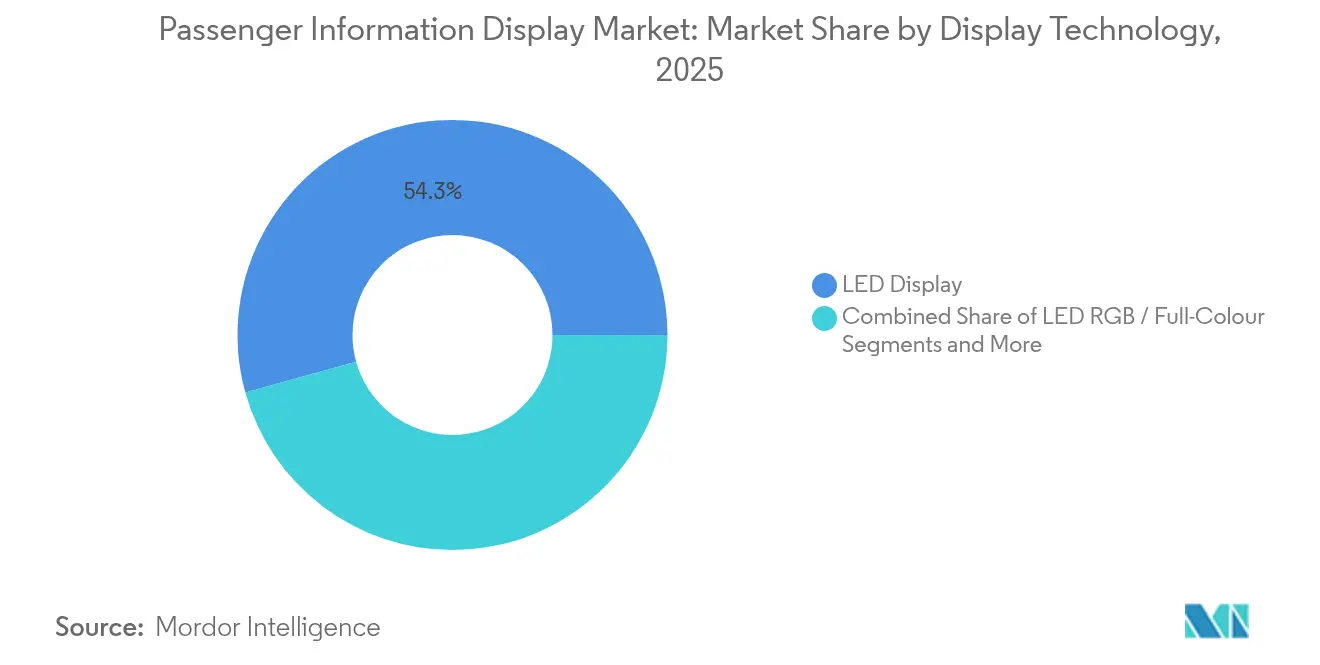
- By display technology, LED displays held 54.31% of the passenger information display market share in 2025, whereas e-paper displays are forecast to expand fastest at 18.40% CAGR through 2031.
- By application, railway stations commanded 39.05% revenue share in 2025; Bus Rapid Transit systems are projected to post the highest 14.62% CAGR to 2031.
- By transport mode, public transport operators controlled 69.05% of the passenger information display market size in 2025, while smart-city mobility hubs are anticipated to grow at 16.55% CAGR.
- By region, Asia-Pacific led with a 42.35% share in 2025, whereas Africa is set to progress at a 15.28% CAGR through 2031.
Note: Market size and forecast figures in this report are generated using Mordor Intelligence’s proprietary estimation framework, updated with the latest available data and insights as of 2026.
Global Passenger Information Display Market Trends and Insights
Drivers Impact Analysis*
| Driver | (~) % Impact on CAGR Forecast | Geographic Relevance | Impact Timeline |
|---|---|---|---|
| Real-time service quality expectations | +2.8% | Global, higher in developed markets | Short term (≤ 2 years) |
| Smart public-transport and IoT investments | +3.2% | Asia-Pacific core, spill-over to North America and EU | Medium term (2-4 years) |
| Urban metro network expansions | +2.1% | Asia-Pacific, Middle East, select African cities | Long term (≥ 4 years) |
| Regulatory mandates on passenger accessibility | +1.9% | North America and EU, expanding to Asia-Pacific | Medium term (2-4 years) |
| Solar-powered e-paper roll-outs at rural stops | +1.4% | Africa, rural Asia-Pacific, Latin America | Long term (≥ 4 years) |
| Programmatic DOOH monetization on displays | +2.0% | Global, concentrated in urban transit hubs | Short term (≤ 2 years) |
| Source: Mordor Intelligence | |||
Real-time service quality expectations
Riders now judge system reliability on the immediacy and accuracy of digital updates. Deployments such as NEC’s 2-second-latency Bus Rapid Transit information feed in Ahmedabad reduced perceived wait times and boosted ridership satisfaction. Nationwide initiatives mirror this push: Transport for NSW fitted 1,800 regional buses with live tracking to bridge rural-urban information gaps.[1]Transport for NSW, “Regional Bus Tracking Rollout,” transport.nsw.gov.au The passenger information display market benefits directly as agencies replace static boards with connected screens able to synchronize with smartphone apps, deliver multimodal trip options, and issue disruption alerts. Competitive differentiation is thus shifting from hardware longevity to data latency and system responsiveness.
Smart public-transport and IoT investments
Between 2024 and 2027, 5G-enabled transit networks represent a USD 1.2 billion installation opportunity, converting displays into edge devices that collect passenger-flow data and report asset health. Shenyang Metro’s LTE-M upgrade supports CBTC, CCTV, and passenger information across five lines, highlighting the trend toward converged communications platforms.[2]Huawei, “Shenyang Metro LTE-M Upgrade,” carrier.huawei.com IoT analytics allow operators to adjust content automatically according to crowd density or weather, enhancing contextual relevance and reducing maintenance downtime. The passenger information display market therefore gains recurring software revenue streams layered on traditional hardware sales.
Urban metro network expansions
China’s 46,000 km high-speed rail grid moves more than 10 million passengers daily, each station stipulating digital signage as part of construction standards. Similar greenfield rail corridors in the Middle East and Africa incorporate visual-audio information from day one, locking in multi-year display procurement. The Elizabeth line upgrade in London shows brownfield impact: Thales’ driver advisory system required cohesive platform displays across 70 trains, modernizing legacy assets while aligning with smart-city integration goals. Growth prospects for the passenger information display market are therefore tightly coupled to infrastructure pipelines.
Regulatory mandates on passenger accessibility
Legislation such as the Americans with Disabilities Act obliges every new or retrofitted vehicle to feature public-address systems that provide equivalent visual cues. Complementary guidance stresses cybersecurity hygiene for connected displays. Compliance costs prompt agencies to replace analog signage with certified digital units meeting audio-visual parity, color-contrast ratios, and text-size requirements. Suppliers that pre-certify across multiple jurisdictions enjoy shortened sales cycles, giving them an edge in the passenger information display market.
Restraints Impact Analysis*
| Restraint | (~) % Impact on CAGR Forecast | Geographic Relevance | Impact Timeline |
|---|---|---|---|
| High CAPEX and OPEX for ruggedised outdoor units | -2.3% | Global, harsh climate regions | Short term (≤ 2 years) |
| Cyber-security and legacy system integration risk | -1.8% | Developed markets with aging infrastructure | Medium term (2-4 years) |
| MicroLED / driver-IC supply-chain volatility | -1.5% | Global, APAC manufacturing hubs | Short term (≤ 2 years) |
| Night-time energy-curfew brightness limits | -0.9% | Energy-constrained regions, rural areas | Long term (≥ 4 years) |
| Source: Mordor Intelligence | |||
High CAPEX and OPEX for ruggedised outdoor units
Outdoor displays must tolerate vandalism, torrential rain, and temperature swings, pushing unit costs to two or three times indoor equivalents. Protective enclosures, anti-glare coatings, active cooling, and redundant power add complexity that strains transit-agency budgets, especially in desert or Arctic climates where downtime carries safety implications. Ongoing energy draw from heaters or air-conditioning further inflates operational expense. Consequently, some agencies delay upgrades or substitute lower-spec bulletin boards, slowing near-term penetration of the passenger information display market.
Cyber-security and legacy system integration risk
Connected signage linked to SCADA, fare collection, and video surveillance broadens the attack surface. The Federal Transit Administration has emphasized patch management and network segmentation after incidents in which display controllers were exploited as footholds into wider OT systems.[3]Federal Transit Administration, “Cybersecurity Considerations for Connected Transit Systems,” transit.dot.gov Older stations commonly run serial interfaces or proprietary protocols that complicate end-to-end encryption. Upgrades often require middleware and continuous security monitoring, adding 5-10% to lifecycle cost and prompting cautious rollouts in the passenger information display market.
*Our forecasts treat driver/restraint impacts as directional, not additive. The impact forecasts reflect baseline growth, mix effects, and variable interactions.
Segment Analysis
By Display Technology: Energy-efficient formats accelerate replacement cycles
LED displays, despite drawing 54.31% revenue in 2025, are steadily ceding growth momentum to e-paper and hybrid video walls. Larger LED screens remain the default for main concourses due to high brightness and wide viewing angles. However, power budgets are prompting operators to favor bistable alternatives for timetable posters, rural stops, and auxiliary wayfinding. E-paper units, consuming only 7-8 mJ/cm² versus LCD’s continuous 6 µW/cm², support solar power and lower total cost of ownership, helping the passenger information display market expand into unpowered sites. Suppliers such as E Ink and Papercast installed Japan’s first smart bus stop in Aizuwakamatsu, validating outdoor durability and low-energy performance.
Mini-LED and micro-LED remain aspirational for mass deployment. Supply disruptions following project cancellations at major handset brands forced ams OSRAM to record EUR 600-900 million impairments, demonstrating procurement risk for transit buyers. Still, premium airport lounges and flagship metro hubs are piloting micro-LED walls for advertising revenue aligned with programmatic DOOH platforms. As these successes multiply, the passenger information display market size allocated to advanced emissive technologies is projected to outpace classical LCD growth between 2026 and 2031.


By Application: BRT momentum reshapes deployment priorities
The passenger information display market size attached to railway stations is significant, with 39.05% share in 2025. Yet BRT corridors contribute the fastest 14.62% CAGR, driven by rapid network rollouts in Indonesia, Mozambique, and Kenyan metros. Semarang’s GPS-enabled governance demonstrates how real-time bus positioning and GSM data streams improve operational headways and passenger satisfaction. Railway stations, benefiting from legacy funding and high passenger throughput, continue investing in large-format LED boards and multilingual wayfinding software. However, capex cycles in rail are longer, moderating incremental growth relative to bus corridors.
Airports, ferry terminals, and cruise ports represent adjacent uptake verticals. The Federal Register’s 2025 maritime cybersecurity rules obligate cruise lines and port authorities to harden networks and modernize passenger notification systems. Consequently, coastal cities allocate budgets for weatherproof displays that double as emergency alert beacons during extreme events. Highway toll plazas increasingly deploy dynamic message signs to manage congestion and broadcast safety advisories, reflecting the passenger information display market’s diversification across surface-transport environments.
By Transport Mode: Mobility hubs catalyze ecosystem partnerships
Public transport operators held 69.05% of global revenue in 2025, anchoring the passenger information display market. Their dominance is underpinned by entrenched procurement frameworks and steady farebox or subsidy income. Nonetheless, integrated smart-city mobility hubs are expanding at 16.55% CAGR. Orange County’s mobility hub blueprint bundles bus, rail, bike-share, and micro-transit into a single campus, necessitating interoperable displays that switch context seamlessly between modes. These hubs emphasize journey orchestration over single-mode visibility, driving demand for cloud-native content platforms and open APIs.
Commercial fleet operators are also installing displays on charter buses and corporate shuttles to differentiate service and monetize captive audiences. Freight hubs co-located with passenger terminals use common signage infrastructure to publish customs alerts and slot-time updates, illustrating spillover opportunities for vendors. The passenger information display market therefore benefits from converging mobility services that blur traditional mode boundaries.
Geography Analysis
Asia-Pacific commands 42.35% of global revenue, reflecting monumental rail and bus infrastructure spending. China’s high-speed network alone spans 46,000 km and moves over 10 million passengers daily, necessitating resilient, bilingual display systems calibrated for sub-second latency. Shenyang Metro’s LTE-M upgrade spans 165 km and embeds passenger information alongside CBTC to ensure synchronized safety and service data. Japan is retrofitting 90% of its unpowered bus stops with solar e-paper, a strategy enabled by ultra-low power displays. Australia’s statewide rollout of real-time bus tracking further underscores APAC’s technology leadership.
Africa is the fastest-growing geography at 15.28% CAGR. Kigali’s smart-bus program publishes live arrivals and route maps to reduce commuter uncertainty and spur public-transit adoption. Funding from development banks and private investors is catalyzing BRT lanes in cities such as Lagos and Nairobi. Yet harsh climates and limited grid access heighten interest in solar-e-paper bundles, creating a distinctive technology mix in the passenger information display market.
North America and Europe show steady upgrade cycles anchored by regulatory compliance. The ADA and EU accessibility directives compel transit authorities to modernize signage with visual-audio parity. Alstom’s EUR 600 million contract with Deutsche Bahn to install 1,890 digital interlockings will pair signaling upgrades with refreshed passenger displays.

Competitive Landscape
The passenger information display market is moderately fragmented. Hitachi Rail’s USD 1.83 billion purchase of Thales’ Ground Transportation Systems business positions the enlarged entity to surpass USD 6.23 billion in annual rail revenue and shift its mix toward software-defined offerings by 2027. Siemens Mobility’s EUR 48 billion backlog and 8.9% margin demonstrate the scale advantages enjoyed by full-service integrators able to bundle signaling, rolling stock, and displays.
Energy efficiency and connectivity are principal differentiators. E Ink and Papercast target rural, solar-only deployments, while LG and Samsung focus on large-format LED and OLED panels for premium hubs. White-space entrants such as Connectpoint supply cloud CMS platforms that transform commodity hardware into intelligent end-points. Programmatic advertising specialists partner with transit agencies to unlock additional revenue, exemplified by the USD 17.28 billion DOOH segment growing at 7.77% CAGR. Established players defend share by offering lifecycle services—remote monitoring, spare-parts logistics, and cybersecurity patching—bundled under multiyear service-level agreements.
Regional localization is another competitive theme. Chinese suppliers leverage domestic scale to underprice imports across ASEAN and Africa, while European incumbents market proven compliance with stringent EN-50155 and cybersecurity standards. The passenger information display market therefore balances cost, energy profile, and regulatory alignment when transit agencies shortlist vendors.
Passenger Information Display Industry Leaders
Alstom
Cubic Corporation
Hitachi Ltd.
Indra Sistemas S.A.
Mitsubishi Electric Corporation
- *Disclaimer: Major Players sorted in no particular order

Recent Industry Developments
- March 2025: Alstom signed a EUR 600 million framework agreement with Deutsche Bahn for German rail network digitalization, covering at least 1,890 interlocking units from 2025 to 2032.
- June 2025: Alstom released a white paper on Adessia commuter trains, detailing sustainable mobility solutions and integrated passenger information systems.
- October 2024: Cubic Transportation Systems won a Tasmanian government contract to deploy account-based smart ticketing across the state’s public transport network by 2026.
- September 2024: Alstom secured an USD 84 million deal with Clark County Department of Aviation to supply ten Innovia APM R vehicles and upgrade Las Vegas airport’s people-mover system.


Global Passenger Information Display Market Report Scope
Passenger Information Display Systems (PIDS) serve as electronic platforms delivering real-time updates to travelers across diverse transportation venues. Whether in elevators, trains, buses, airports, or other public transit hubs, PIDS play a pivotal role. They showcase vital details, including arrival and departure times, route specifics, station names, safety directives, and emergency notifications, all aimed at enhancing the passenger journey.
The study tracks the revenue accrued through the sale of passenger information display systems by various players across the globe. It also tracks the key market parameters, underlying growth influencers, and major vendors operating in the industry, which supports the market estimations and growth rates over the forecast period. The study further analyses the overall impact of COVID-19 aftereffects and other macroeconomic factors on the market. The report’s scope encompasses market sizing and forecasts for the various market segments.
The passenger information display market is segmented by display type (LED displays, LCD displays, OLED displays, and others), application (railway stations, airports, bus stations, and metros), end-use (public transport, commercial transport, and freight transport), and geography (North America, Europe, Asia Pacific, Middle East and Africa, and Latin America. The market sizes and forecasts regarding value (USD) for all the above segments are provided.
| LED Display |
| LED RGB / Full-Colour |
| Mini-LED |
| LCD TFT |
| OLED |
| E-Paper |
| Hybrid Video Walls |
| Railway Stations |
| Metro and Urban Rail |
| Airports |
| Bus Rapid Transit and Terminals |
| Ferry and Cruise Ports |
| Highway Toll Plazas |
| Public Transport Operators |
| Commercial Transport Operators |
| Freight and Logistics Operators |
| Smart-City Mobility Hubs |
| North America | United States | |
| Canada | ||
| Mexico | ||
| South America | Brazil | |
| Argentina | ||
| Rest of South America | ||
| Europe | United Kingdom | |
| Germany | ||
| France | ||
| Italy | ||
| Spain | ||
| Russia | ||
| Rest of Europe | ||
| Asia-Pacific | China | |
| Japan | ||
| India | ||
| South Korea | ||
| Australia and New Zealand | ||
| Rest of Asia-Pacific | ||
| Middle East and Africa | Middle East | Saudi Arabia |
| UAE | ||
| Turkey | ||
| Rest of Middle East | ||
| Africa | South Africa | |
| Nigeria | ||
| Kenya | ||
| Rest of Africa | ||
| By Display Technology | LED Display | ||
| LED RGB / Full-Colour | |||
| Mini-LED | |||
| LCD TFT | |||
| OLED | |||
| E-Paper | |||
| Hybrid Video Walls | |||
| By Application | Railway Stations | ||
| Metro and Urban Rail | |||
| Airports | |||
| Bus Rapid Transit and Terminals | |||
| Ferry and Cruise Ports | |||
| Highway Toll Plazas | |||
| By Transport Mode (End-Use) | Public Transport Operators | ||
| Commercial Transport Operators | |||
| Freight and Logistics Operators | |||
| Smart-City Mobility Hubs | |||
| By Geography | North America | United States | |
| Canada | |||
| Mexico | |||
| South America | Brazil | ||
| Argentina | |||
| Rest of South America | |||
| Europe | United Kingdom | ||
| Germany | |||
| France | |||
| Italy | |||
| Spain | |||
| Russia | |||
| Rest of Europe | |||
| Asia-Pacific | China | ||
| Japan | |||
| India | |||
| South Korea | |||
| Australia and New Zealand | |||
| Rest of Asia-Pacific | |||
| Middle East and Africa | Middle East | Saudi Arabia | |
| UAE | |||
| Turkey | |||
| Rest of Middle East | |||
| Africa | South Africa | ||
| Nigeria | |||
| Kenya | |||
| Rest of Africa | |||


Key Questions Answered in the Report
What is the current size of the passenger information display market?
The market stands at USD 34.12 billion in 2026 and is forecast to double to USD 65.08 billion by 2031.
Which region leads global demand?
Asia-Pacific accounted for 42.35% of revenue in 2025, propelled by extensive rail and bus infrastructure investments.
Why are e-paper displays gaining traction?
E-paper consumes as little as 7–8 mJ/cm², enabling solar-powered installations that lower operating costs and support rural rollouts.
What segment is growing fastest?
Bus Rapid Transit applications are expanding at a projected 14.62% CAGR through 2031, helped by network expansions in Africa and Southeast Asia.
Page last updated on:


